
Accumulation structure forming, redistribution risk remains
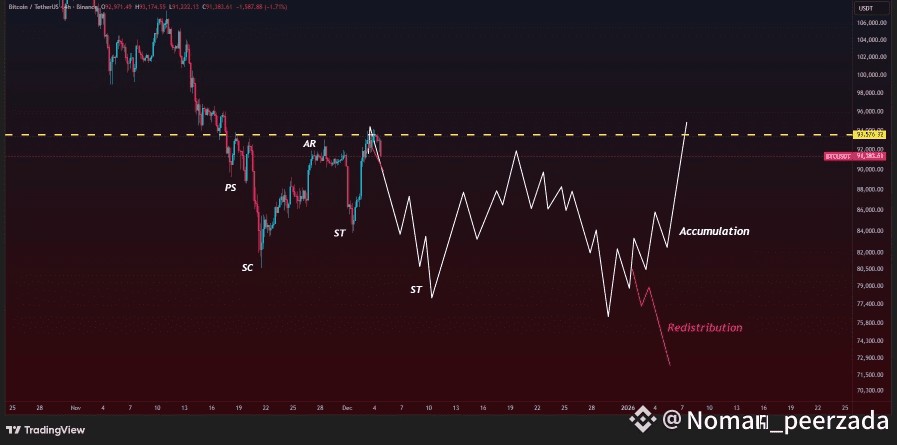
Bitcoin is trading at a critical decision point after a sharp rebound from the mid-November decline. Price behavior under the $93,500–94,200 supply band will decide whether current market structure is a real Wyckoff Accumulation, or a redistribution trap before another markdown.
The recent move from the Selling Climax (SC) created the Automatic Rally (AR) and defined the current range. Price is now testing the same liquidity band where breakout failed earlier — indicating strong supply overhead.
Wyckoff Structure Snapshot
The structure displays classic accumulation mechanics:
PS → SC: panic selling absorbed by strong hands
AR: first strong demand reaction from lows
ST: tests show lower volatility and supply reduction
LPS candidate: the decline from 94K may be the Last Point of Support
The logic is valid only if the range support holds. A breakdown below the floor flips the pattern from Accumulation → Redistribution.
Scenario A — Accumulation → Expansion
If BTC holds the 87,200–86,500 support band:
Higher lows = supply absorption
Range volatility compresses
Liquidity builds beneath resistance
Breakout above 94K forms the Sign of Strength (SOS)
This opens targets at:
$98,000
$102,000
$106,000+
This behavior aligns with Wyckoff Phase C → D where smart money lifts the floor before trend expansion.
Scenario B — Redistribution → Lower Liquidity
If BTC breaks down below 84,800:
Failed breakout becomes an Upthrust After Distribution (UTAD)
Secondary Tests break lower → no accumulation validation
Rally becomes a short-covering bounce, not demand base
Downside liquidity is exposed toward:
$78,000
$76,000
$72,000
This implies a continuation of markdown until the market finds true structural demand.
Why Accumulation Has the Edge
The bullish case gains probability if:
Downside legs show declining volume → sellers exhausting
Strong responses near $90K act as soft floor
Miners add reserves → reducing sell pressure
Risk-on macro tone supports BTC demand above $90K
If these dynamics hold, a Phase D breakout is the natural next step.
How to Read the Next Move
Forget the breakout candle — watch support behavior.
Above 87K → accumulation remains valid
Below 84.8K → redistribution becomes dominant
Wyckoff principle:
> “Support is truth; resistance is narrative.”
This means the bottom of the range reveals smart-money intention — not the top.
Key Price Map
94,200 → breakout confirmation zone
87,200–86,500 → accumulation support
84,800 → invalidation level
78,000–76,000 → liquidity test if markdown continues
72,000 → deep correction liquidity
Trend logic changes at each threshold.
Positioning Insight
Inside decision ranges:
Aggressive traders position near support, not resistance
Conservative traders wait for breakout confirmation
Avoid chasing into 94K supply wall
Range logic wins until the market proves trend.
Final Read
Bitcoin sits on a powerful Wyckoff fork.
The structure leans accumulative — if support holds and downside volume remains weak. A clean breakout above $94K completes the accumulation and opens the next macro leg.
If support fails, expect a continuation into lower liquidity zones before a true base forms.
Today’s View:
> Bitcoin holds accumulation potential; the next demand test decides trend direction.
#Bitcoin #BTC #CryptoAnalysis $BTC
