

In simpler terms, a gap refers to a price discontinuity on a chart. In trading you can define "gap" as "discontinuity," "interval," or "break."
WHAT IS A GAP IN TRADING
As we know already, a gap in trading refers to a discontinuity on a price chart.
A gap up occurs when the opening price of a new candle is significantly higher than the closing price and the high of the previous candle.
Similarly, a gap down occurs when the opening price of a new candle is significantly lower than the closing price and the low of the previous candle.
THE REASONS BEHIND GAP FORMATION
There are two primary reasons for the formation of gaps:
Trading session interruptions: Gaps can occur due to interruptions in exchange trading, such as overnight or weekend breaks when no trading takes place.
Increased trading activity: Gaps can also form as a result of heightened trading activity triggered by significant news releases or other important events.
Let's delve deeper into both aforementioned reasons:
Trading session interruptions
Each market operates on its own schedule:
Forex and futures markets trade nearly around the clock on weekdays, in a mode close to 24/5;
Cryptocurrencies trade without interruptions, operating 24/7;
Stock trading, ETFs, and certain other assets follow a 6-8 hour workday schedule.
When markets are closed, events can unfold that may impact prices when the exchange reopens. For instance, below is an example of a gap on the S&P 500 E-mini futures chart.
These contracts are traded on the CME Group exchange, which introduced the Globex system in 1992, enabling nearly continuous trading on weekdays.
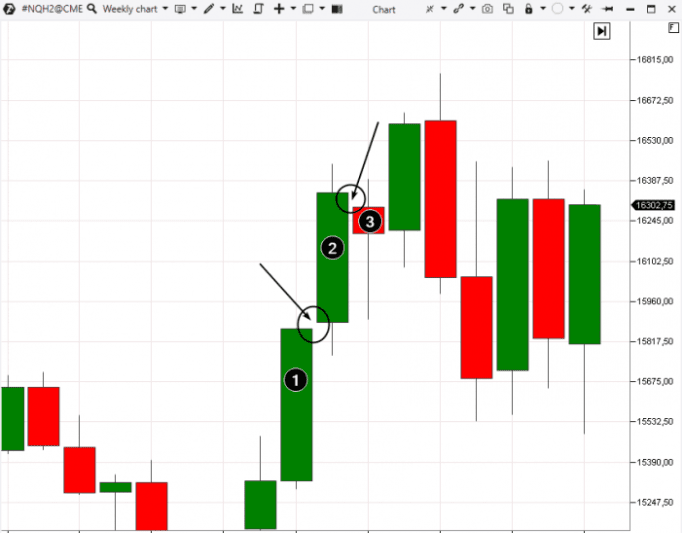
The time frame depicted is daily, where the number 1 represents a Friday candle, and the number 2 represents a Monday candle. Friday exhibited optimism, and over the weekend, investor optimism grew, resulting in a gap formation at the opening of the Monday candle relative to the Friday candle.
After the Monday trading session, trading was halted for clearing. Upon the opening of the Tuesday candle (number 3), we also observe the formation of a significant gap, which is unusual for S&P 500 E-mini futures within a week. Smaller gaps within the week often occur when trading resumes after a brief overnight interruption.
The chart above displays a gap in the gold futures market. It occurred when the COMEX exchange suspended trading for one hour during the night, according to its schedule.
Increased trading activity
Trading financial assets is closely linked to fundamental information, such as:
Decisions made by central banks and financial regulators;
Publication of economic statistics;
Statements made by politicians.
As a result, gaps can form due to a sudden shift in the balance of supply and demand. The detailed process of how this occurs will be discussed in the following section.
Analysis of the graph with the Depth of Market indicator
Let us examine the graph accompanied by the Depth of Market indicator.
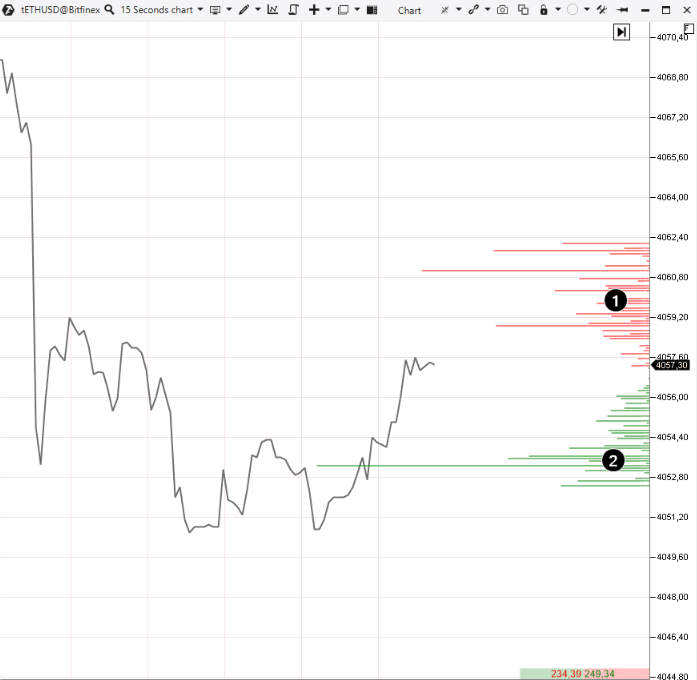
The futures market is known for its popularity and high liquidity. Speculators engage in trading activities while others hedge their positions to mitigate risks. Trading on centralized exchanges in futures markets is nearly continuous, with gaps typically appearing after a brief overnight pause when trading participants decrease in number. An example can be observed in the chart above, where a gap occurred in the gold futures market.
In the cryptocurrency market, exchanges operate without interruptions; however, this does not imply the absence of gaps. Gaps in cryptocurrencies primarily occur due to two reasons:
Exotic instruments with low liquidity: Due to a limited number of buyers and sellers, orders are not placed at all price levels, resulting in price fluctuations and the formation of gaps.
Small price increments: For instance, on certain exchanges, the price increment for trading bitcoins may be as small as $1 (or even expressed in cents), while the price of bitcoin itself is measured in tens of thousands of dollars. As a result, orders for bitcoin and other popular instruments are not placed at all price levels, leading to the formation of gaps that are only visible when the price scale is significantly expanded.
The stock market is prone to frequent gap formations. Typically, each new trading day opens with a price gap relative to the previous day's closing price.
Tom Williams, the creator of the VSA (Volume Spread Analysis) strategy, stated that strong players sometimes utilize gaps to their advantage during pre-market trading. They "leapfrog" over resistance levels instead of absorbing massive sell orders near them.
How can one trade using gaps?
Allow me to provide a brief overview of three trading strategies involving gaps:
Gap Breakout Strategy: This strategy focuses on trading the gap itself, looking for opportunities when the price breaks through the gap and continues in that direction;
Gap Fill Strategy: This approach involves trading with the expectation that the price will eventually fill or close the gap, aiming to profit from the price returning to its pre-gap level;
Candlestick Pattern based on Gaps: This strategy involves analyzing candlestick patterns that form around gaps, using them as indicators to make trading decisions;
Please note that this is not an exhaustive list, as gaps can be utilized in various other trading strategies.
GAP BREAKOUT
When trading a stock opens with a gap that breaks through the resistance of the previous day, it creates a potential setup for buying.
For instance, let's consider the chart of TSLA stock as an example.
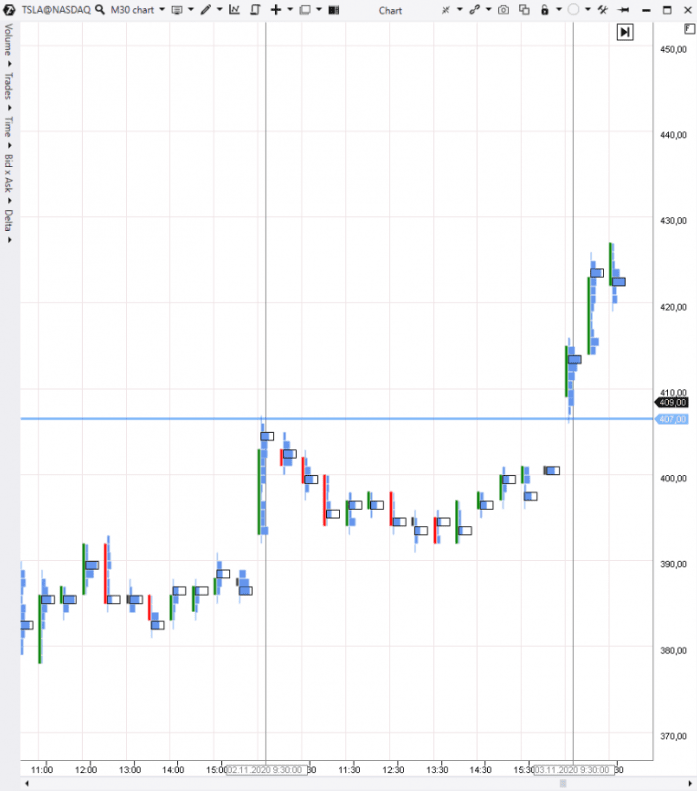
The price seems to have surpassed the level of 407. Perhaps, in this way, significant interest is attempting to push the stock towards higher peaks, and the gap beyond the 407 level acts as a barrier for buyers, conserving resources required to overcome seller resistance.
Upon observing such a gap, you may consider shifting your focus to lower timeframes to engage in intraday trading, with the expectation that the ascending trend will gather strength.
For instance, a 30-second chart reveals a straightforward setup for entering a long position following an upward gap at the market open.
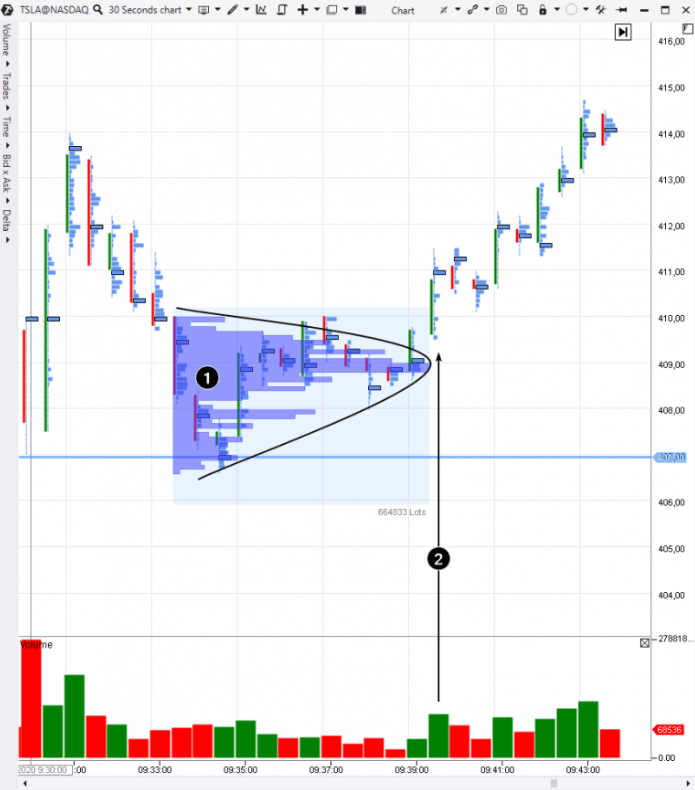
Numerically depicted:
Short-term balance after the market open with a gap.
Buyer's efforts towards breaking through the short-term balance (rising price accompanied by increasing volume). Entering long positions upon the close of this candle would be justified.
GAP FILL
It is believed that when a gap forms, the price often (but not always!) tends to return to it. This is known as gap filling.
As a definition, a gap is considered filled when the price returns to the level it was at before the gap formed. However, this rule is not absolute. Charts similar to the one displayed below can be encountered.
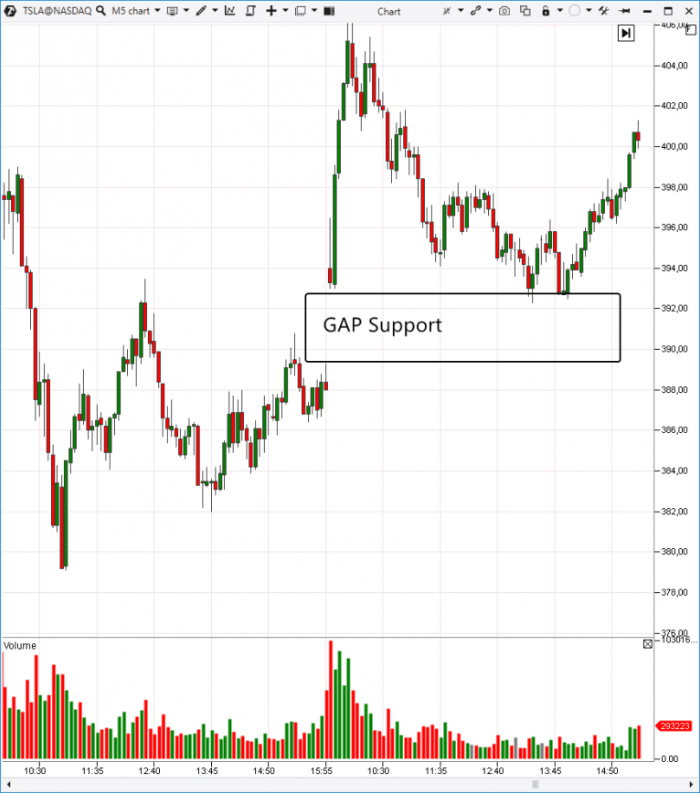
At the market open, the price of TSLA formed an upward gap, which later acted as a support zone. Buying from this zone is a variation of trading based on gap closure.
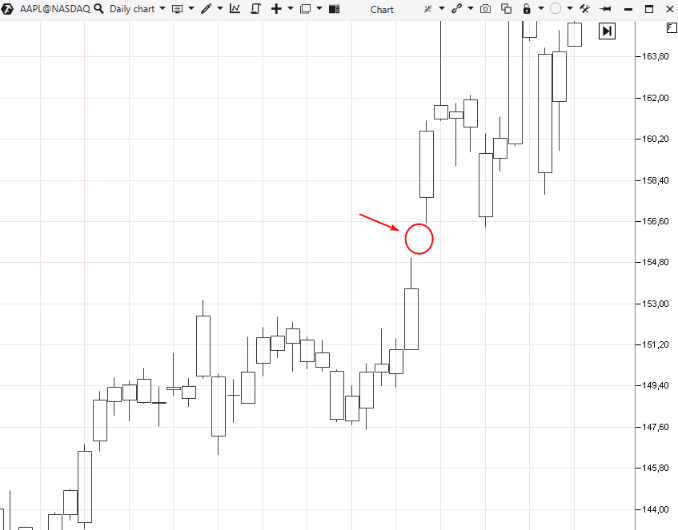
Candlestick Pattern Involving Gaps
Within the scope of this article on gaps, we will examine the Morning Star candlestick pattern.
For example, let's consider the weekly chart of Tesla stock.
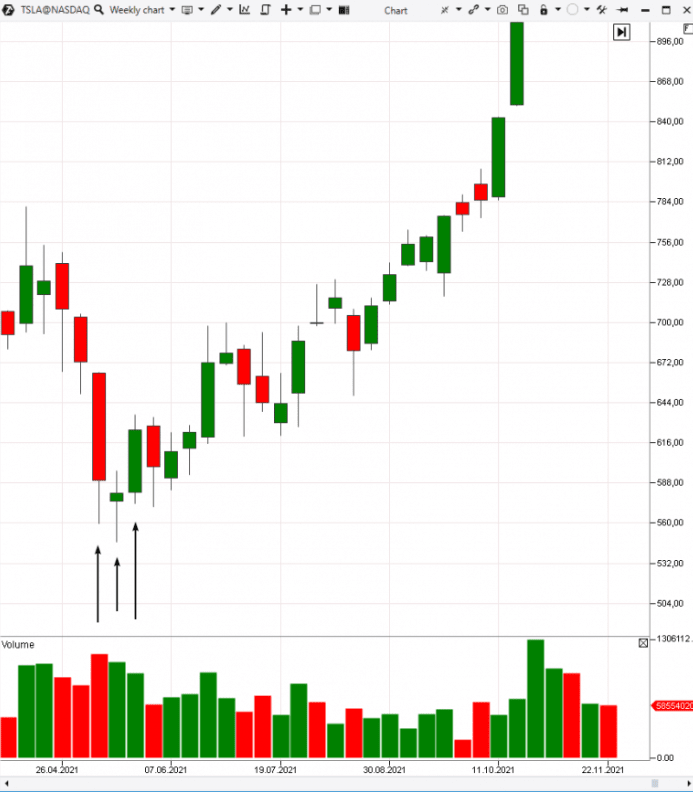
This is a bullish reversal pattern consisting of three candles. According to the rules of this pattern, the following sequence should be formed on the candlestick chart:
The first candle should display a significant price decline.
The second candle should open lower with a gap, and the rate of descent should slow down.
The third candle should be a wide-bodied bullish candle, with its opening price located above the body of the second candle. Some sources do not require a gap between the bodies of the second and third candles.
Prior to the appearance of the Morning Star candlestick pattern, it is desirable to observe a period of a downtrend. However, the emergence of this pattern indicates a change in market sentiment. The bearish trend is "overridden" (e.g., by important bullish news), paving the way for higher prices.
According to research conducted by analysts at Candlescanner, who tracked the Morning Star pattern on daily charts of stocks included in the S&P 500 index from 01/07/1995 to 30/06/2015, a total of 1861 patterns were identified.
Within a 10-day period following the appearance of the Morning Star pattern, the stock price decreased in 20% of cases, slightly increased in 19% of cases, moderately increased in 14% of cases, and significantly rose in 47% of cases.
DRAWBACKS OF TRADING WITH GAPS
Certainly, gaps are not a Holy Grail that predicts market behavior with guaranteed accuracy.
The drawback of gaps lies in their varied interpretations:
Gaps occurring at the beginning of a trend.
Gaps occurring at the end of a trend.
СRandom gaps.
To correctly interpret a gap, one must consider the broader market context and understand the likely meaning behind its appearance. Developing judgment skills regarding gaps requires significant time and practice.
The second drawback involves emotional stress and increased risk. Typically, gaps signify accelerated trading and the need for quick decision-making, which can be challenging for novice traders.
Caution: When trading with gaps, it is essential to use candlesticks or bars. Other chart types (such as lines or Renko) may conceal the presence of gaps.
CONCLUSIONS
Gaps are occurrences where the opening price of a candle significantly differs from the closing price of the previous candle. Gaps most commonly form at the opening of the stock market. Therefore, trading with gaps is best suited for intraday traders who track trends in the stock market.
However, beware of falling into the illusion that gaps are simple and can quickly and easily enrich you. Analyzing cluster charts, maintaining discipline, and self-improvement are what will truly help you achieve your goals when engaging in trading on financial markets.