
206 Atlas
84.3k Publicações

206 Atlas
Denunciar
Bloquear Utilizador
Atlas Research | Cryptoholic | Sharing Market insight and analysis | NFA | DYOR

Detentor de BNB
Trader Frequente
5.1 ano(s)
8.0K+ A seguir
15.0K+ Seguidores
26.3K+ Gostaram
Publicações
Tudo
Cotações
·
--
Em Baixa
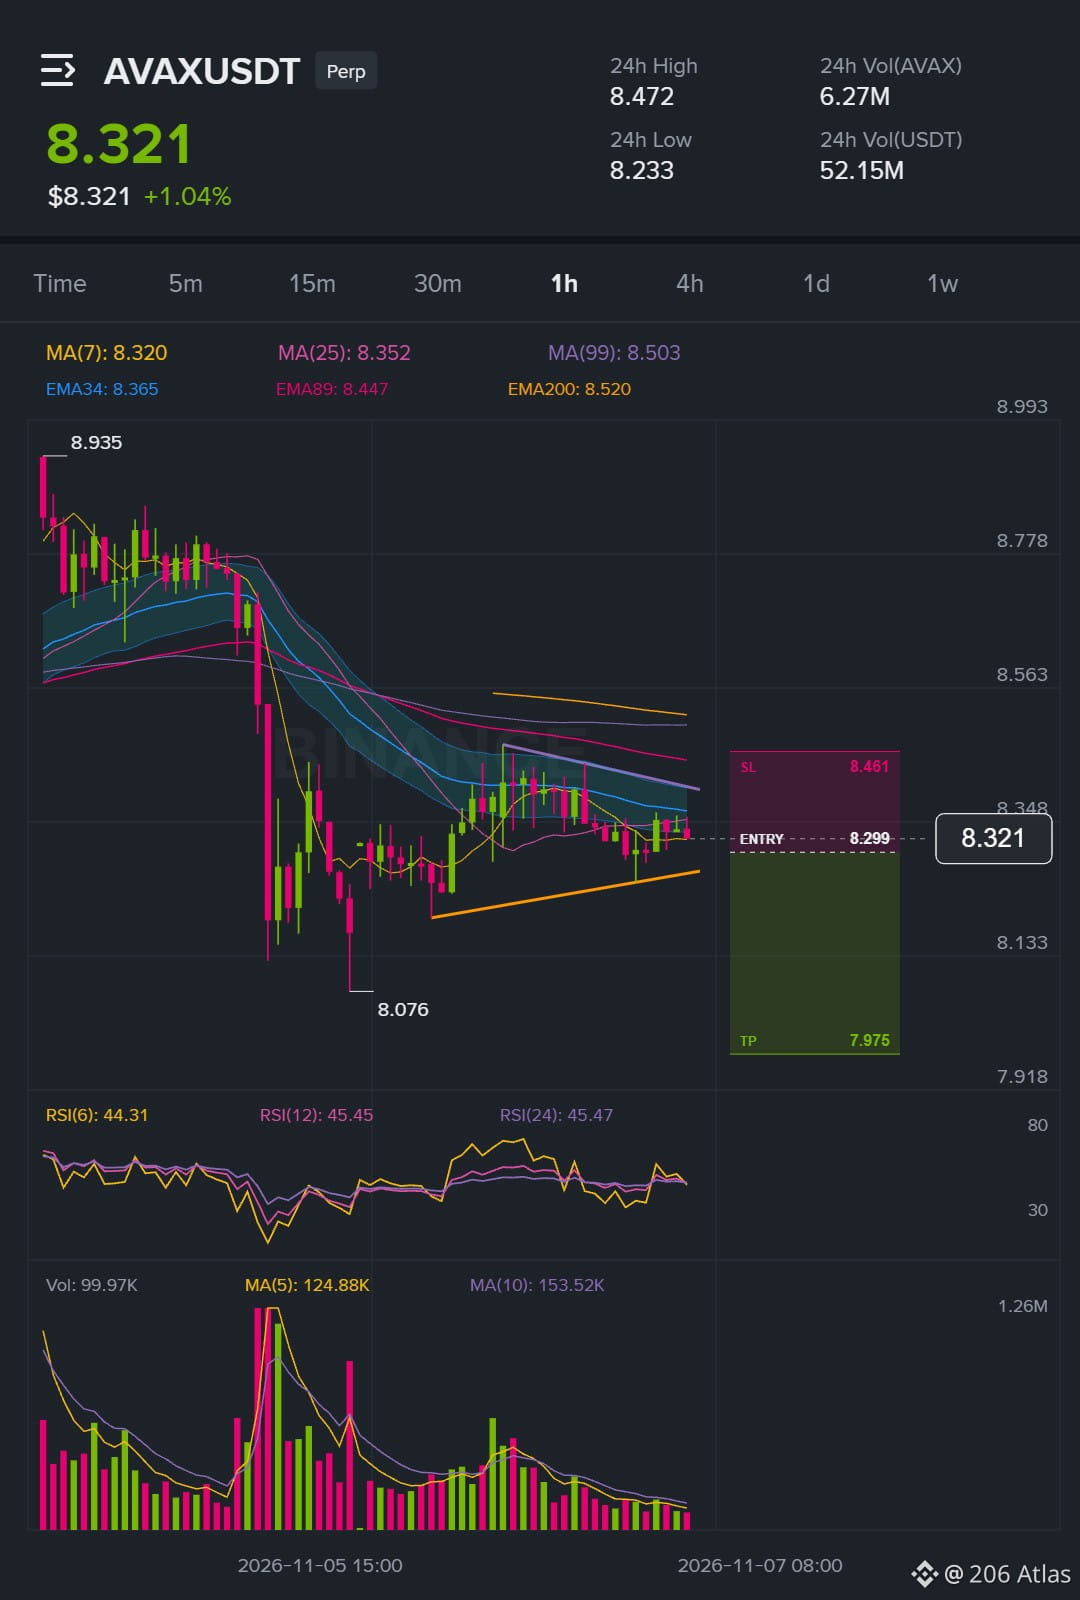
AVAX parece estar apenas ensaiando uma recuperação, mas a estrutura indica o contrário.
AVAX está na zona de entrada neste momento e o BTC está subindo no gráfico de 15 min, mas a configuração segue a tendência do próprio AVAX. O risco está em operar contra o momentum do BTC, então estou seguindo o caminho de menor resistência, para baixo, de acordo com a estrutura do AVAX.
$AVAX /USDT - 🔴 VENDA
Plano da operação:
Entrada: 8.2937 – 8.3043
SL: 8.4608
Zona de TP: 8.1777 - 7.9754
O AVAX já está na zona, então o plano está valendo.
Os níveis estão marcados no gráfico 👇
{future}(AVAXUSDT)
Análise pessoal de mercado. Isto não é aconselhamento financeiro — gerencie os riscos e faça sua própria pesquisa.
AVAX parece estar apenas ensaiando uma recuperação, mas a estrutura indica o contrário.
AVAX está na zona de entrada neste momento e o BTC está subindo no gráfico de 15 min, mas a configuração segue a tendência do próprio AVAX. O risco está em operar contra o momentum do BTC, então estou seguindo o caminho de menor resistência, para baixo, de acordo com a estrutura do AVAX.
$AVAX /USDT - 🔴 VENDA
Plano da operação:
Entrada: 8.2937 – 8.3043
SL: 8.4608
Zona de TP: 8.1777 - 7.9754
O AVAX já está na zona, então o plano está valendo.
Os níveis estão marcados no gráfico 👇
Análise pessoal de mercado. Isto não é aconselhamento financeiro — gerencie os riscos e faça sua própria pesquisa.
AVAX está na zona de entrada neste momento e o BTC está subindo no gráfico de 15 min, mas a configuração segue a tendência do próprio AVAX. O risco está em operar contra o momentum do BTC, então estou seguindo o caminho de menor resistência, para baixo, de acordo com a estrutura do AVAX.
$AVAX /USDT - 🔴 VENDA
Plano da operação:
Entrada: 8.2937 – 8.3043
SL: 8.4608
Zona de TP: 8.1777 - 7.9754
O AVAX já está na zona, então o plano está valendo.
Os níveis estão marcados no gráfico 👇
Análise pessoal de mercado. Isto não é aconselhamento financeiro — gerencie os riscos e faça sua própria pesquisa.
54
·
--
Em Alta
Ver tradução
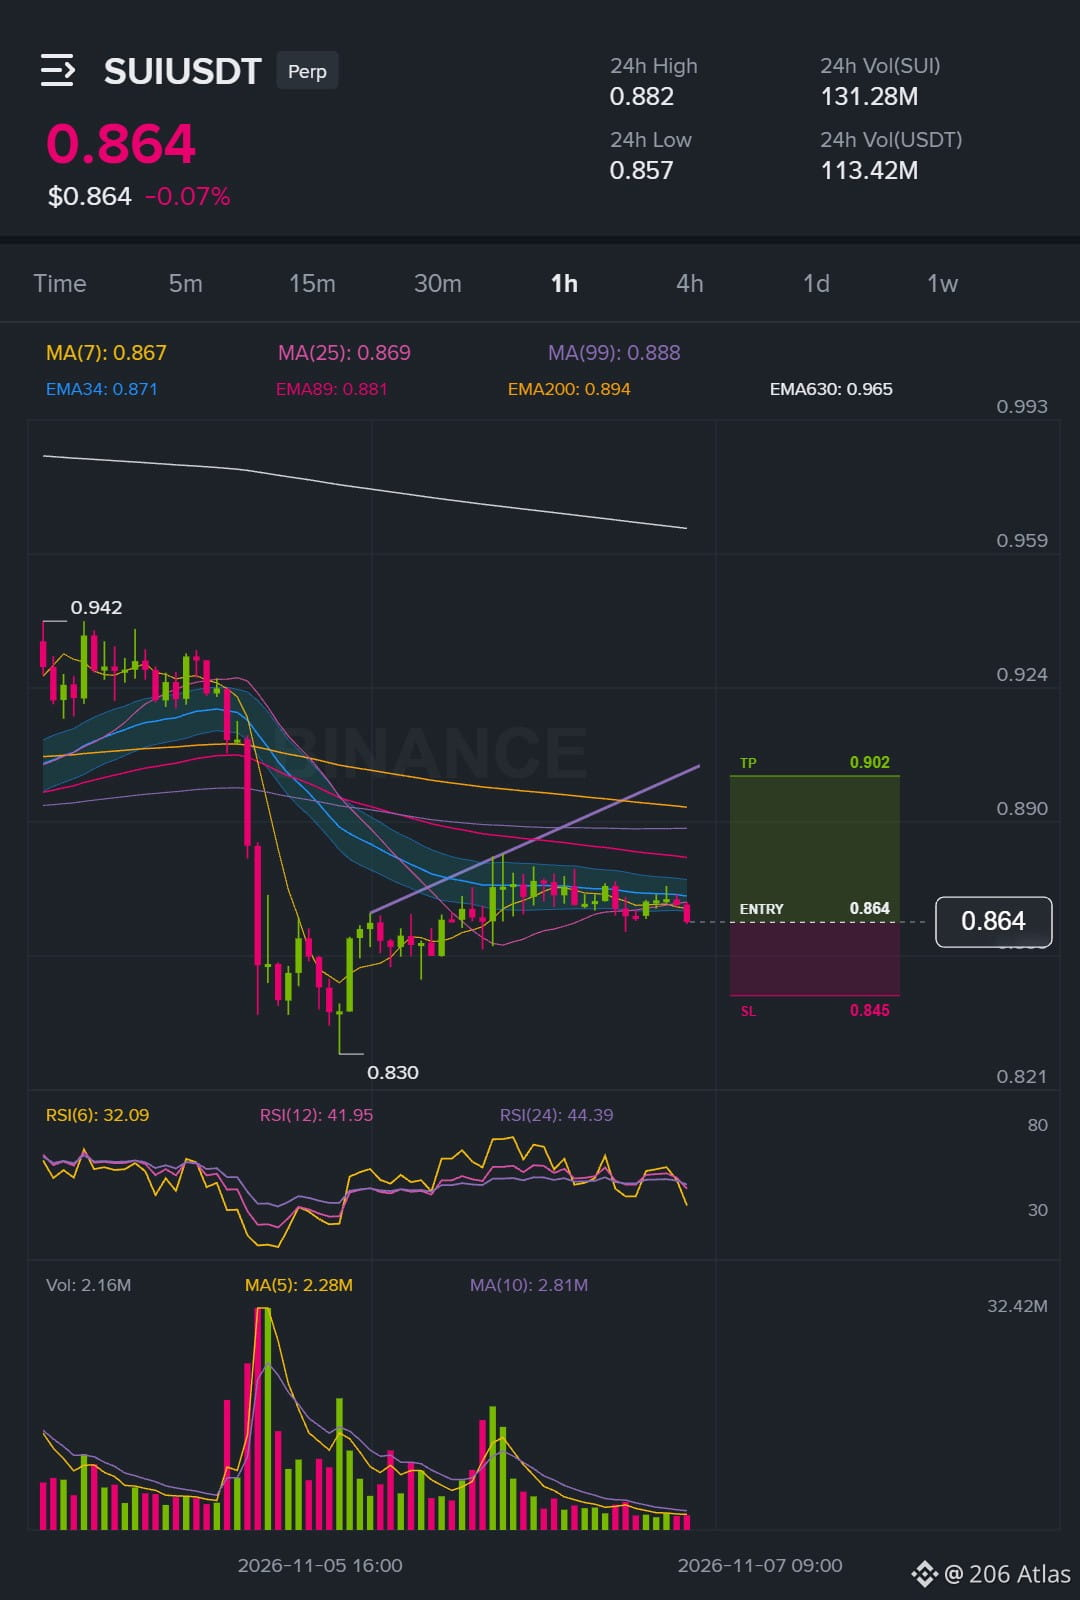
SUI is inside the entry zone and I am not chasing.
The plan is to let price come to 0.863303 - 0.864497 on its own. The idea is wrong if 1h holds below 0.908064, so the stop is 0.845038. I switched from the opposite side a few hours back, and the setup is with the trend.
$SUI /USDT - 🟢 LONG
Trade Plan:
Entry: 0.863303 – 0.864497
SL: 0.845038
TP Area: 0.878047 - 0.901624
Here's how it looks on the chart 👇
{future}(SUIUSDT)
Personal market analysis only. Not financial advice — manage risk and do your own research.
$AVAX plan drops in the next post.
SUI is inside the entry zone and I am not chasing.
The plan is to let price come to 0.863303 - 0.864497 on its own. The idea is wrong if 1h holds below 0.908064, so the stop is 0.845038. I switched from the opposite side a few hours back, and the setup is with the trend.
$SUI /USDT - 🟢 LONG
Trade Plan:
Entry: 0.863303 – 0.864497
SL: 0.845038
TP Area: 0.878047 - 0.901624
Here's how it looks on the chart 👇
Personal market analysis only. Not financial advice — manage risk and do your own research.
$AVAX plan drops in the next post.
The plan is to let price come to 0.863303 - 0.864497 on its own. The idea is wrong if 1h holds below 0.908064, so the stop is 0.845038. I switched from the opposite side a few hours back, and the setup is with the trend.
$SUI /USDT - 🟢 LONG
Trade Plan:
Entry: 0.863303 – 0.864497
SL: 0.845038
TP Area: 0.878047 - 0.901624
Here's how it looks on the chart 👇
Personal market analysis only. Not financial advice — manage risk and do your own research.
$AVAX plan drops in the next post.
78
·
--
Em Alta
Ver tradução
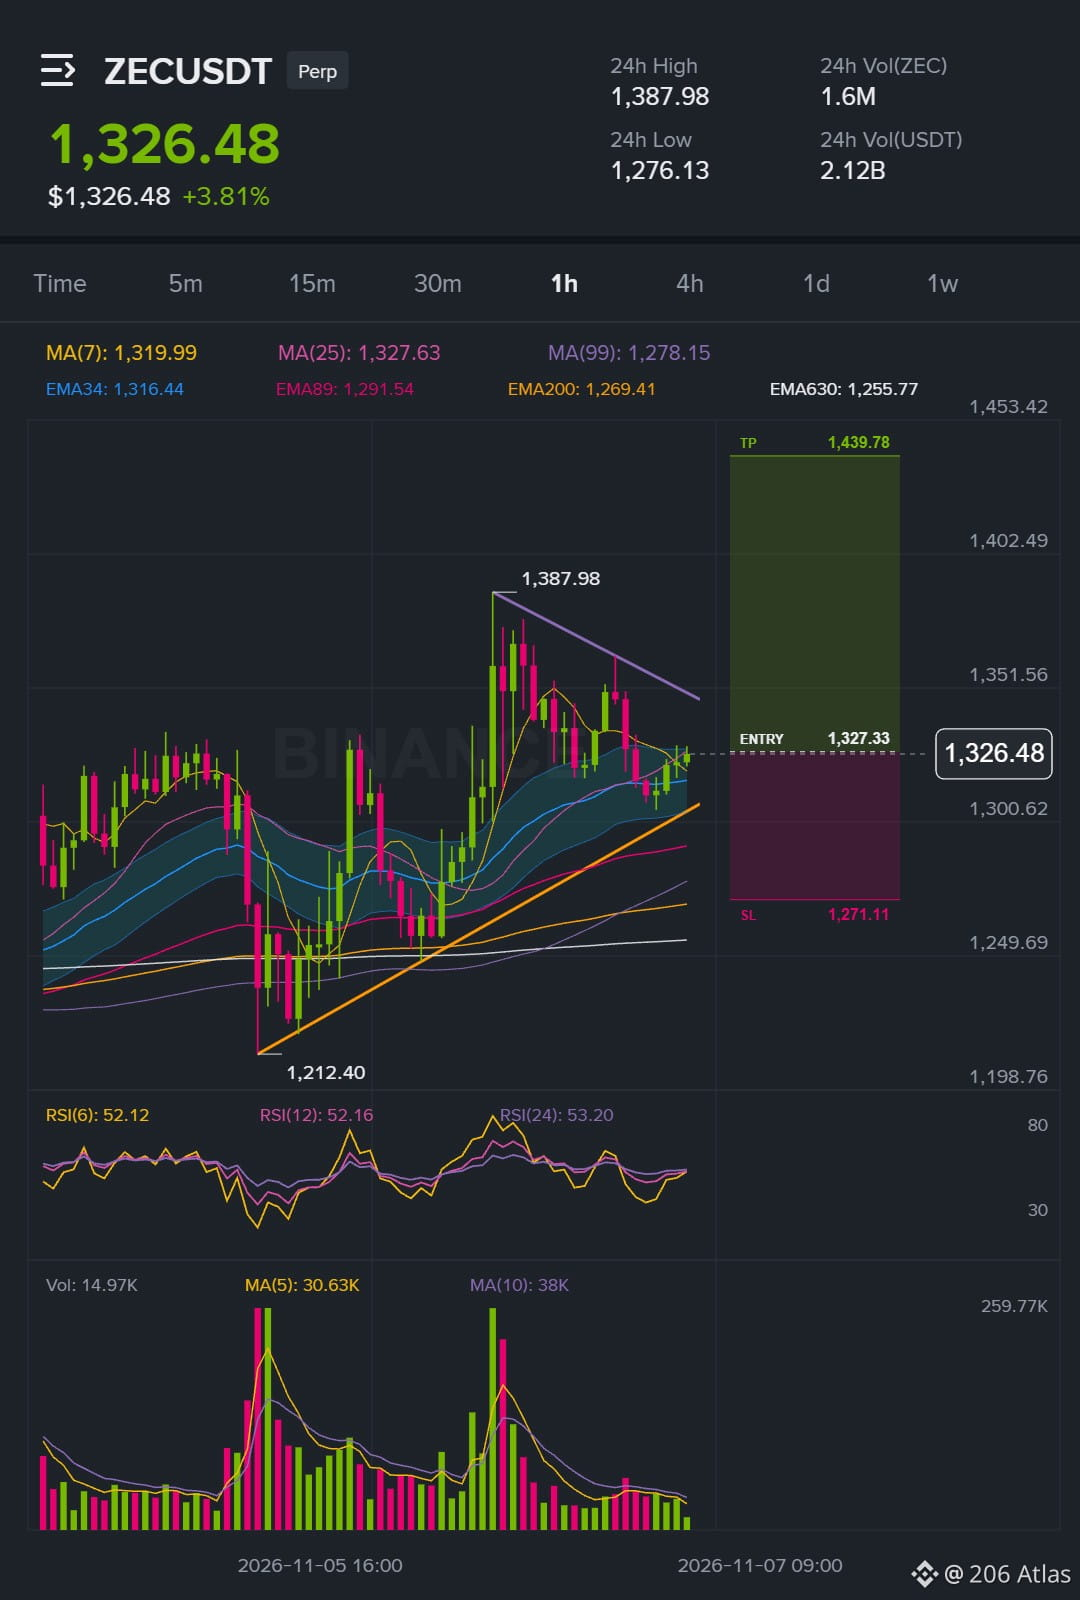
ZEC still inside the entry zone, so what is the pullback telling you 📈
$ZEC /USDT - 🟢 LONG
Trade Plan:
Entry: 1325.41 – 1329.25
SL: 1271.11
TP Area: 1369.50 - 1439.78
ZEC is moving with the trend and the pullback is giving a clean entry zone. The setup holds as long as 1230.75 flips on the 1h, and I already posted on ZEC a few hours ago in the same direction.
Here's how it looks on the chart 👇
{future}(ZECUSDT)
Personal market analysis only. Not financial advice — manage risk and do your own research.
$SUI — waiting for my level.
ZEC still inside the entry zone, so what is the pullback telling you 📈
$ZEC /USDT - 🟢 LONG
Trade Plan:
Entry: 1325.41 – 1329.25
SL: 1271.11
TP Area: 1369.50 - 1439.78
ZEC is moving with the trend and the pullback is giving a clean entry zone. The setup holds as long as 1230.75 flips on the 1h, and I already posted on ZEC a few hours ago in the same direction.
Here's how it looks on the chart 👇
Personal market analysis only. Not financial advice — manage risk and do your own research.
$SUI — waiting for my level.
$ZEC /USDT - 🟢 LONG
Trade Plan:
Entry: 1325.41 – 1329.25
SL: 1271.11
TP Area: 1369.50 - 1439.78
ZEC is moving with the trend and the pullback is giving a clean entry zone. The setup holds as long as 1230.75 flips on the 1h, and I already posted on ZEC a few hours ago in the same direction.
Here's how it looks on the chart 👇
Personal market analysis only. Not financial advice — manage risk and do your own research.
$SUI — waiting for my level.
43
·
--
Em Alta
Ver tradução
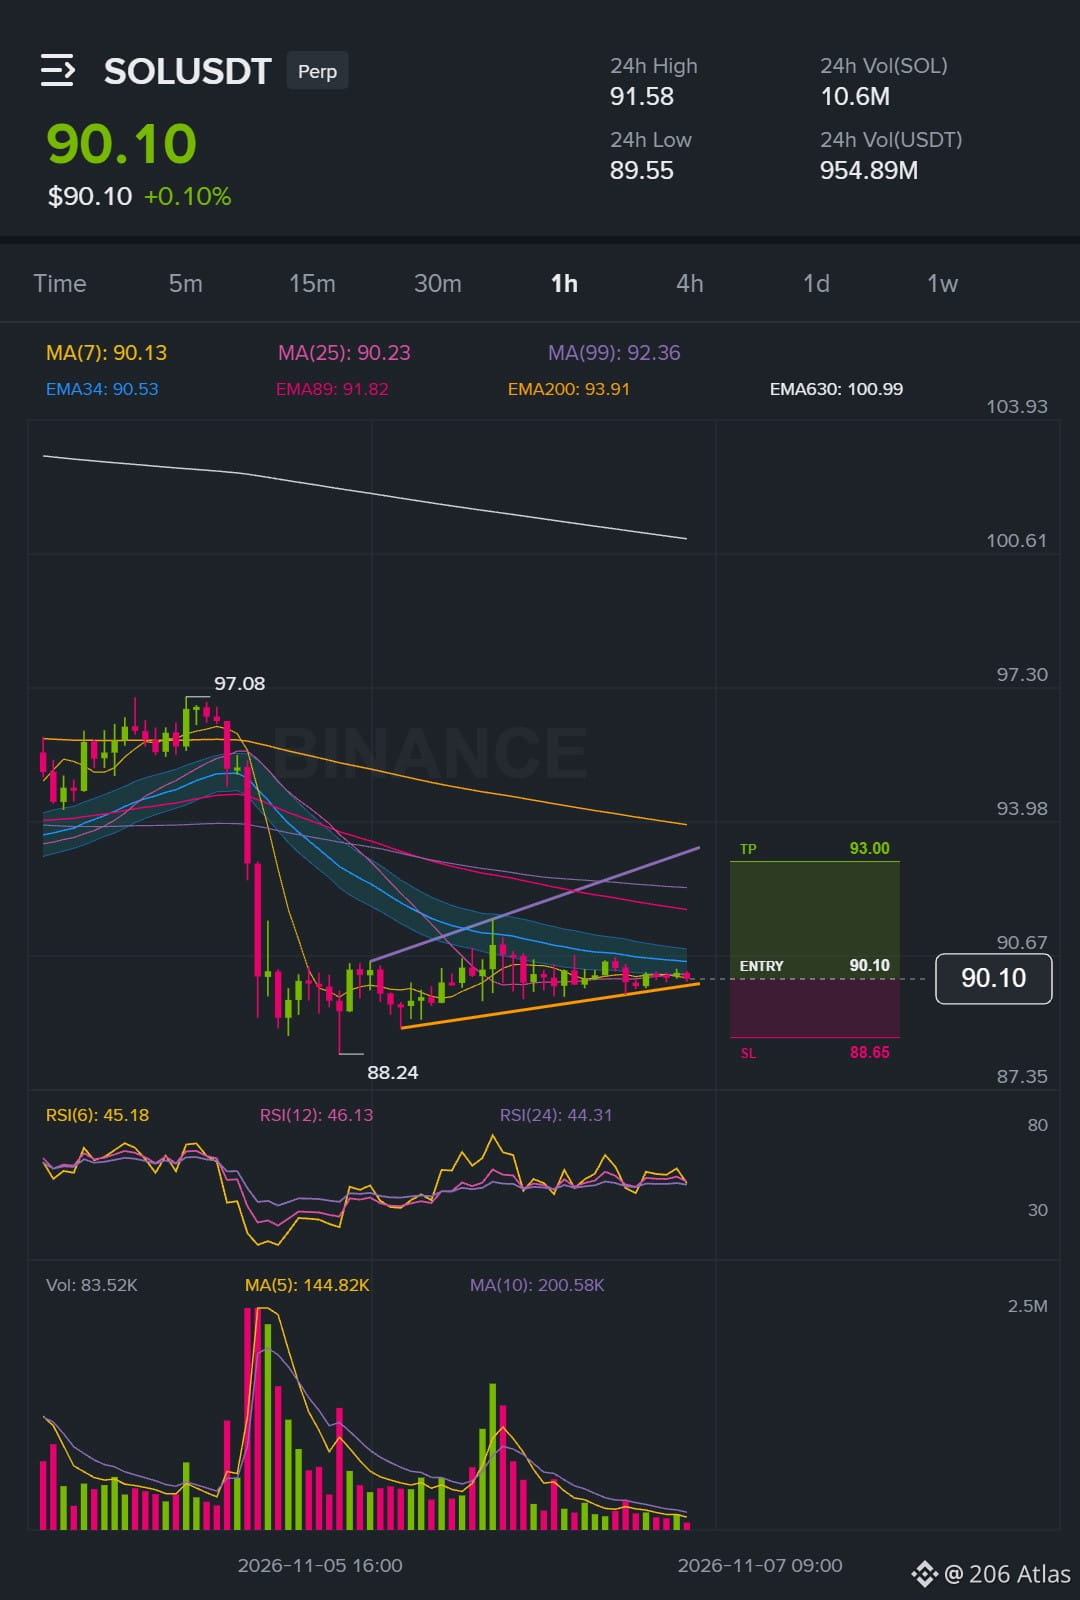
$SOL /USDT - 🟢 LONG · Conf 78%
Trade Plan:
Entry: 90.0579 – 90.1421
SL: 88.6480
TP Area: 91.1890 - 93.0040
Note: Probable direction is LONG in a trend regime; this is not a guarantee, so be careful and respect the stop loss.
Click here to view the chart 👇️
{future}(SOLUSDT)
Personal market analysis only. Not financial advice — manage risk and do your own research.
$SOL /USDT - 🟢 LONG · Conf 78%
Trade Plan:
Entry: 90.0579 – 90.1421
SL: 88.6480
TP Area: 91.1890 - 93.0040
Note: Probable direction is LONG in a trend regime; this is not a guarantee, so be careful and respect the stop loss.
Click here to view the chart 👇️
Personal market analysis only. Not financial advice — manage risk and do your own research.
Trade Plan:
Entry: 90.0579 – 90.1421
SL: 88.6480
TP Area: 91.1890 - 93.0040
Note: Probable direction is LONG in a trend regime; this is not a guarantee, so be careful and respect the stop loss.
Click here to view the chart 👇️
Personal market analysis only. Not financial advice — manage risk and do your own research.
37
·
--
Em Alta
Ver tradução
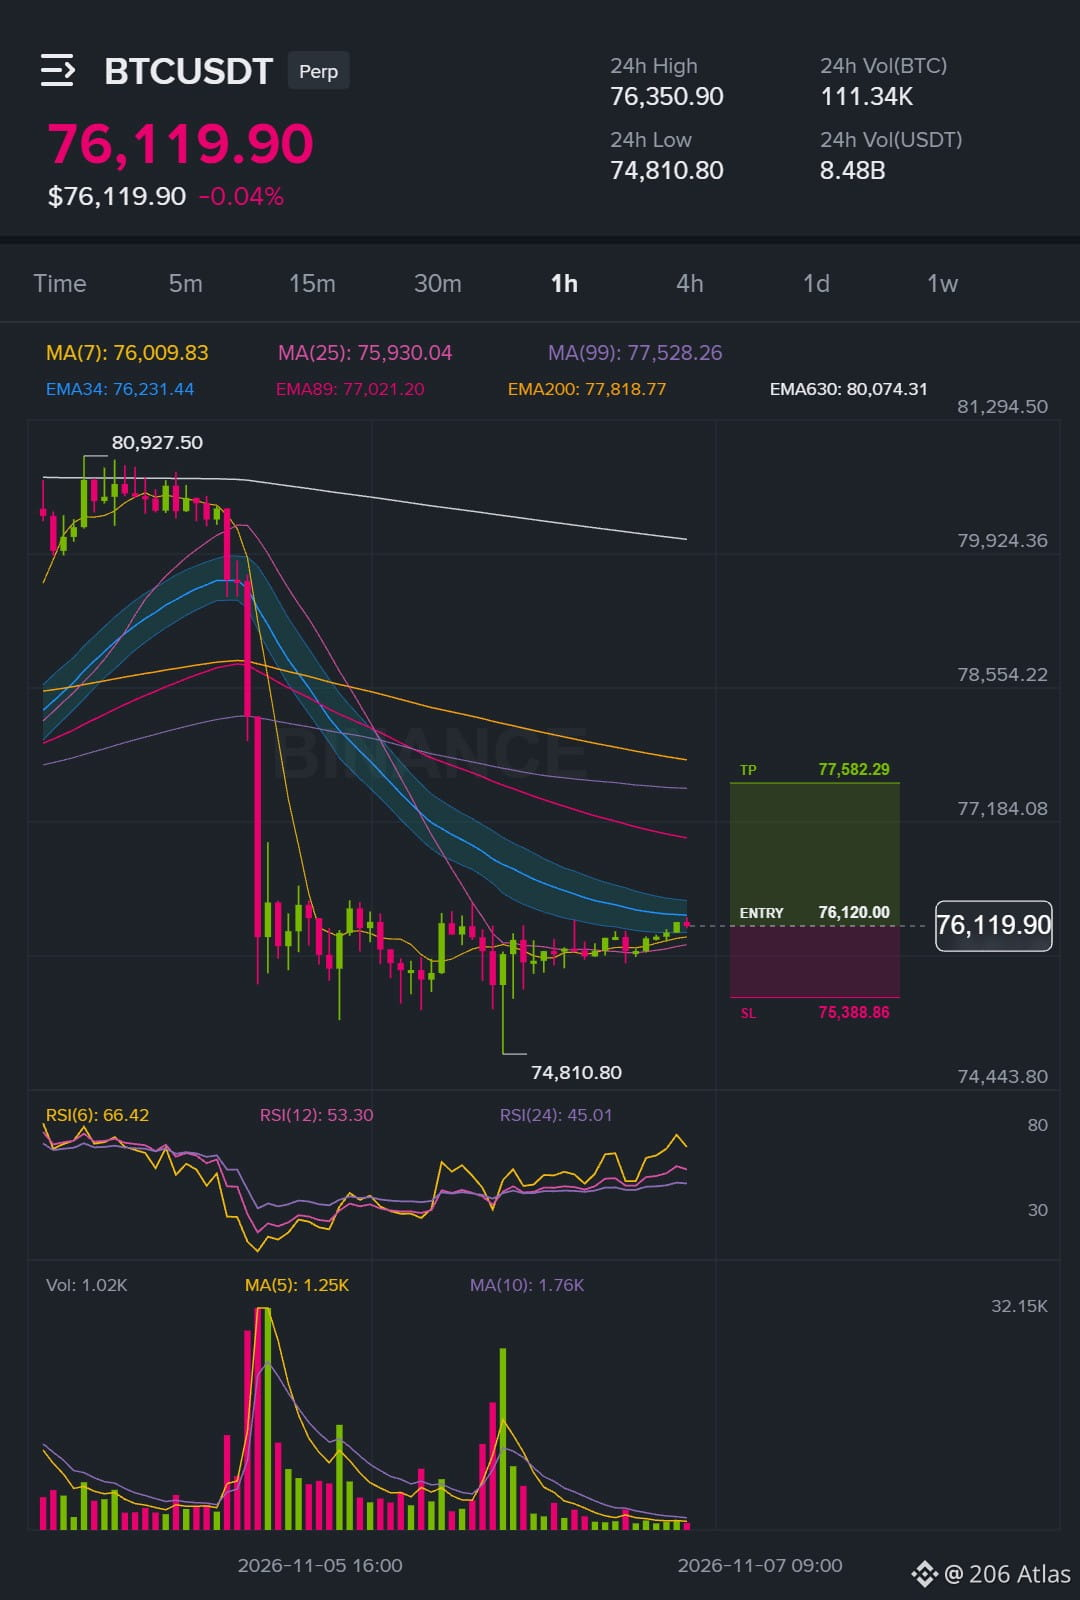
I am going long on BTC here.
$BTC /USDT - 🟢 LONG
Trade Plan:
Entry: 76103.69 – 76136.31
SL: 75388.86
TP Area: 76668.36 - 77582.29
Why go long after the recent move against you. The volatility is compressed, so a bigger move can follow. Momentum is stretched but still with the trend. I changed my mind on the prior call, so this is the new read with the same setup type. 📈
Click here to view the chart 👇️
{future}(BTCUSDT)
Personal market analysis only. Not financial advice — manage risk and do your own research.
I am going long on BTC here.
$BTC /USDT - 🟢 LONG
Trade Plan:
Entry: 76103.69 – 76136.31
SL: 75388.86
TP Area: 76668.36 - 77582.29
Why go long after the recent move against you. The volatility is compressed, so a bigger move can follow. Momentum is stretched but still with the trend. I changed my mind on the prior call, so this is the new read with the same setup type. 📈
Click here to view the chart 👇️
Personal market analysis only. Not financial advice — manage risk and do your own research.
$BTC /USDT - 🟢 LONG
Trade Plan:
Entry: 76103.69 – 76136.31
SL: 75388.86
TP Area: 76668.36 - 77582.29
Why go long after the recent move against you. The volatility is compressed, so a bigger move can follow. Momentum is stretched but still with the trend. I changed my mind on the prior call, so this is the new read with the same setup type. 📈
Click here to view the chart 👇️
Personal market analysis only. Not financial advice — manage risk and do your own research.
77
·
--
Em Alta
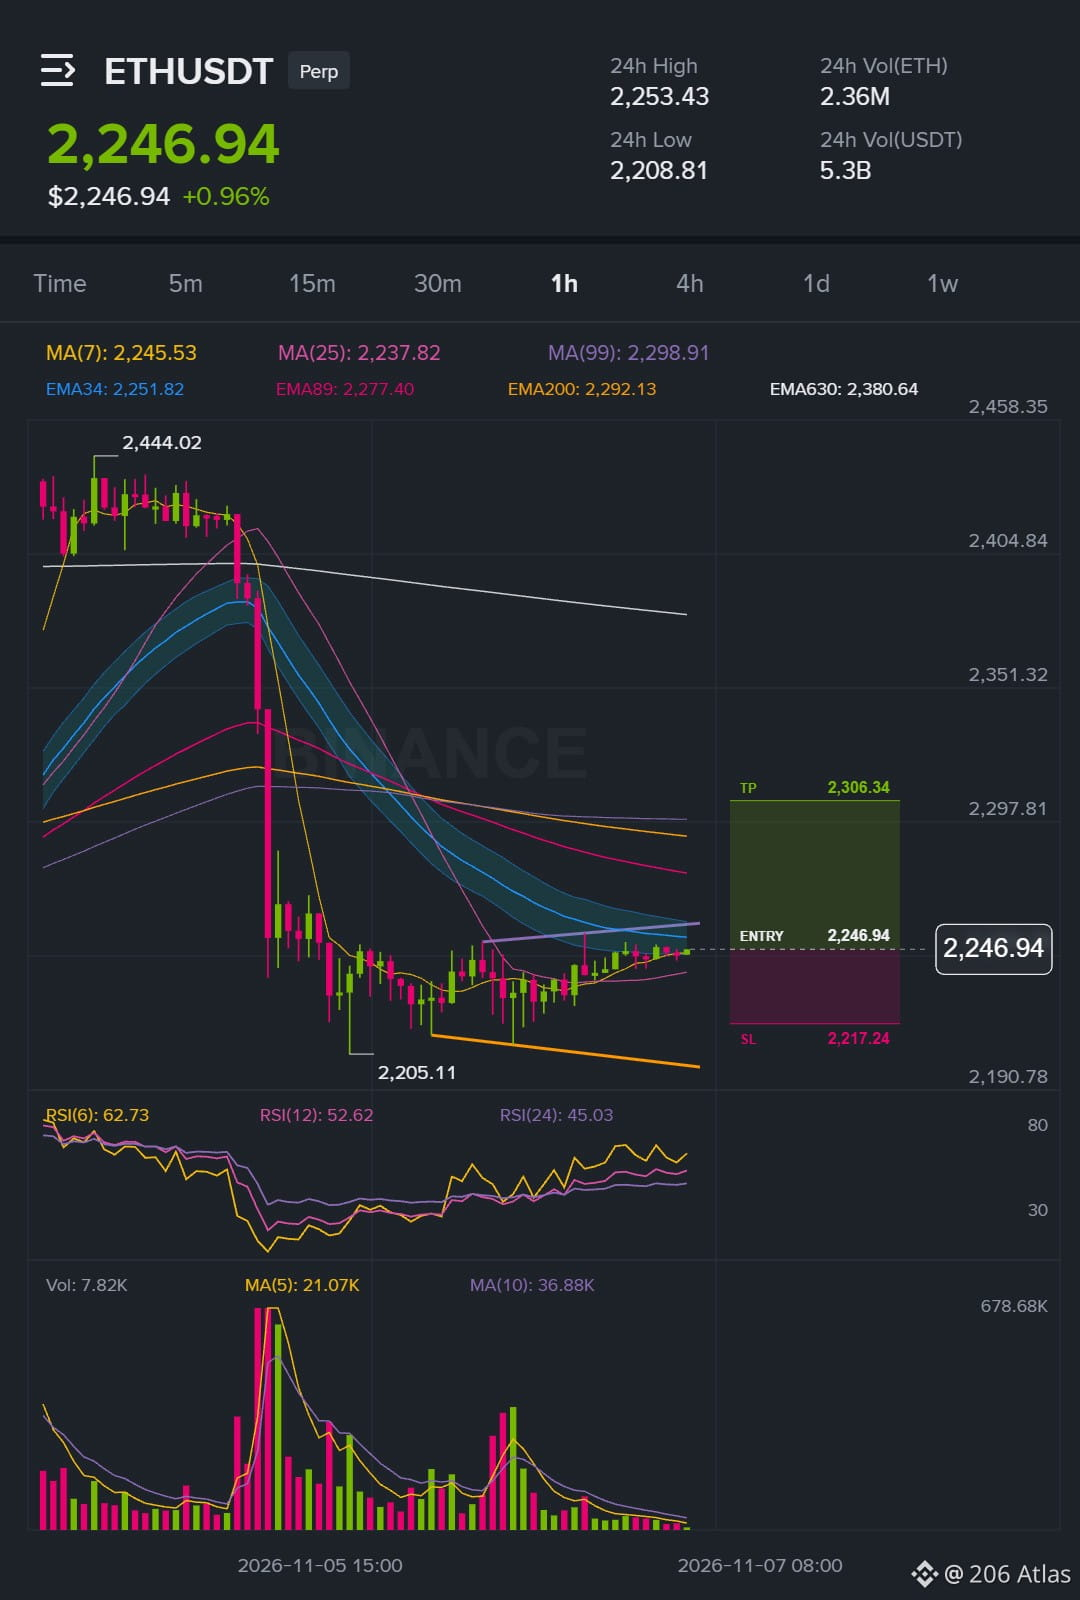
Mudei de direção no ETH depois que a última chamada perdeu força.
$ETH /USDT - 🟢 LONG
Plano de trade:
Entrada: 2246.18 – 2247.70
SL: 2217.24
Área de TP: 2269.21 - 2306.34
A tendência de 15 min está fraca e instável, então estou acompanhando os níveis em vez do momentum. O ETH já está dentro da zona, o que torna esta uma configuração de baixo risco de entrar tarde, a favor da tendência.
Você esperaria o reteste de 2247.70 ou entraria agora?
Veja como fica no gráfico 👇
{future}(ETHUSDT)
Apenas análise pessoal do mercado. Não é aconselhamento financeiro — gerencie o risco e faça sua própria pesquisa.
Mudei de direção no ETH depois que a última chamada perdeu força.
$ETH /USDT - 🟢 LONG
Plano de trade:
Entrada: 2246.18 – 2247.70
SL: 2217.24
Área de TP: 2269.21 - 2306.34
A tendência de 15 min está fraca e instável, então estou acompanhando os níveis em vez do momentum. O ETH já está dentro da zona, o que torna esta uma configuração de baixo risco de entrar tarde, a favor da tendência.
Você esperaria o reteste de 2247.70 ou entraria agora?
Veja como fica no gráfico 👇
Apenas análise pessoal do mercado. Não é aconselhamento financeiro — gerencie o risco e faça sua própria pesquisa.
$ETH /USDT - 🟢 LONG
Plano de trade:
Entrada: 2246.18 – 2247.70
SL: 2217.24
Área de TP: 2269.21 - 2306.34
A tendência de 15 min está fraca e instável, então estou acompanhando os níveis em vez do momentum. O ETH já está dentro da zona, o que torna esta uma configuração de baixo risco de entrar tarde, a favor da tendência.
Você esperaria o reteste de 2247.70 ou entraria agora?
Veja como fica no gráfico 👇
Apenas análise pessoal do mercado. Não é aconselhamento financeiro — gerencie o risco e faça sua própria pesquisa.
59
·
--
Em Alta
Ver tradução
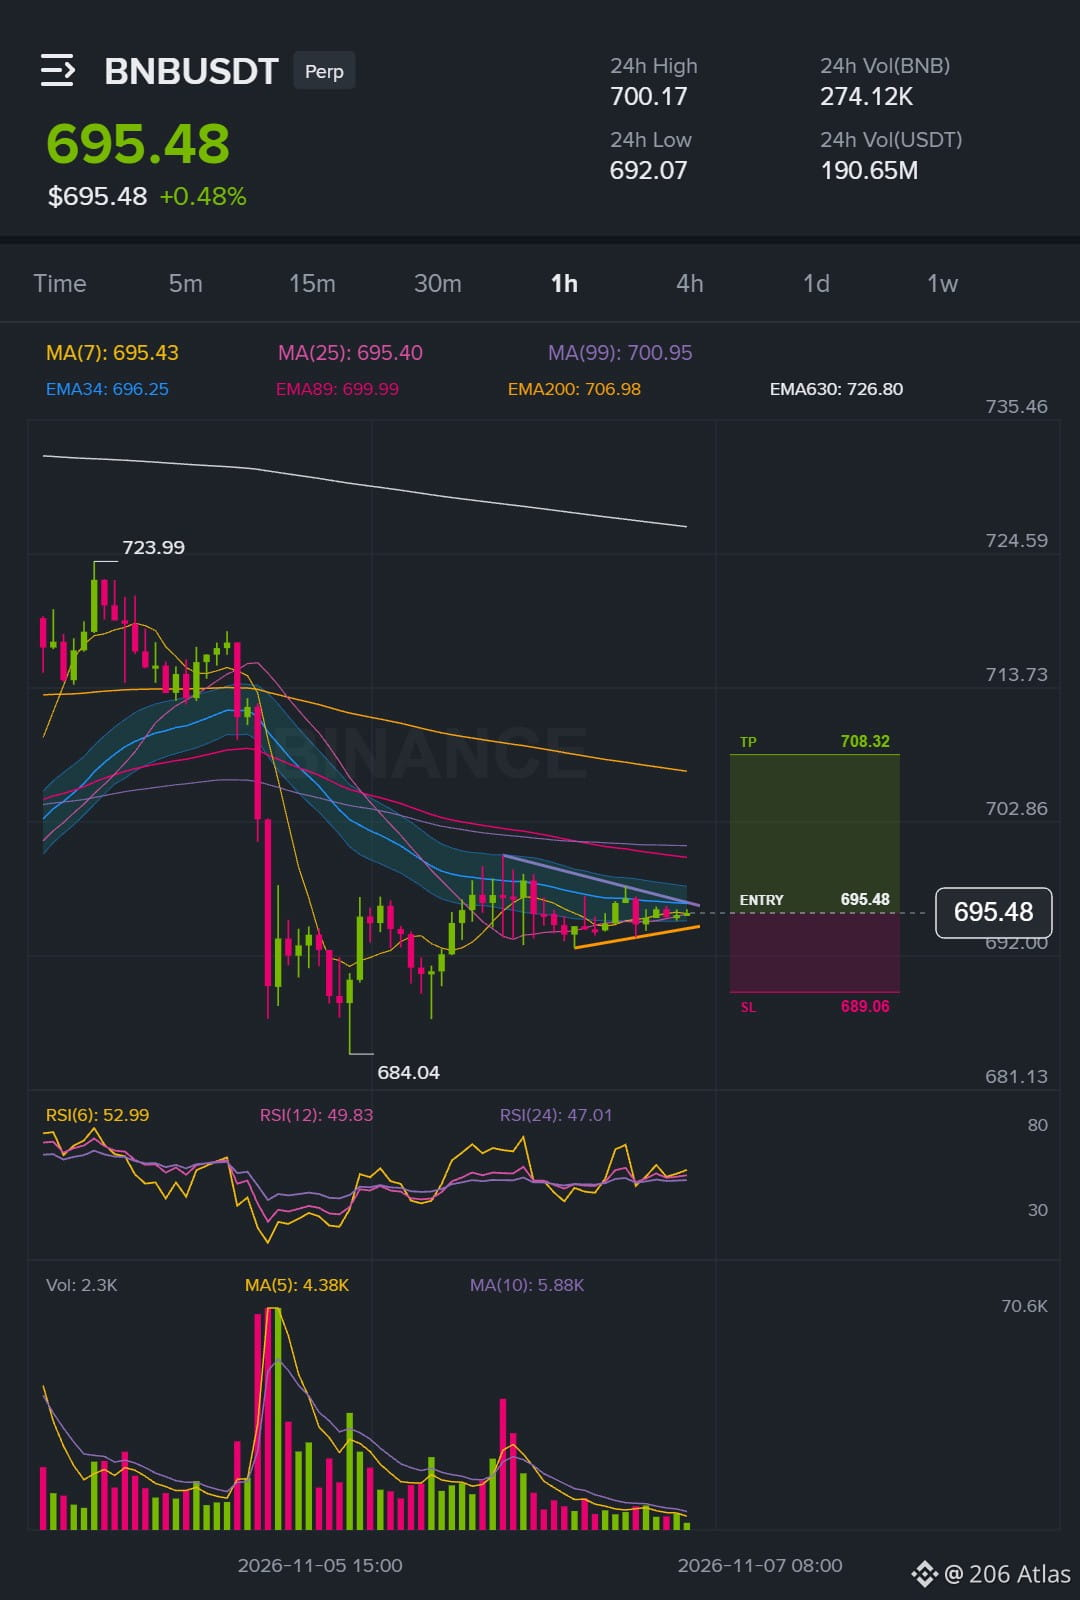
BNB shifted under me a few hours back, so this is the new read.
BNB has been drifting into the 695.312 - 695.648 zone, which I would rather wait for than chase. If it holds above 702.781 on the 1h the with-the-trend idea stays valid, and I am comfortable letting the stop at 689.060 define the risk. I changed my mind once already today and I am not forcing it again, just taking the setup as it sits.
$BNB /USDT - 🟢 LONG
Trade Plan:
Entry: 695.312 – 695.648
SL: 689.060
TP Area: 700.295 - 708.321
Patience over impulse, always.
Chart with my levels 👇
{future}(BNBUSDT)
Personal market analysis only. Not financial advice — manage risk and do your own research.
BNB shifted under me a few hours back, so this is the new read.
BNB has been drifting into the 695.312 - 695.648 zone, which I would rather wait for than chase. If it holds above 702.781 on the 1h the with-the-trend idea stays valid, and I am comfortable letting the stop at 689.060 define the risk. I changed my mind once already today and I am not forcing it again, just taking the setup as it sits.
$BNB /USDT - 🟢 LONG
Trade Plan:
Entry: 695.312 – 695.648
SL: 689.060
TP Area: 700.295 - 708.321
Patience over impulse, always.
Chart with my levels 👇
Personal market analysis only. Not financial advice — manage risk and do your own research.
BNB has been drifting into the 695.312 - 695.648 zone, which I would rather wait for than chase. If it holds above 702.781 on the 1h the with-the-trend idea stays valid, and I am comfortable letting the stop at 689.060 define the risk. I changed my mind once already today and I am not forcing it again, just taking the setup as it sits.
$BNB /USDT - 🟢 LONG
Trade Plan:
Entry: 695.312 – 695.648
SL: 689.060
TP Area: 700.295 - 708.321
Patience over impulse, always.
Chart with my levels 👇
Personal market analysis only. Not financial advice — manage risk and do your own research.
34
·
--
Em Alta
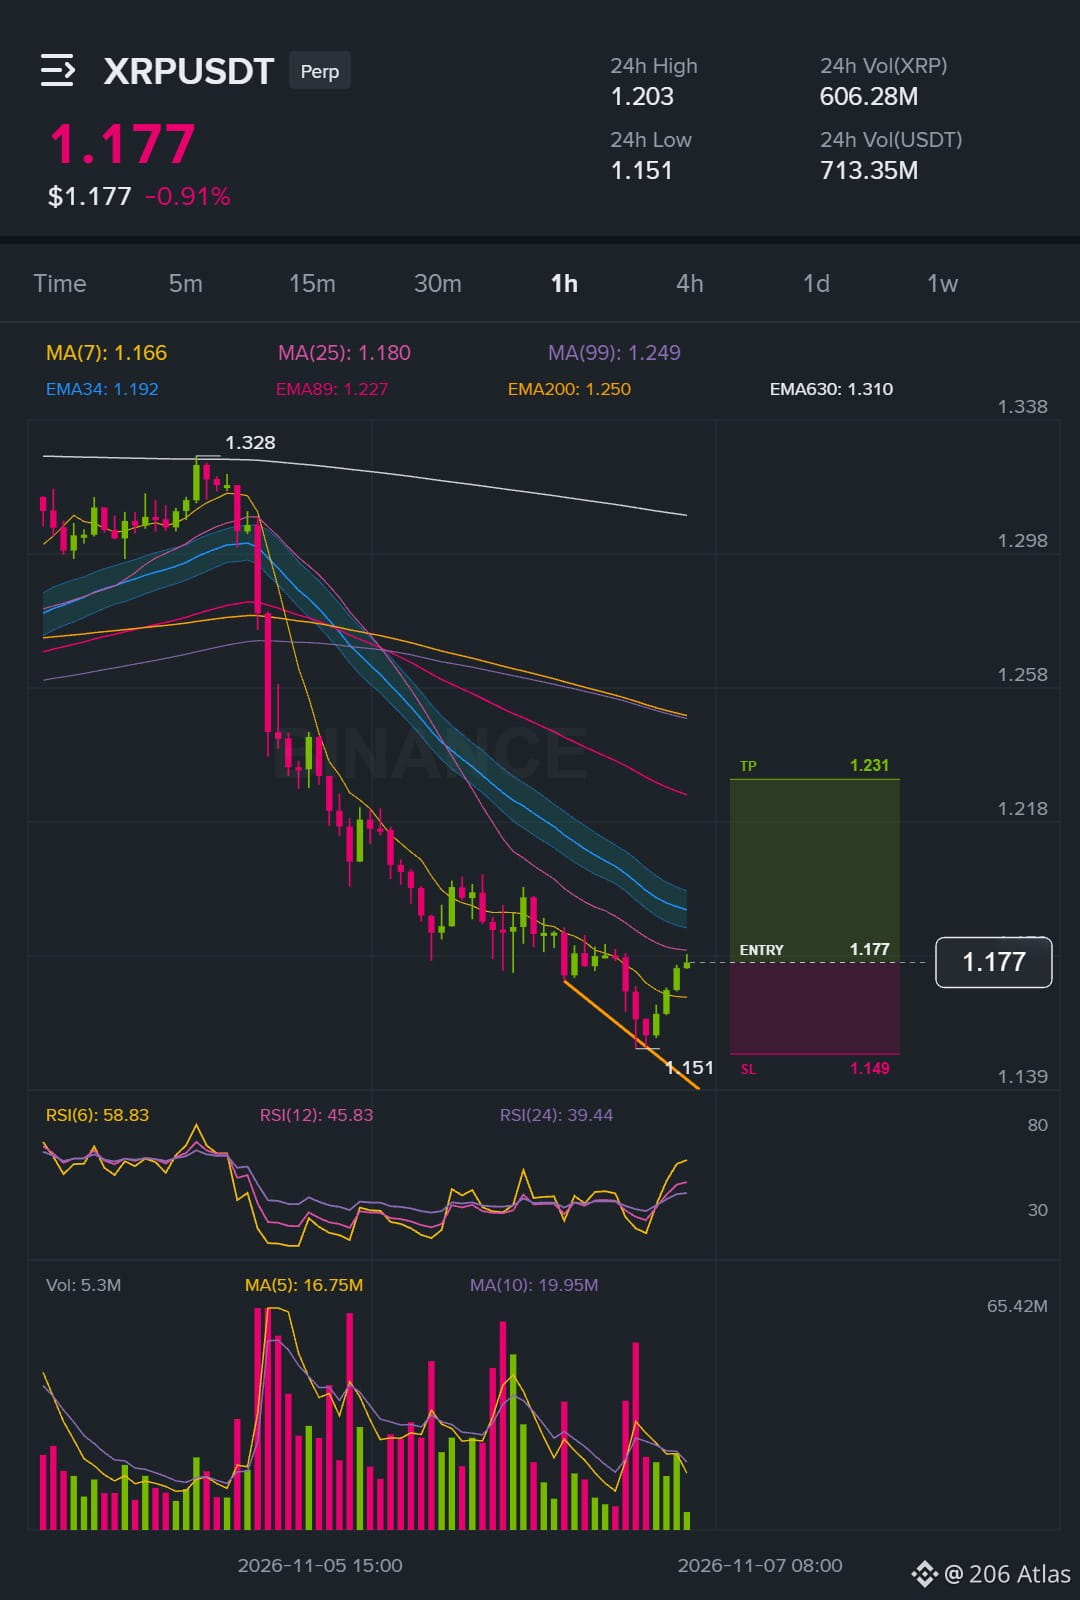
XRP dentro da zona de entrada 📈
$XRP /USDT - 🟢 COMPRA
Plano de negociação:
Entrada: 1.1755 – 1.1777
SL: 1.1493
Área de TP: 1.1971 - 1.2312
O XRP já está dentro da zona de entrada, então não vou persegui-lo. A tendência de 15 min está forte, com ADX em 28, e está alinhada com a recomendação. Primeiro, quero que o preço se mantenha acima do nível de invalidação. Depois, observo a estrutura de 1 h. Neste momento, a configuração está bem à minha frente e está clara o suficiente para agir.
Clique aqui para ver o gráfico 👇️
{future}(XRPUSDT)
Apenas análise pessoal do mercado. Não é aconselhamento financeiro — gerencie o risco e faça sua própria pesquisa.
XRP dentro da zona de entrada 📈
$XRP /USDT - 🟢 COMPRA
Plano de negociação:
Entrada: 1.1755 – 1.1777
SL: 1.1493
Área de TP: 1.1971 - 1.2312
O XRP já está dentro da zona de entrada, então não vou persegui-lo. A tendência de 15 min está forte, com ADX em 28, e está alinhada com a recomendação. Primeiro, quero que o preço se mantenha acima do nível de invalidação. Depois, observo a estrutura de 1 h. Neste momento, a configuração está bem à minha frente e está clara o suficiente para agir.
Clique aqui para ver o gráfico 👇️
Apenas análise pessoal do mercado. Não é aconselhamento financeiro — gerencie o risco e faça sua própria pesquisa.
$XRP /USDT - 🟢 COMPRA
Plano de negociação:
Entrada: 1.1755 – 1.1777
SL: 1.1493
Área de TP: 1.1971 - 1.2312
O XRP já está dentro da zona de entrada, então não vou persegui-lo. A tendência de 15 min está forte, com ADX em 28, e está alinhada com a recomendação. Primeiro, quero que o preço se mantenha acima do nível de invalidação. Depois, observo a estrutura de 1 h. Neste momento, a configuração está bem à minha frente e está clara o suficiente para agir.
Clique aqui para ver o gráfico 👇️
Apenas análise pessoal do mercado. Não é aconselhamento financeiro — gerencie o risco e faça sua própria pesquisa.
79
·
--
Em Alta
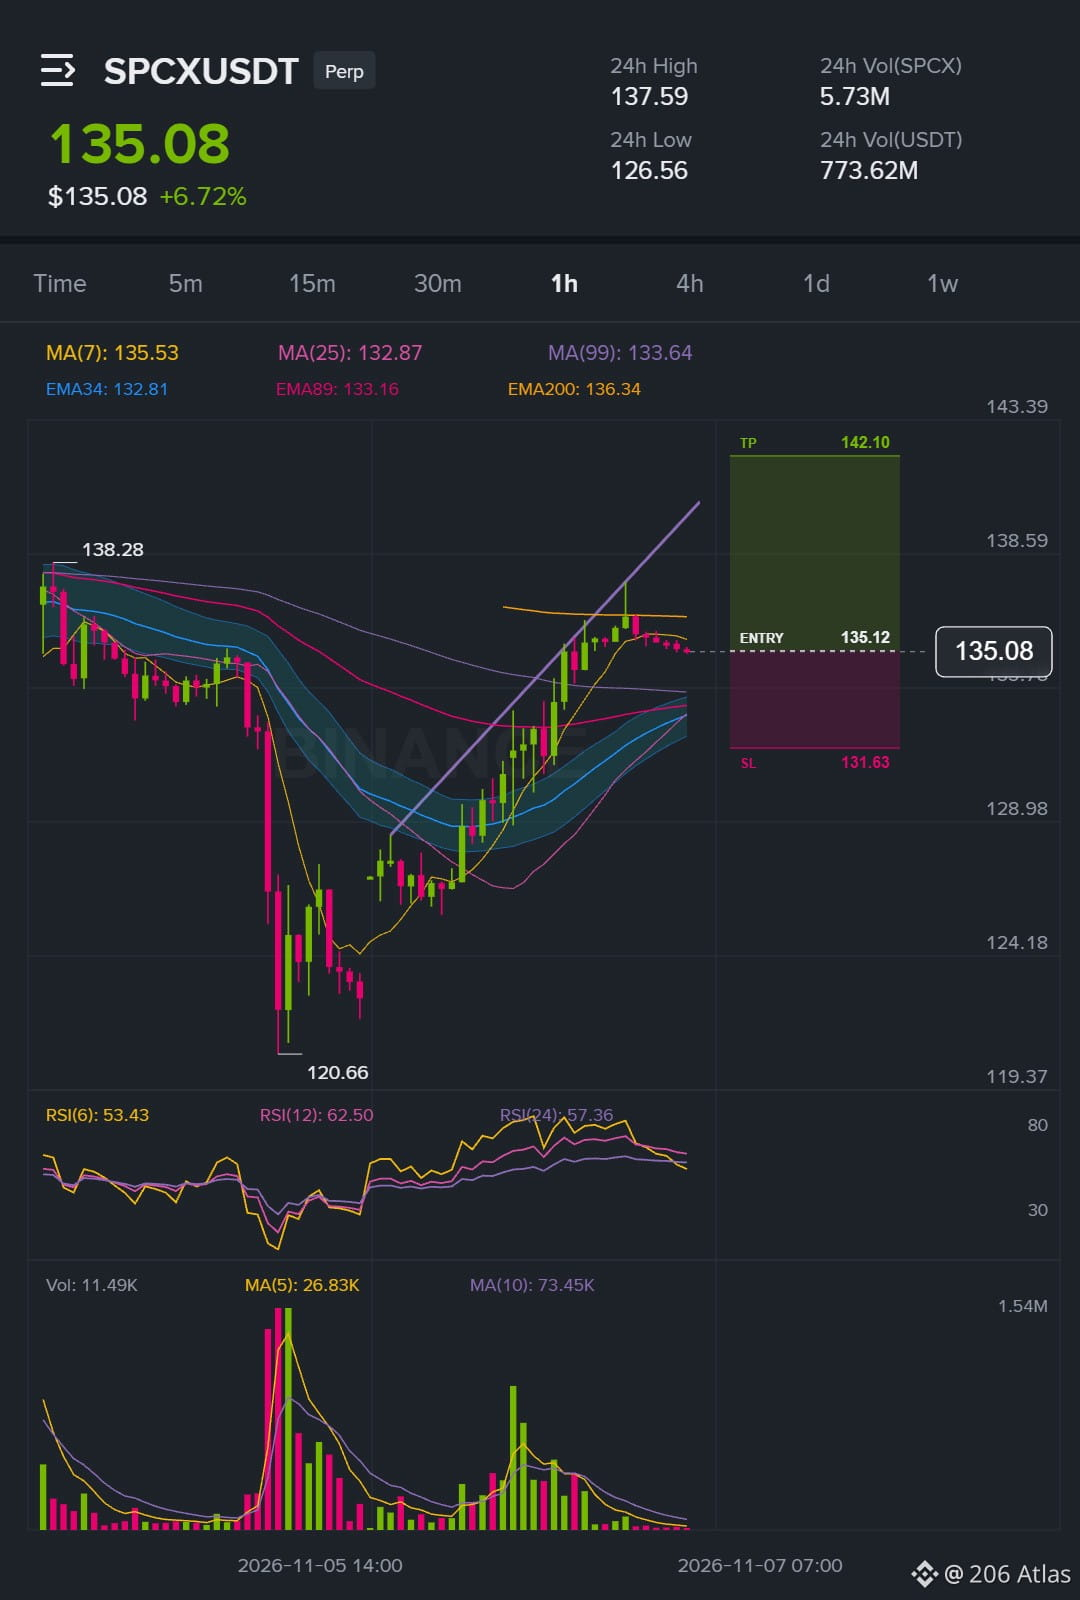
A SPCX já está se movimentando por conta própria, então este recuo contra a tendência é uma oportunidade de maior risco que estou assumindo.
$SPCX /USDT - 🟢 COMPRA
Plano de trade:
Entrada: 135.05520 – 135.18480
SL: 131.62825
Área de TP: 137.73881 - 142.10349
Veja como fica no gráfico 👇
{future}(SPCXUSDT)
Apenas análise pessoal do mercado. Isto não é aconselhamento financeiro — gerencie o risco e faça sua própria pesquisa.
A SPCX já está se movimentando por conta própria, então este recuo contra a tendência é uma oportunidade de maior risco que estou assumindo.
$SPCX /USDT - 🟢 COMPRA
Plano de trade:
Entrada: 135.05520 – 135.18480
SL: 131.62825
Área de TP: 137.73881 - 142.10349
Veja como fica no gráfico 👇
Apenas análise pessoal do mercado. Isto não é aconselhamento financeiro — gerencie o risco e faça sua própria pesquisa.
$SPCX /USDT - 🟢 COMPRA
Plano de trade:
Entrada: 135.05520 – 135.18480
SL: 131.62825
Área de TP: 137.73881 - 142.10349
Veja como fica no gráfico 👇
Apenas análise pessoal do mercado. Isto não é aconselhamento financeiro — gerencie o risco e faça sua própria pesquisa.
64
·
--
Em Baixa
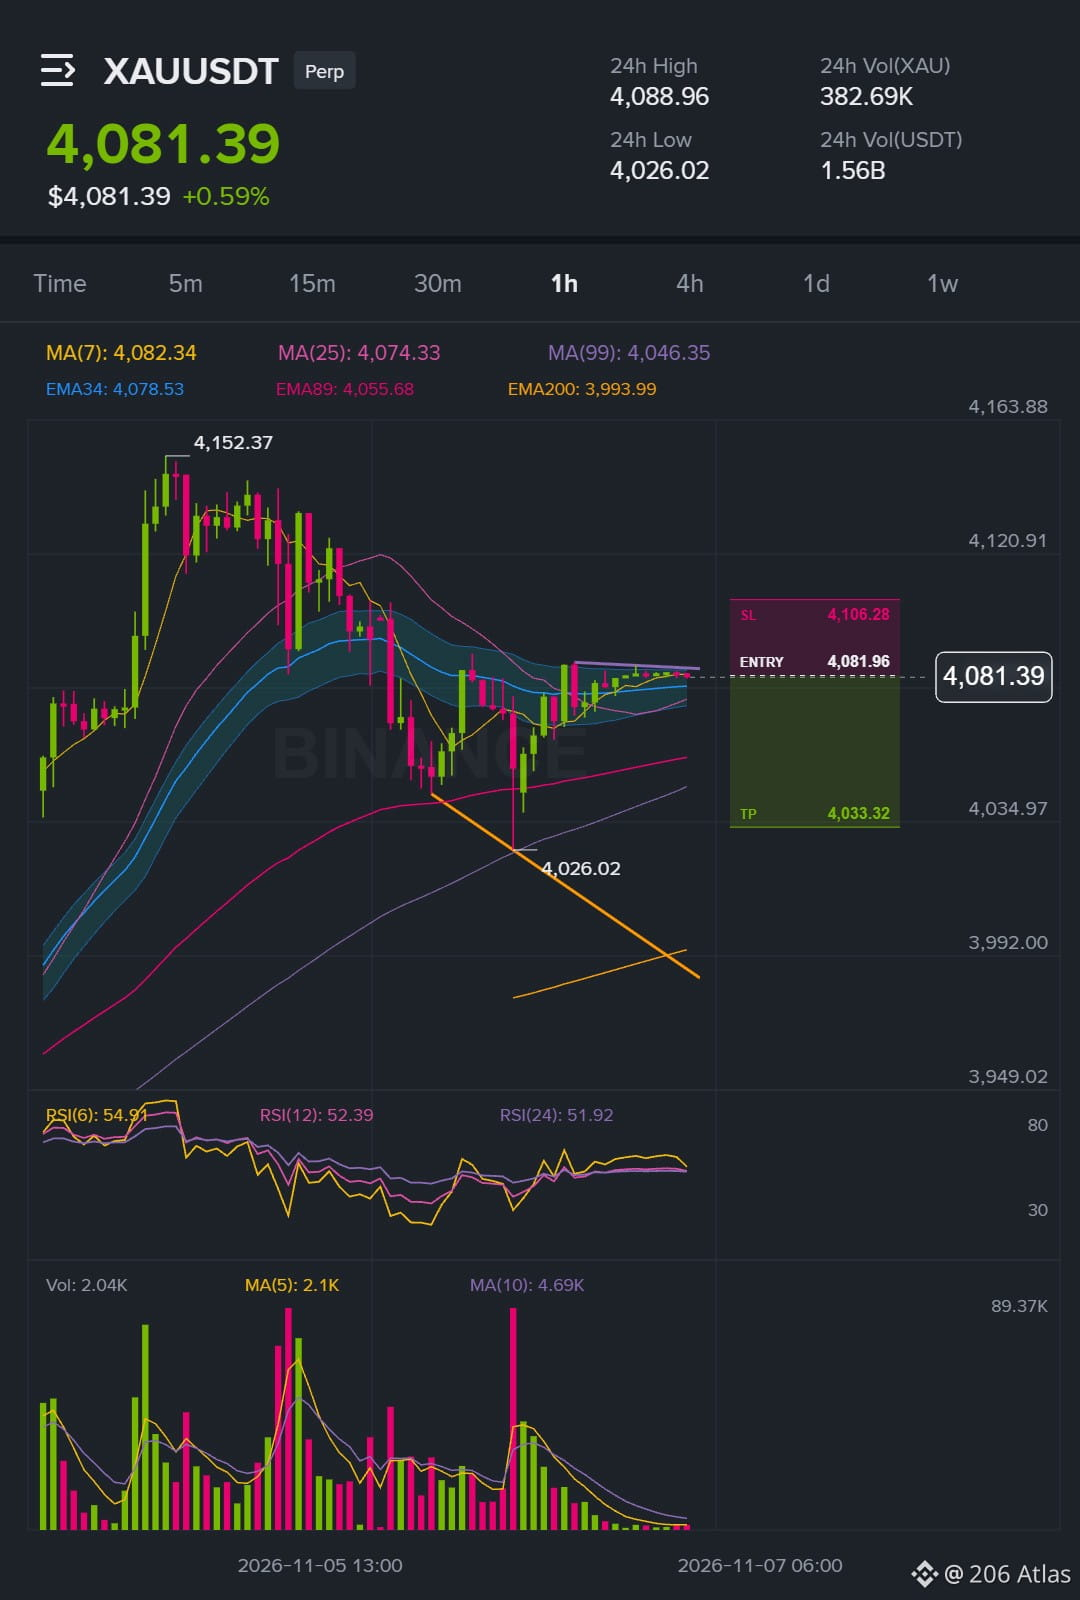
A maioria está de olho na virada em 4037.88, mas o movimento abaixo desse nível conta uma história diferente.
$XAU /USDT - 🔴 VENDA
Plano de trade:
Entrada: 4081.70 – 4082.22
SL: 4106.28
Área de TP: 4063.72 - 4033.32
Por que esta operação? O XAU já está dentro da zona e a estrutura de 1h mantém a tendência intacta. Por que agora? O RSI está esticado para baixo, enquanto o movimento ainda não rompeu 4037.88. Se o preço respeitar a zona e rejeitar 4106.28, a operação tem espaço para avançar em direção a 4063.72 e 4033.32. Já publiquei sobre este par algumas horas atrás, então vou deixar o gráfico vir até mim novamente.
Mantenha o stop apertado e deixe a operação se desenrolar.
Veja como está no gráfico 👇
{future}(XAUUSDT)
Apenas análise pessoal do mercado. Não é aconselhamento financeiro — gerencie o risco e faça sua própria pesquisa.
A maioria está de olho na virada em 4037.88, mas o movimento abaixo desse nível conta uma história diferente.
$XAU /USDT - 🔴 VENDA
Plano de trade:
Entrada: 4081.70 – 4082.22
SL: 4106.28
Área de TP: 4063.72 - 4033.32
Por que esta operação? O XAU já está dentro da zona e a estrutura de 1h mantém a tendência intacta. Por que agora? O RSI está esticado para baixo, enquanto o movimento ainda não rompeu 4037.88. Se o preço respeitar a zona e rejeitar 4106.28, a operação tem espaço para avançar em direção a 4063.72 e 4033.32. Já publiquei sobre este par algumas horas atrás, então vou deixar o gráfico vir até mim novamente.
Mantenha o stop apertado e deixe a operação se desenrolar.
Veja como está no gráfico 👇
Apenas análise pessoal do mercado. Não é aconselhamento financeiro — gerencie o risco e faça sua própria pesquisa.
$XAU /USDT - 🔴 VENDA
Plano de trade:
Entrada: 4081.70 – 4082.22
SL: 4106.28
Área de TP: 4063.72 - 4033.32
Por que esta operação? O XAU já está dentro da zona e a estrutura de 1h mantém a tendência intacta. Por que agora? O RSI está esticado para baixo, enquanto o movimento ainda não rompeu 4037.88. Se o preço respeitar a zona e rejeitar 4106.28, a operação tem espaço para avançar em direção a 4063.72 e 4033.32. Já publiquei sobre este par algumas horas atrás, então vou deixar o gráfico vir até mim novamente.
Mantenha o stop apertado e deixe a operação se desenrolar.
Veja como está no gráfico 👇
Apenas análise pessoal do mercado. Não é aconselhamento financeiro — gerencie o risco e faça sua própria pesquisa.
57
·
--
Em Alta
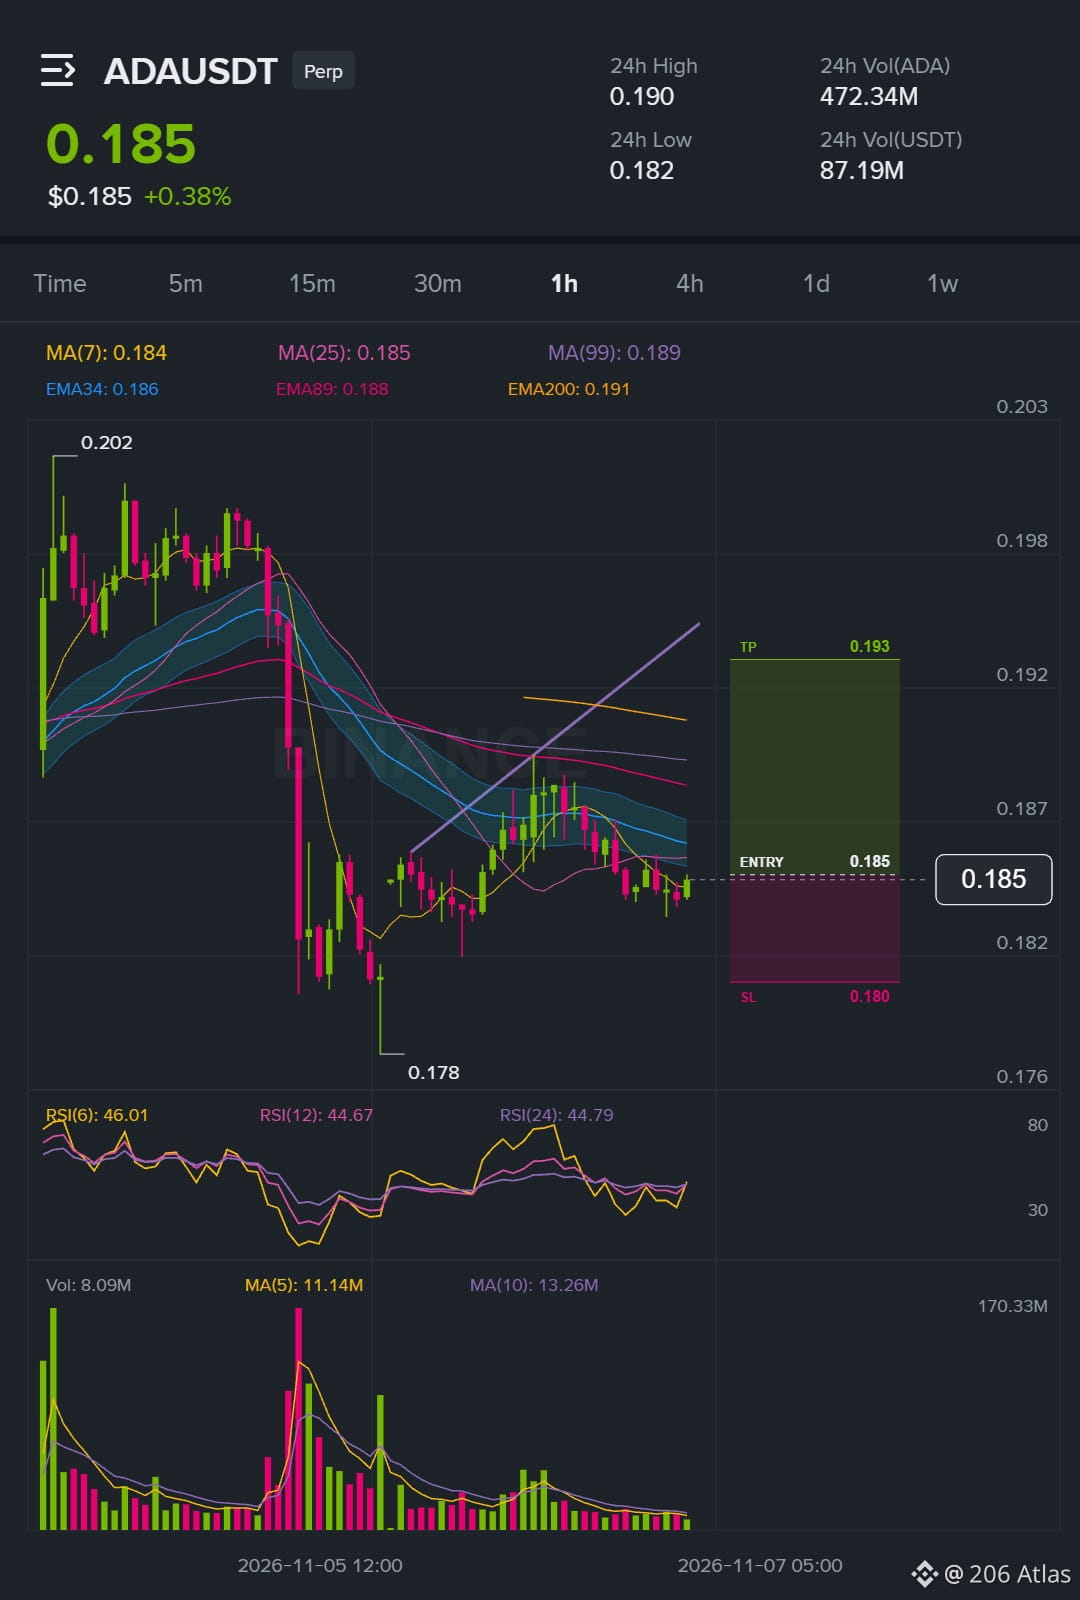
ADA está segurando a mesma zona que publiquei há algumas horas.
A tendência no gráfico de 15 min está fraca e irregular, então os níveis são mais importantes que o momentum. A volatilidade está comprimida em relação à sua faixa recente, o que pode preparar o terreno para um movimento maior. Estou novamente na mesma direção da tendência.
$ADA /USDT - 🟢 COMPRA
Plano de trade:
Entrada: 0.18465 – 0.18495
SL: 0.18049
Área de TP: 0.18804 - 0.19343
Gráfico completo abaixo 👇
{future}(ADAUSDT)
Apenas análise pessoal do mercado. Isto não é aconselhamento financeiro — gerencie o risco e faça sua própria pesquisa.
Próximo ativo que estou estudando: $XAU
ADA está segurando a mesma zona que publiquei há algumas horas.
A tendência no gráfico de 15 min está fraca e irregular, então os níveis são mais importantes que o momentum. A volatilidade está comprimida em relação à sua faixa recente, o que pode preparar o terreno para um movimento maior. Estou novamente na mesma direção da tendência.
$ADA /USDT - 🟢 COMPRA
Plano de trade:
Entrada: 0.18465 – 0.18495
SL: 0.18049
Área de TP: 0.18804 - 0.19343
Gráfico completo abaixo 👇
Apenas análise pessoal do mercado. Isto não é aconselhamento financeiro — gerencie o risco e faça sua própria pesquisa.
Próximo ativo que estou estudando: $XAU
A tendência no gráfico de 15 min está fraca e irregular, então os níveis são mais importantes que o momentum. A volatilidade está comprimida em relação à sua faixa recente, o que pode preparar o terreno para um movimento maior. Estou novamente na mesma direção da tendência.
$ADA /USDT - 🟢 COMPRA
Plano de trade:
Entrada: 0.18465 – 0.18495
SL: 0.18049
Área de TP: 0.18804 - 0.19343
Gráfico completo abaixo 👇
Apenas análise pessoal do mercado. Isto não é aconselhamento financeiro — gerencie o risco e faça sua própria pesquisa.
Próximo ativo que estou estudando: $XAU
58
·
--
Em Alta
Ver tradução
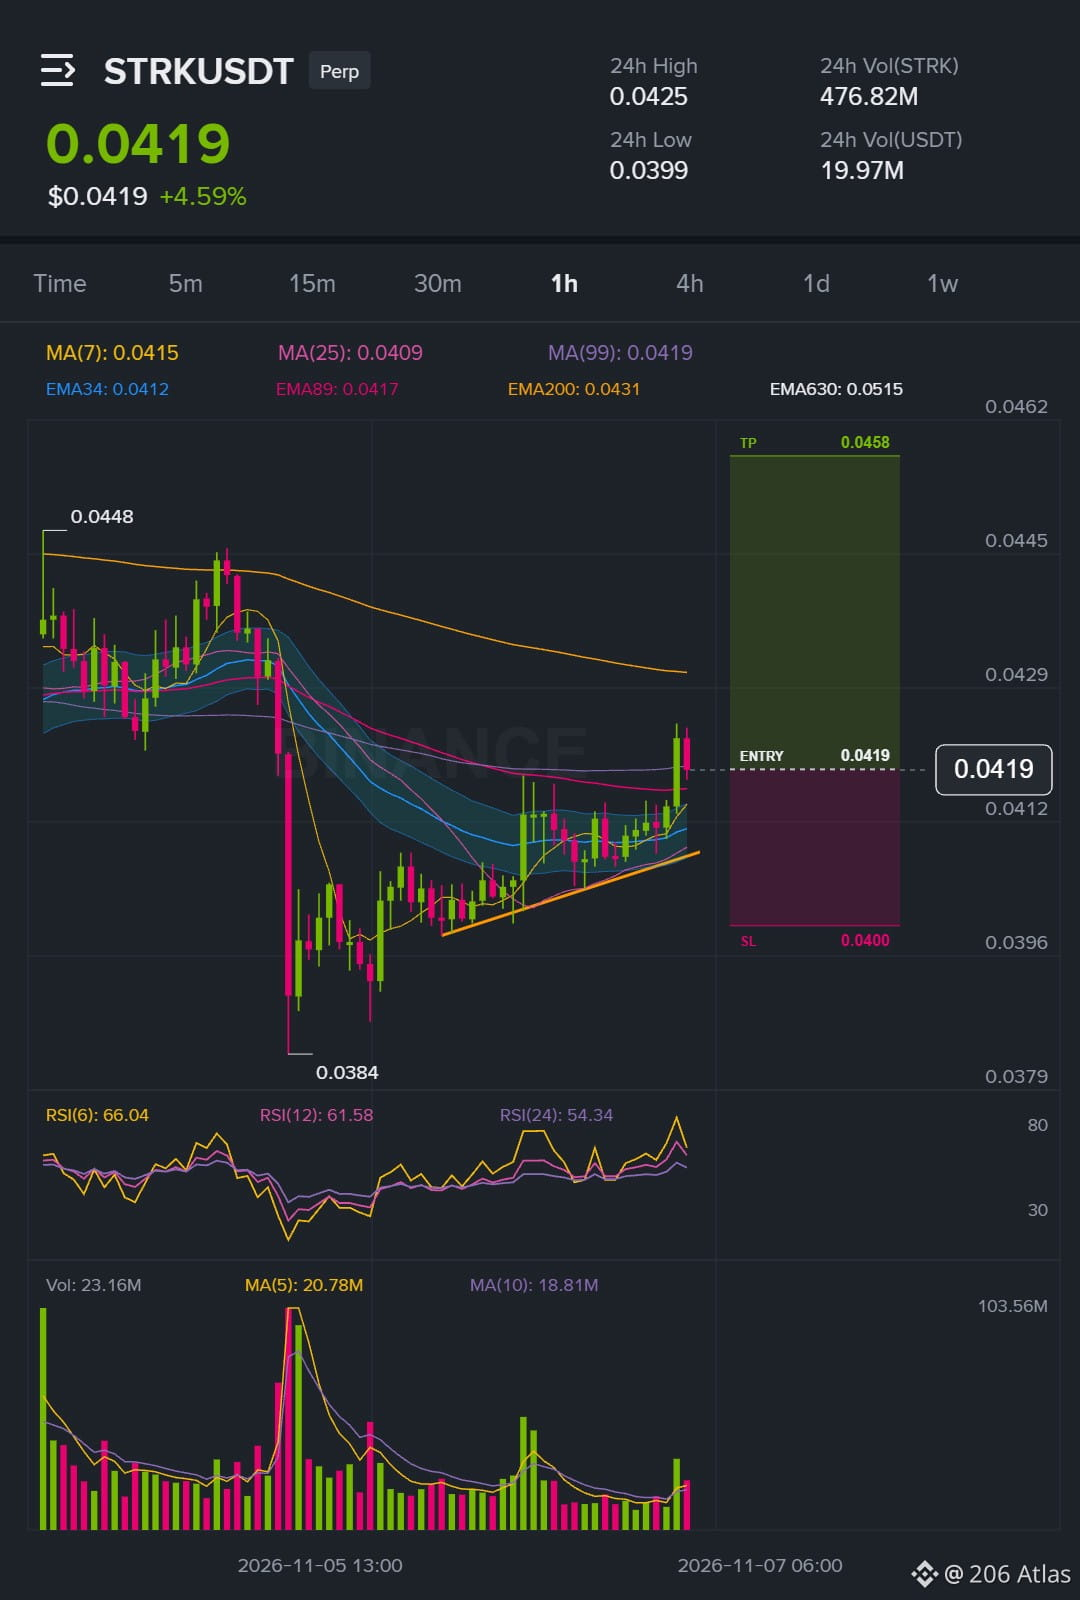
Waiting for the level to come to you is the only move that matters.
STRK is already inside the entry zone and the 1h structure is building with the trend. The setup is clean enough to size in here.
$STRK /USDT - 🟢 LONG
Trade Plan:
Entry: 0.0418245 – 0.0419755
SL: 0.0399713
TP Area: 0.0433466 - 0.0457575
Levels are marked on the chart 👇
{future}(STRKUSDT)
Personal market analysis only. Not financial advice — manage risk and do your own research.
Waiting for the level to come to you is the only move that matters.
STRK is already inside the entry zone and the 1h structure is building with the trend. The setup is clean enough to size in here.
$STRK /USDT - 🟢 LONG
Trade Plan:
Entry: 0.0418245 – 0.0419755
SL: 0.0399713
TP Area: 0.0433466 - 0.0457575
Levels are marked on the chart 👇
Personal market analysis only. Not financial advice — manage risk and do your own research.
STRK is already inside the entry zone and the 1h structure is building with the trend. The setup is clean enough to size in here.
$STRK /USDT - 🟢 LONG
Trade Plan:
Entry: 0.0418245 – 0.0419755
SL: 0.0399713
TP Area: 0.0433466 - 0.0457575
Levels are marked on the chart 👇
Personal market analysis only. Not financial advice — manage risk and do your own research.
61
·
--
Em Baixa
Ver tradução
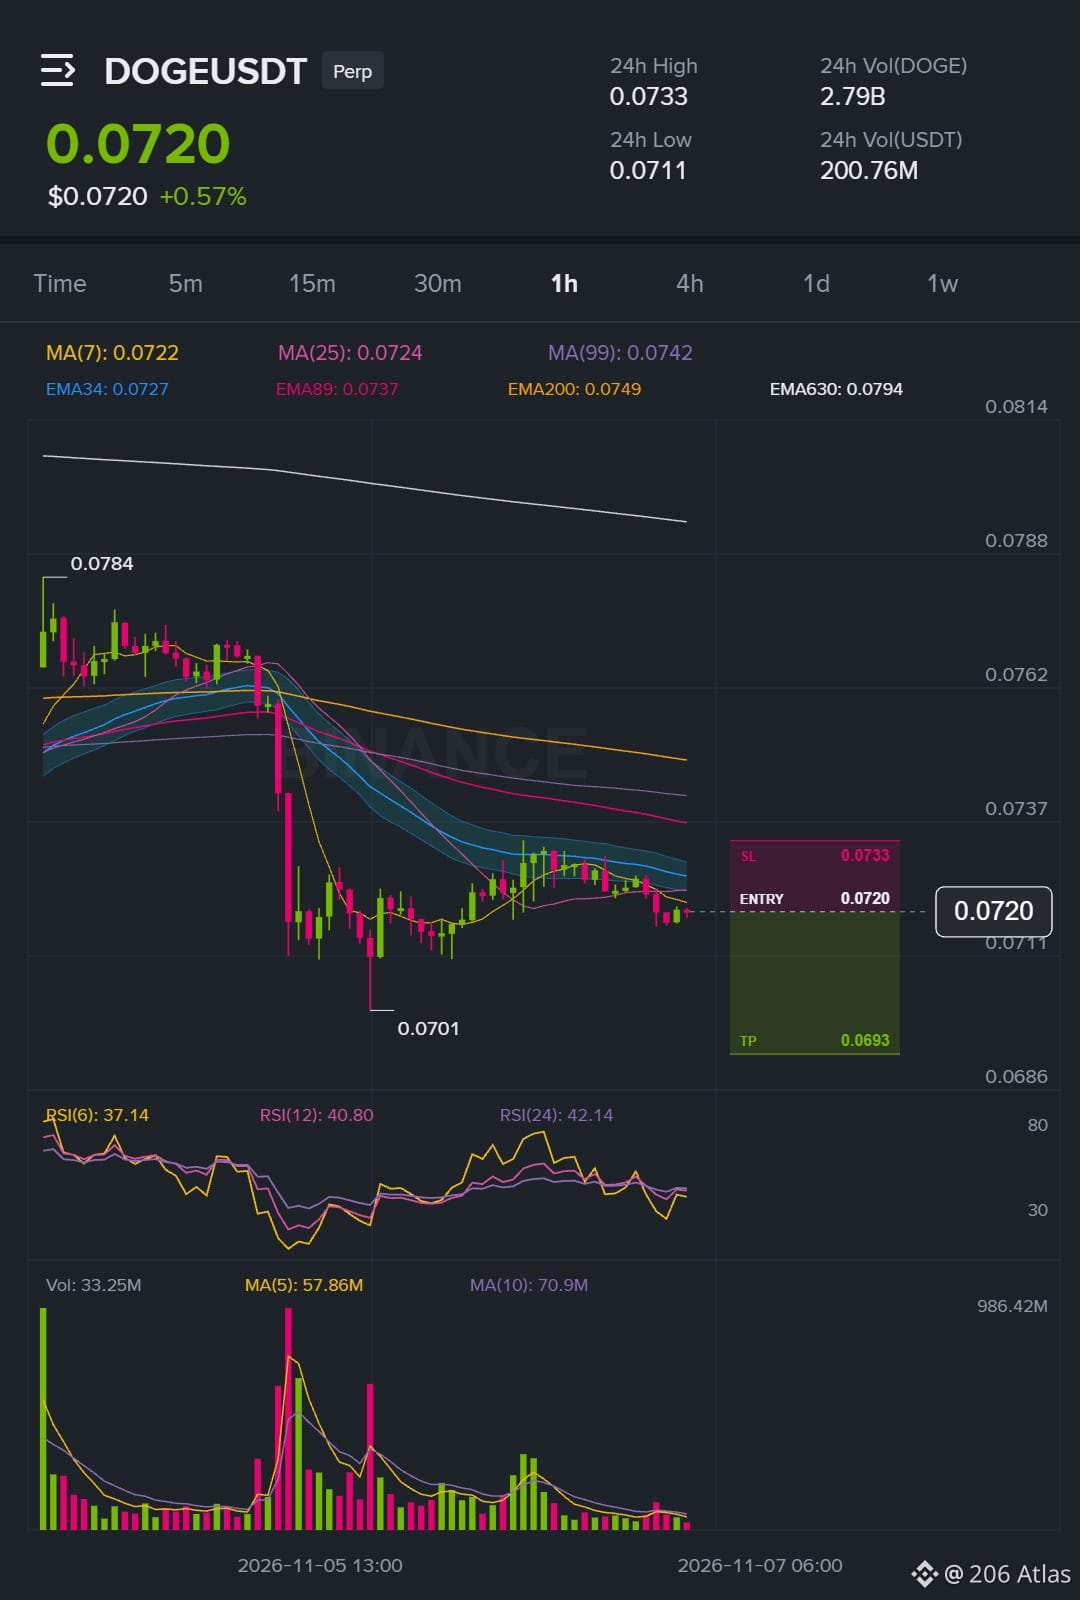
BTC is trying to bounce, but DOGE is not following.
Daily trend is bearish, so I'm trading with the bigger picture. The 15m BTC structure is bullish, which means this short deliberately fights that momentum. I changed my mind from the earlier call posted a few hours back, and the zone now sits around 0.071938 to 0.072022.
$DOGE /USDT - 🔴 SHORT
Trade Plan:
Entry: 0.071938 – 0.072022
SL: 0.073336
TP Area: 0.070963 - 0.069267
The setup has a clear invalidation level above it.
Chart with my levels 👇
{future}(DOGEUSDT)
Personal market analysis only. Not financial advice — manage risk and do your own research.
Next setup on deck: $STRK
BTC is trying to bounce, but DOGE is not following.
Daily trend is bearish, so I'm trading with the bigger picture. The 15m BTC structure is bullish, which means this short deliberately fights that momentum. I changed my mind from the earlier call posted a few hours back, and the zone now sits around 0.071938 to 0.072022.
$DOGE /USDT - 🔴 SHORT
Trade Plan:
Entry: 0.071938 – 0.072022
SL: 0.073336
TP Area: 0.070963 - 0.069267
The setup has a clear invalidation level above it.
Chart with my levels 👇
Personal market analysis only. Not financial advice — manage risk and do your own research.
Next setup on deck: $STRK
Daily trend is bearish, so I'm trading with the bigger picture. The 15m BTC structure is bullish, which means this short deliberately fights that momentum. I changed my mind from the earlier call posted a few hours back, and the zone now sits around 0.071938 to 0.072022.
$DOGE /USDT - 🔴 SHORT
Trade Plan:
Entry: 0.071938 – 0.072022
SL: 0.073336
TP Area: 0.070963 - 0.069267
The setup has a clear invalidation level above it.
Chart with my levels 👇
Personal market analysis only. Not financial advice — manage risk and do your own research.
Next setup on deck: $STRK
40
·
--
Em Alta
Ver tradução
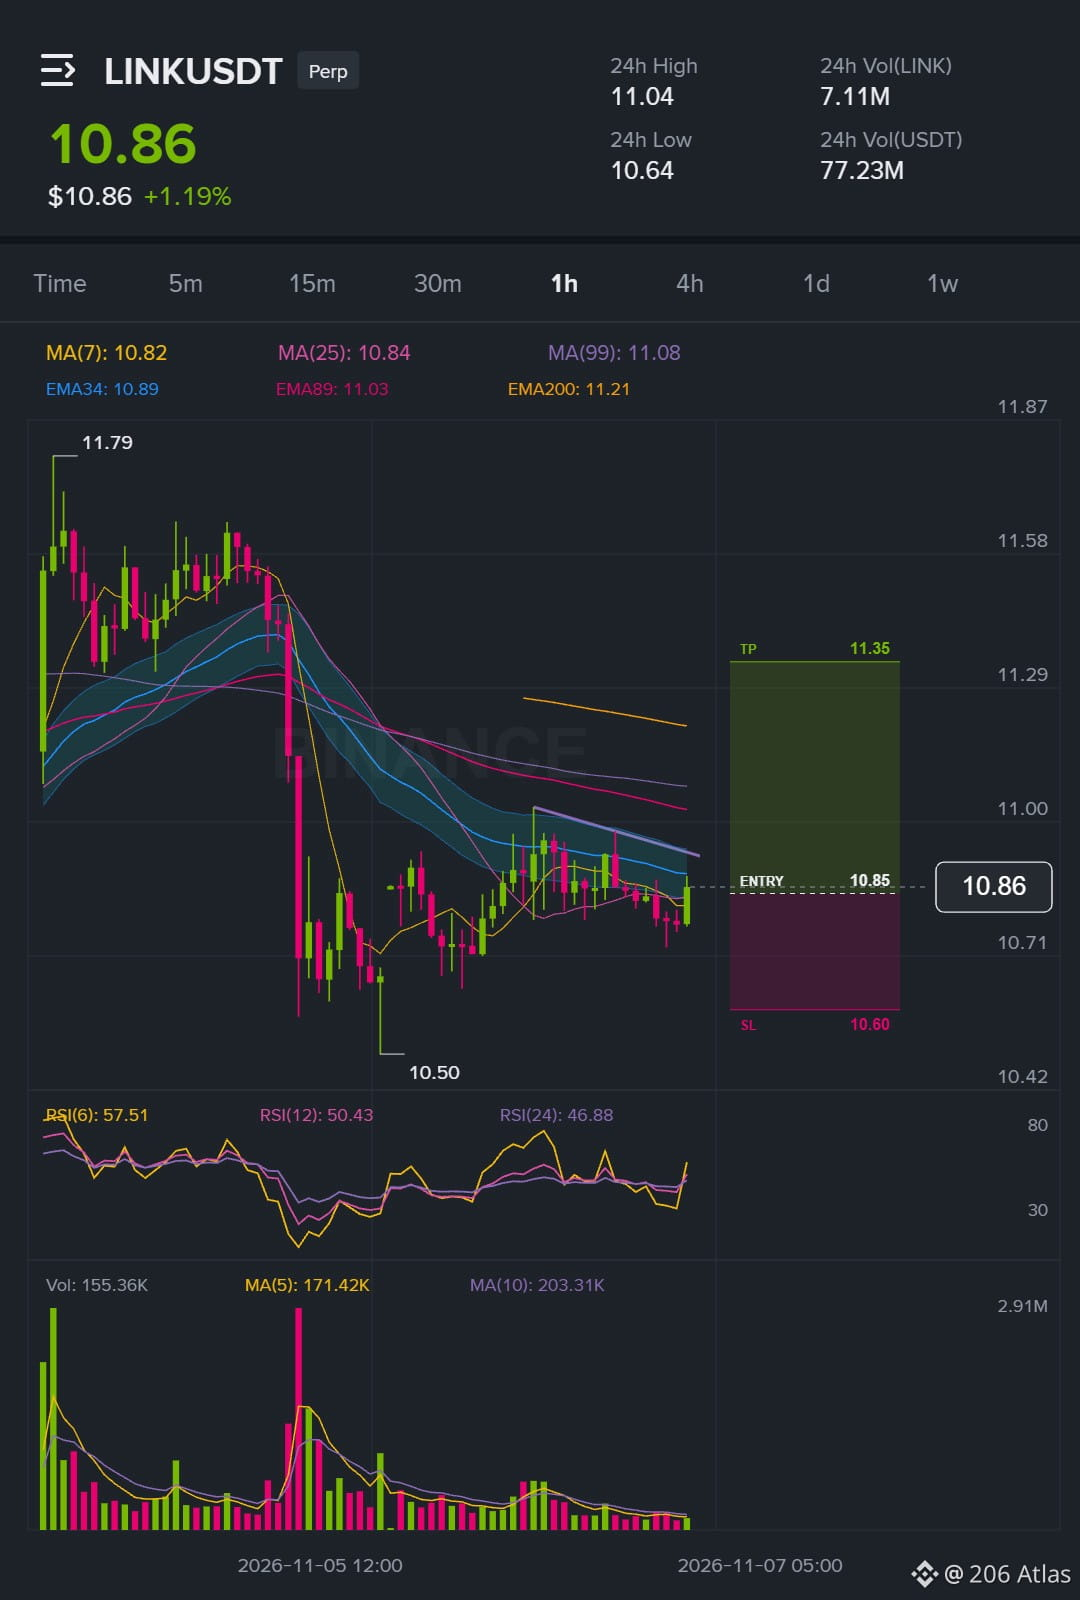
Two ways LINK plays out from here.
$LINK /USDT - 🟢 LONG
Trade Plan:
Entry: 10.839 – 10.857
SL: 10.597
TP Area: 11.036 - 11.349
LINK sits inside the 10.839 - 10.857 entry zone, and the plan rides with the trend on the 1h. If it respects 11.071 and pushes toward the targets, the setup plays out. If it fails and holds below 11.071, the thesis breaks and you step aside.
Plan is the plan, no attachment needed.
Chart with my levels 👇
{future}(LINKUSDT)
Personal market analysis only. Not financial advice — manage risk and do your own research.
$STRK is building something. Keeping it close.
Two ways LINK plays out from here.
$LINK /USDT - 🟢 LONG
Trade Plan:
Entry: 10.839 – 10.857
SL: 10.597
TP Area: 11.036 - 11.349
LINK sits inside the 10.839 - 10.857 entry zone, and the plan rides with the trend on the 1h. If it respects 11.071 and pushes toward the targets, the setup plays out. If it fails and holds below 11.071, the thesis breaks and you step aside.
Plan is the plan, no attachment needed.
Chart with my levels 👇
Personal market analysis only. Not financial advice — manage risk and do your own research.
$STRK is building something. Keeping it close.
$LINK /USDT - 🟢 LONG
Trade Plan:
Entry: 10.839 – 10.857
SL: 10.597
TP Area: 11.036 - 11.349
LINK sits inside the 10.839 - 10.857 entry zone, and the plan rides with the trend on the 1h. If it respects 11.071 and pushes toward the targets, the setup plays out. If it fails and holds below 11.071, the thesis breaks and you step aside.
Plan is the plan, no attachment needed.
Chart with my levels 👇
Personal market analysis only. Not financial advice — manage risk and do your own research.
$STRK is building something. Keeping it close.
67
·
--
Em Baixa
Ver tradução
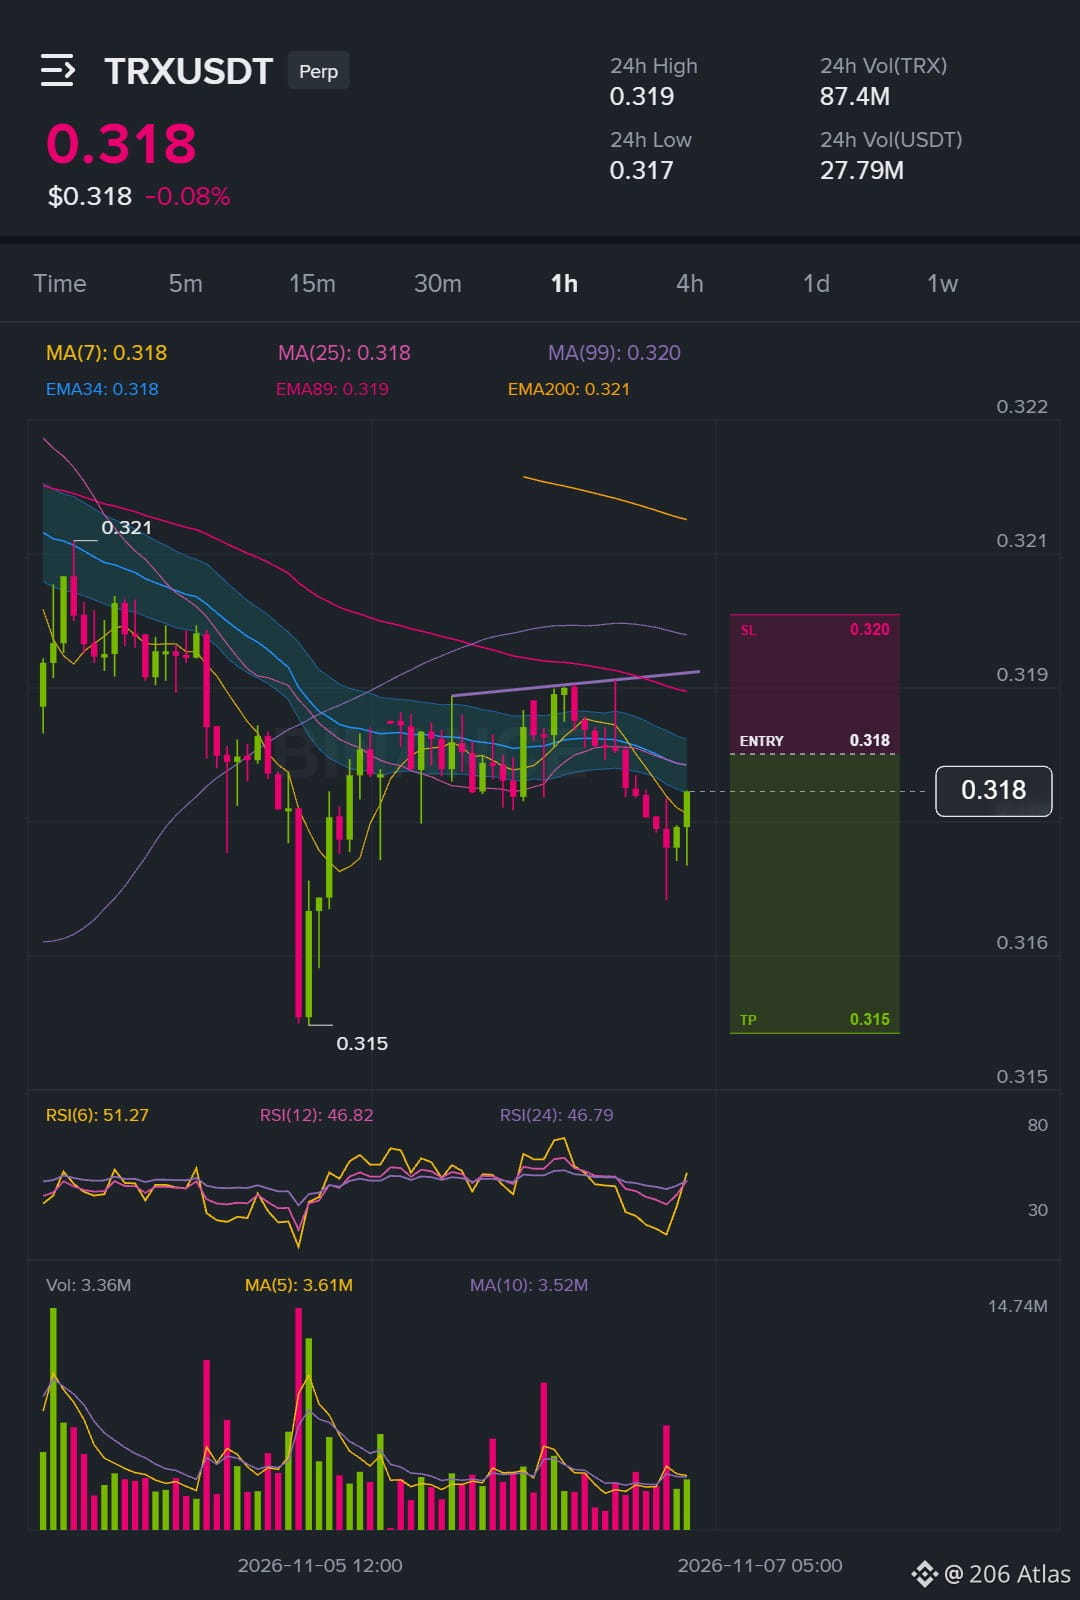
$TRX /USDT - 🔴 SHORT · Conf 37%
Trade Plan:
Entry: 0.31836 – 0.31850
SL: 0.31999
TP Area: 0.31726 - 0.31530
Note: Probable direction is SHORT, but this is a counter-trend setup with low confirmation; be careful and strictly respect the stop loss.
Click here to view the chart 👇️
{future}(TRXUSDT)
Personal market analysis only. Not financial advice — manage risk and do your own research.
$TRX /USDT - 🔴 SHORT · Conf 37%
Trade Plan:
Entry: 0.31836 – 0.31850
SL: 0.31999
TP Area: 0.31726 - 0.31530
Note: Probable direction is SHORT, but this is a counter-trend setup with low confirmation; be careful and strictly respect the stop loss.
Click here to view the chart 👇️
Personal market analysis only. Not financial advice — manage risk and do your own research.
Trade Plan:
Entry: 0.31836 – 0.31850
SL: 0.31999
TP Area: 0.31726 - 0.31530
Note: Probable direction is SHORT, but this is a counter-trend setup with low confirmation; be careful and strictly respect the stop loss.
Click here to view the chart 👇️
Personal market analysis only. Not financial advice — manage risk and do your own research.
73
·
--
Em Alta
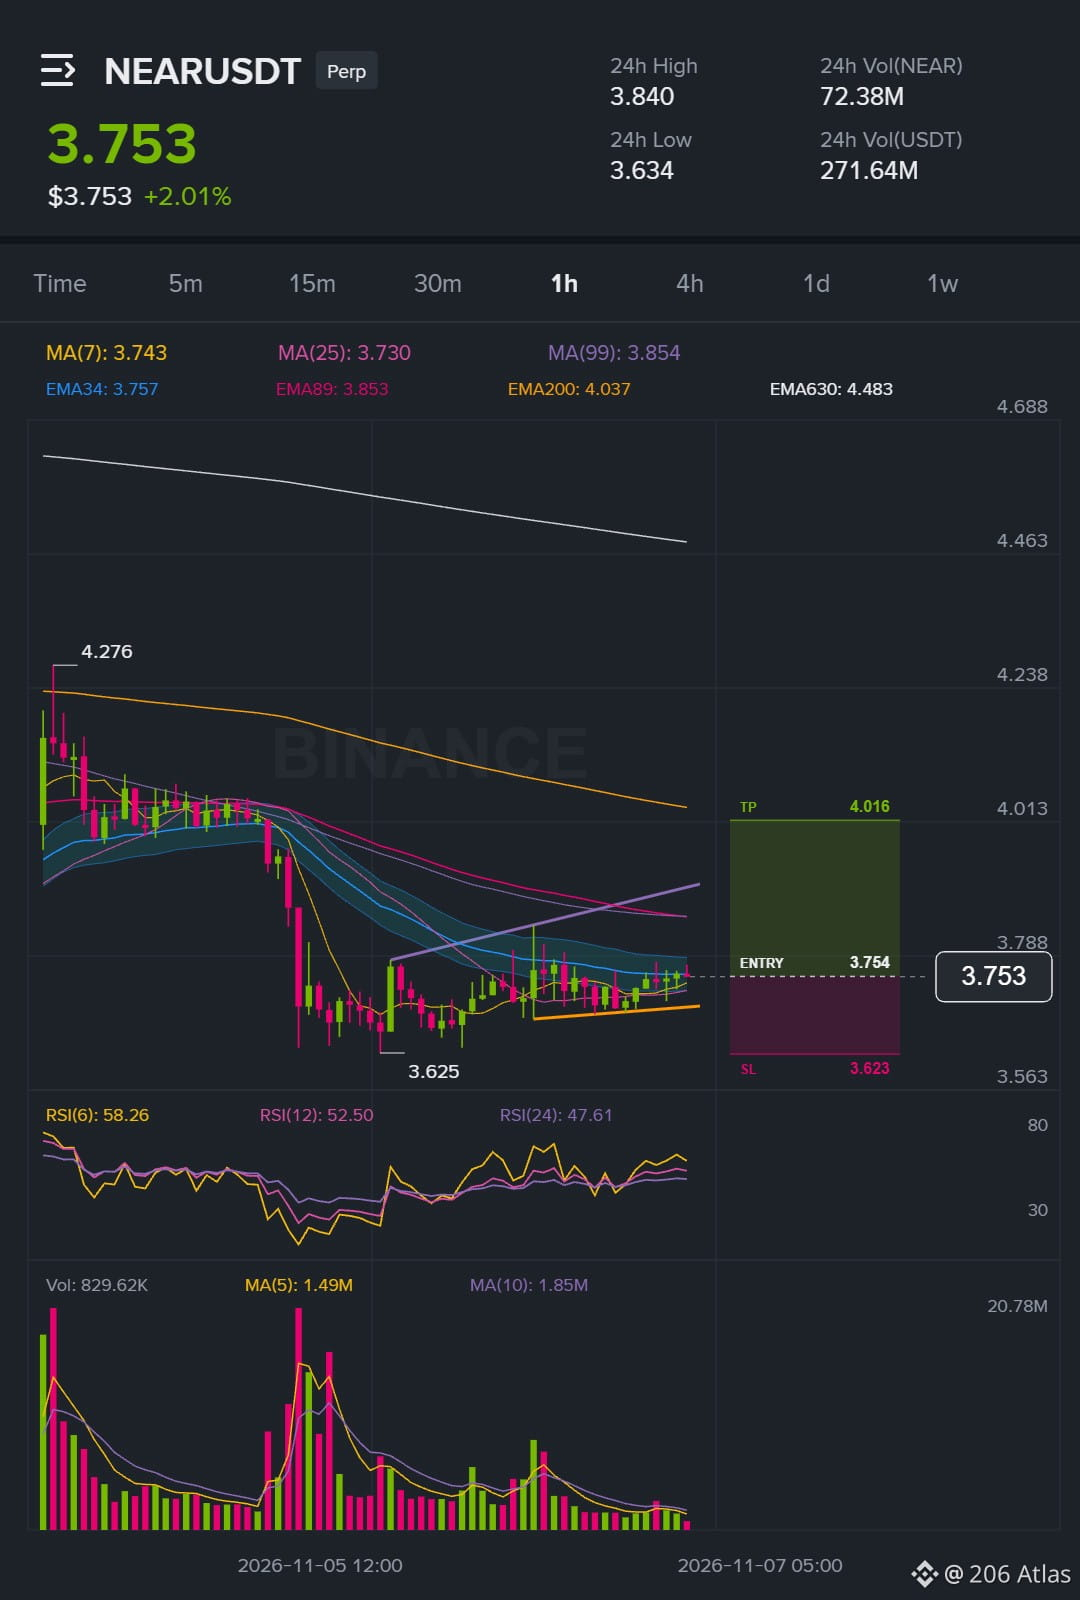
Mudei de ideia sobre NEAR, então aqui está o plano.
$NEAR /USDT - 🟢 COMPRA
Plano de trade:
Entrada: 3.7486 – 3.7594
SL: 3.6231
Zona de TP: 3.8522 - 4.0158
Tenha cuidado: a tendência de 15 min está fraca e instável, então estou priorizando os níveis em vez do momentum, enquanto a tendência do BTC continua otimista. Vou operar com uma posição menor e respeitar o stop.
Clique aqui para ver o gráfico 👇️
{future}(NEARUSDT)
Apenas análise pessoal do mercado. Não é aconselhamento financeiro — gerencie o risco e faça sua própria pesquisa.
$TRX é a próxima configuração que vou publicar.
Mudei de ideia sobre NEAR, então aqui está o plano.
$NEAR /USDT - 🟢 COMPRA
Plano de trade:
Entrada: 3.7486 – 3.7594
SL: 3.6231
Zona de TP: 3.8522 - 4.0158
Tenha cuidado: a tendência de 15 min está fraca e instável, então estou priorizando os níveis em vez do momentum, enquanto a tendência do BTC continua otimista. Vou operar com uma posição menor e respeitar o stop.
Clique aqui para ver o gráfico 👇️
Apenas análise pessoal do mercado. Não é aconselhamento financeiro — gerencie o risco e faça sua própria pesquisa.
$TRX é a próxima configuração que vou publicar.
$NEAR /USDT - 🟢 COMPRA
Plano de trade:
Entrada: 3.7486 – 3.7594
SL: 3.6231
Zona de TP: 3.8522 - 4.0158
Tenha cuidado: a tendência de 15 min está fraca e instável, então estou priorizando os níveis em vez do momentum, enquanto a tendência do BTC continua otimista. Vou operar com uma posição menor e respeitar o stop.
Clique aqui para ver o gráfico 👇️
Apenas análise pessoal do mercado. Não é aconselhamento financeiro — gerencie o risco e faça sua própria pesquisa.
$TRX é a próxima configuração que vou publicar.
25
·
--
Em Baixa
Ver tradução
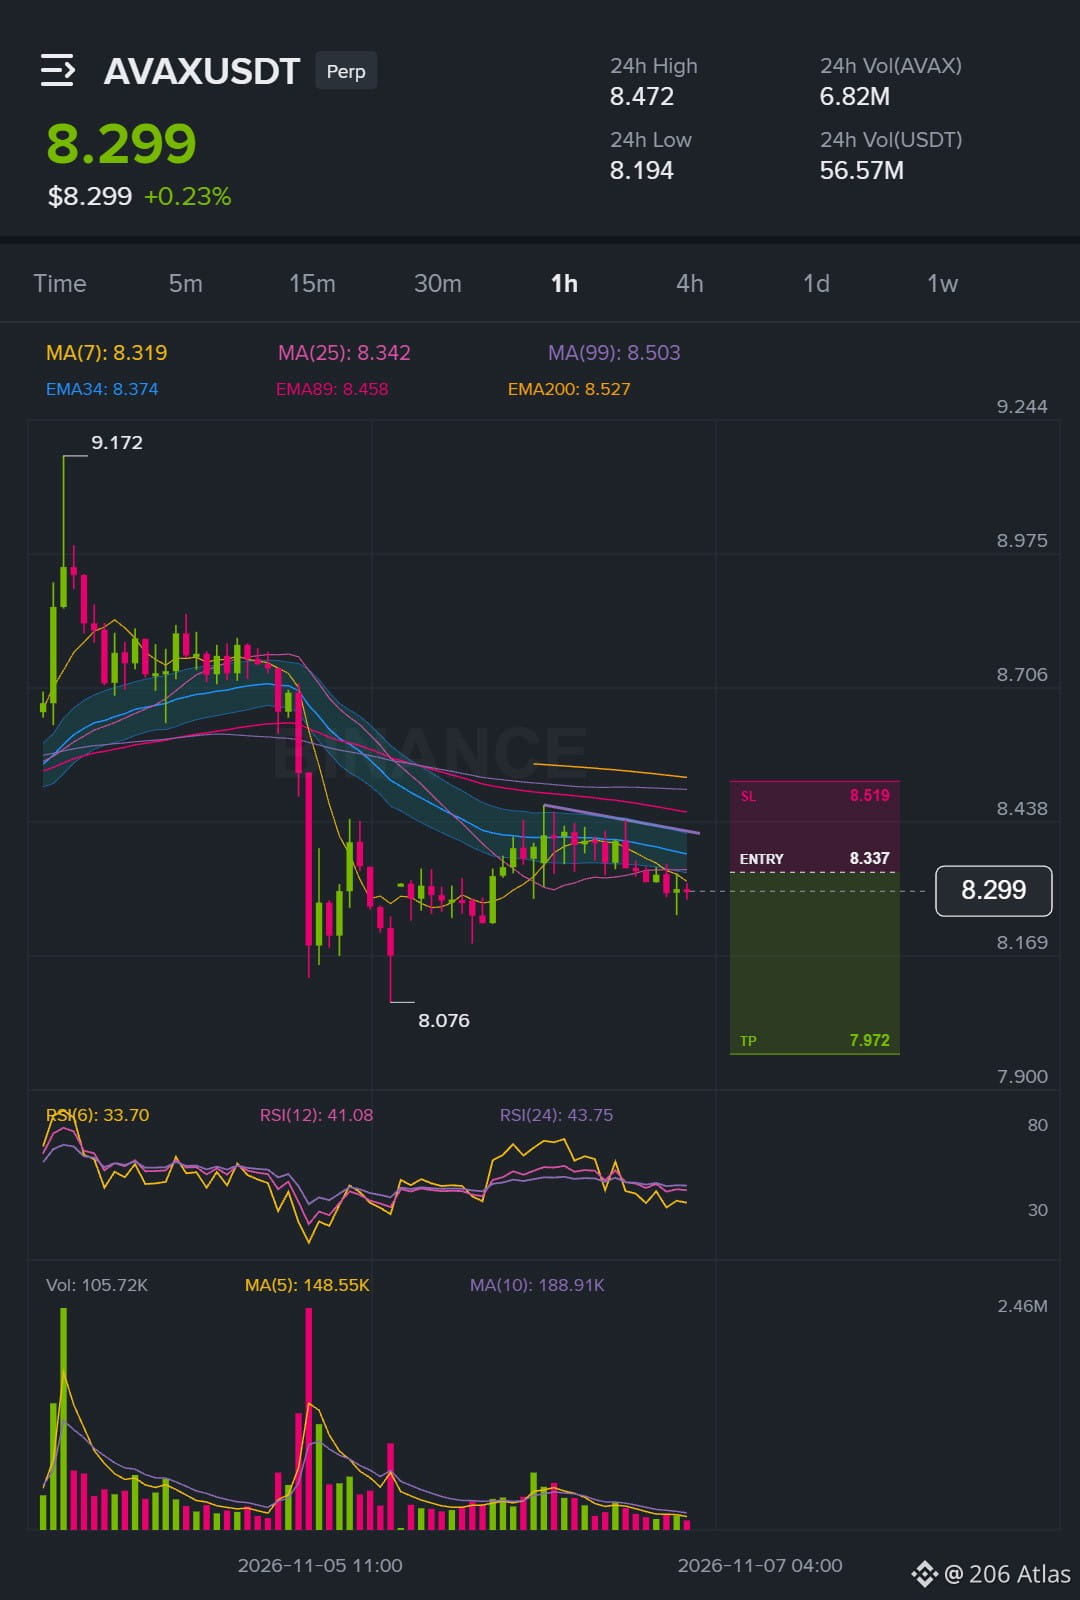
AVAX looks like a simple bounce, but the structure says otherwise.
Price is already inside the entry zone, so I flipped my view from hours ago. Volatility is compressed against its recent range, and with the trend intact, a bigger move follows. I'm treating the 8.3370 level as a short setup, not a pullback to hold.
$AVAX /USDT - 🔴 SHORT
Trade Plan:
Entry: 8.3298 – 8.3442
SL: 8.5194
TP Area: 8.2002 - 7.9722
Here's how it looks on the chart 👇
{future}(AVAXUSDT)
Personal market analysis only. Not financial advice — manage risk and do your own research.
Don't sleep on $TRX , I'm watching it.
AVAX looks like a simple bounce, but the structure says otherwise.
Price is already inside the entry zone, so I flipped my view from hours ago. Volatility is compressed against its recent range, and with the trend intact, a bigger move follows. I'm treating the 8.3370 level as a short setup, not a pullback to hold.
$AVAX /USDT - 🔴 SHORT
Trade Plan:
Entry: 8.3298 – 8.3442
SL: 8.5194
TP Area: 8.2002 - 7.9722
Here's how it looks on the chart 👇
Personal market analysis only. Not financial advice — manage risk and do your own research.
Don't sleep on $TRX , I'm watching it.
Price is already inside the entry zone, so I flipped my view from hours ago. Volatility is compressed against its recent range, and with the trend intact, a bigger move follows. I'm treating the 8.3370 level as a short setup, not a pullback to hold.
$AVAX /USDT - 🔴 SHORT
Trade Plan:
Entry: 8.3298 – 8.3442
SL: 8.5194
TP Area: 8.2002 - 7.9722
Here's how it looks on the chart 👇
Personal market analysis only. Not financial advice — manage risk and do your own research.
Don't sleep on $TRX , I'm watching it.
42
·
--
Em Baixa
Ver tradução
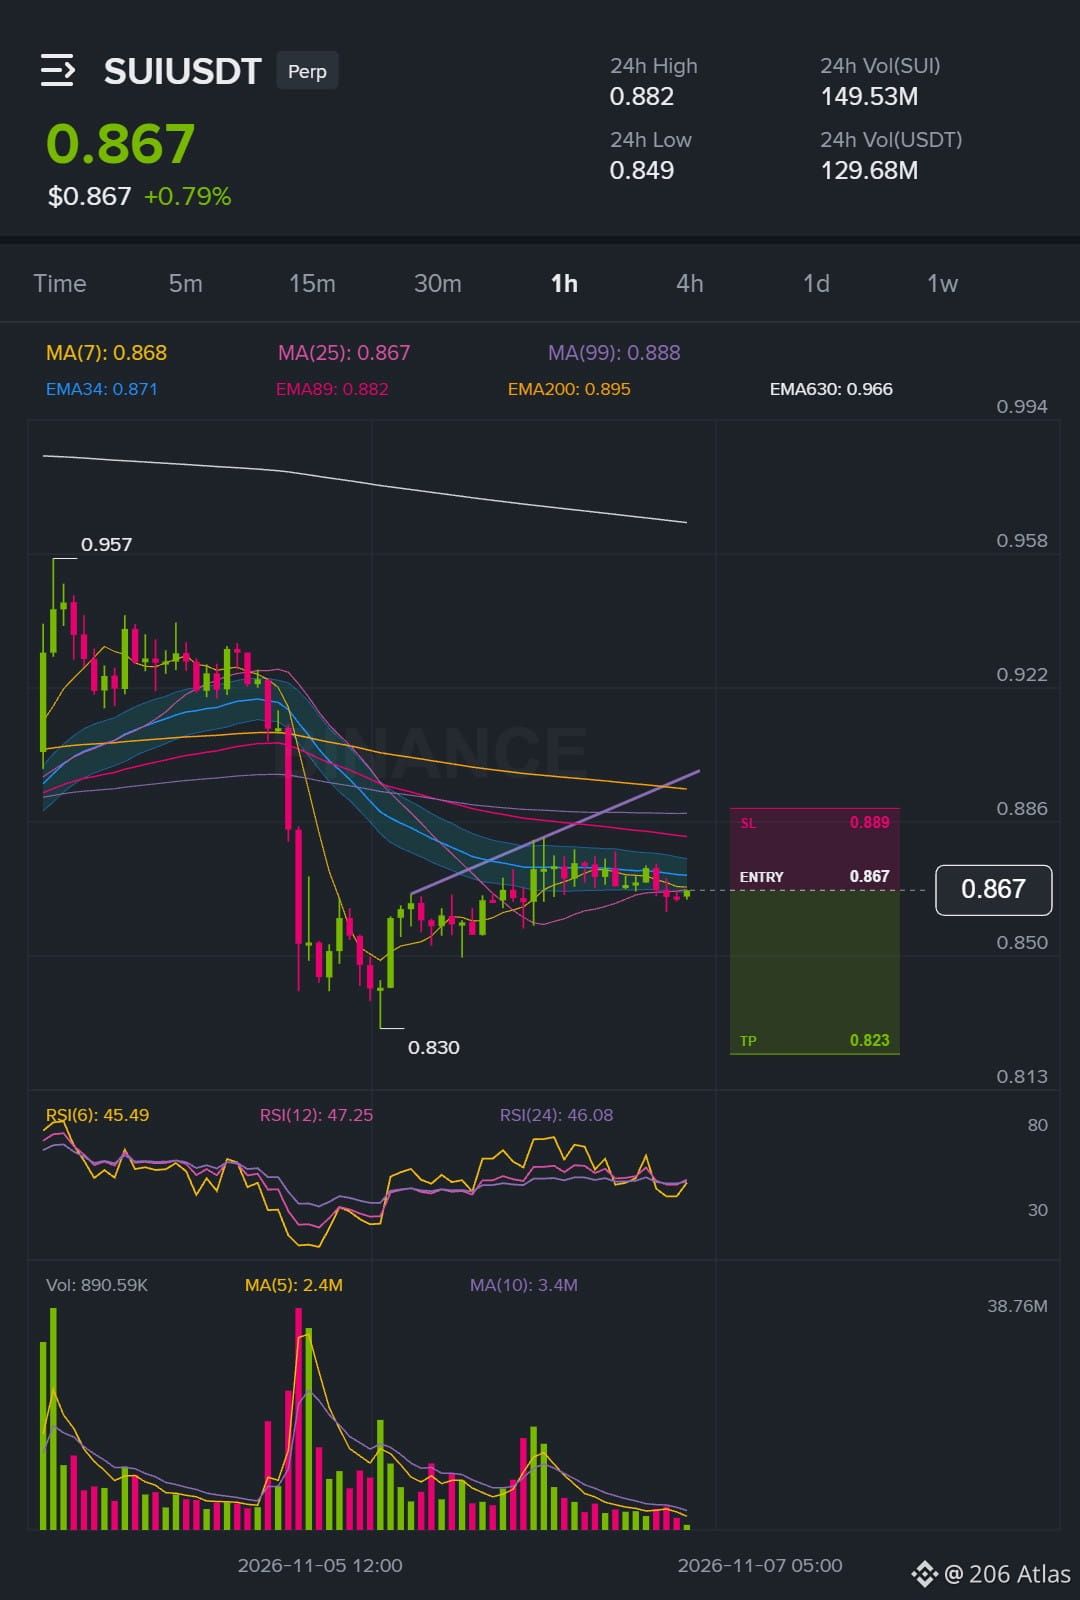
SUI is already sitting inside the zone, so no need to chase it.
The 1h structure is still intact and the setup favors the downside. I am not chasing here, just letting price come to the levels that matter. The idea loses its edge if it holds above 0.933705 on the 1h chart. The plan is simple and the invalidation is clear.
$SUI /USDT - 🔴 SHORT
Trade Plan:
Entry: 0.866549 – 0.868051
SL: 0.889394
TP Area: 0.850730 - 0.823112
Click here to view the chart 👇️
{future}(SUIUSDT)
Personal market analysis only. Not financial advice — manage risk and do your own research.
SUI is already sitting inside the zone, so no need to chase it.
The 1h structure is still intact and the setup favors the downside. I am not chasing here, just letting price come to the levels that matter. The idea loses its edge if it holds above 0.933705 on the 1h chart. The plan is simple and the invalidation is clear.
$SUI /USDT - 🔴 SHORT
Trade Plan:
Entry: 0.866549 – 0.868051
SL: 0.889394
TP Area: 0.850730 - 0.823112
Click here to view the chart 👇️
Personal market analysis only. Not financial advice — manage risk and do your own research.
The 1h structure is still intact and the setup favors the downside. I am not chasing here, just letting price come to the levels that matter. The idea loses its edge if it holds above 0.933705 on the 1h chart. The plan is simple and the invalidation is clear.
$SUI /USDT - 🔴 SHORT
Trade Plan:
Entry: 0.866549 – 0.868051
SL: 0.889394
TP Area: 0.850730 - 0.823112
Click here to view the chart 👇️
Personal market analysis only. Not financial advice — manage risk and do your own research.
26
·
--
Em Alta
Ver tradução
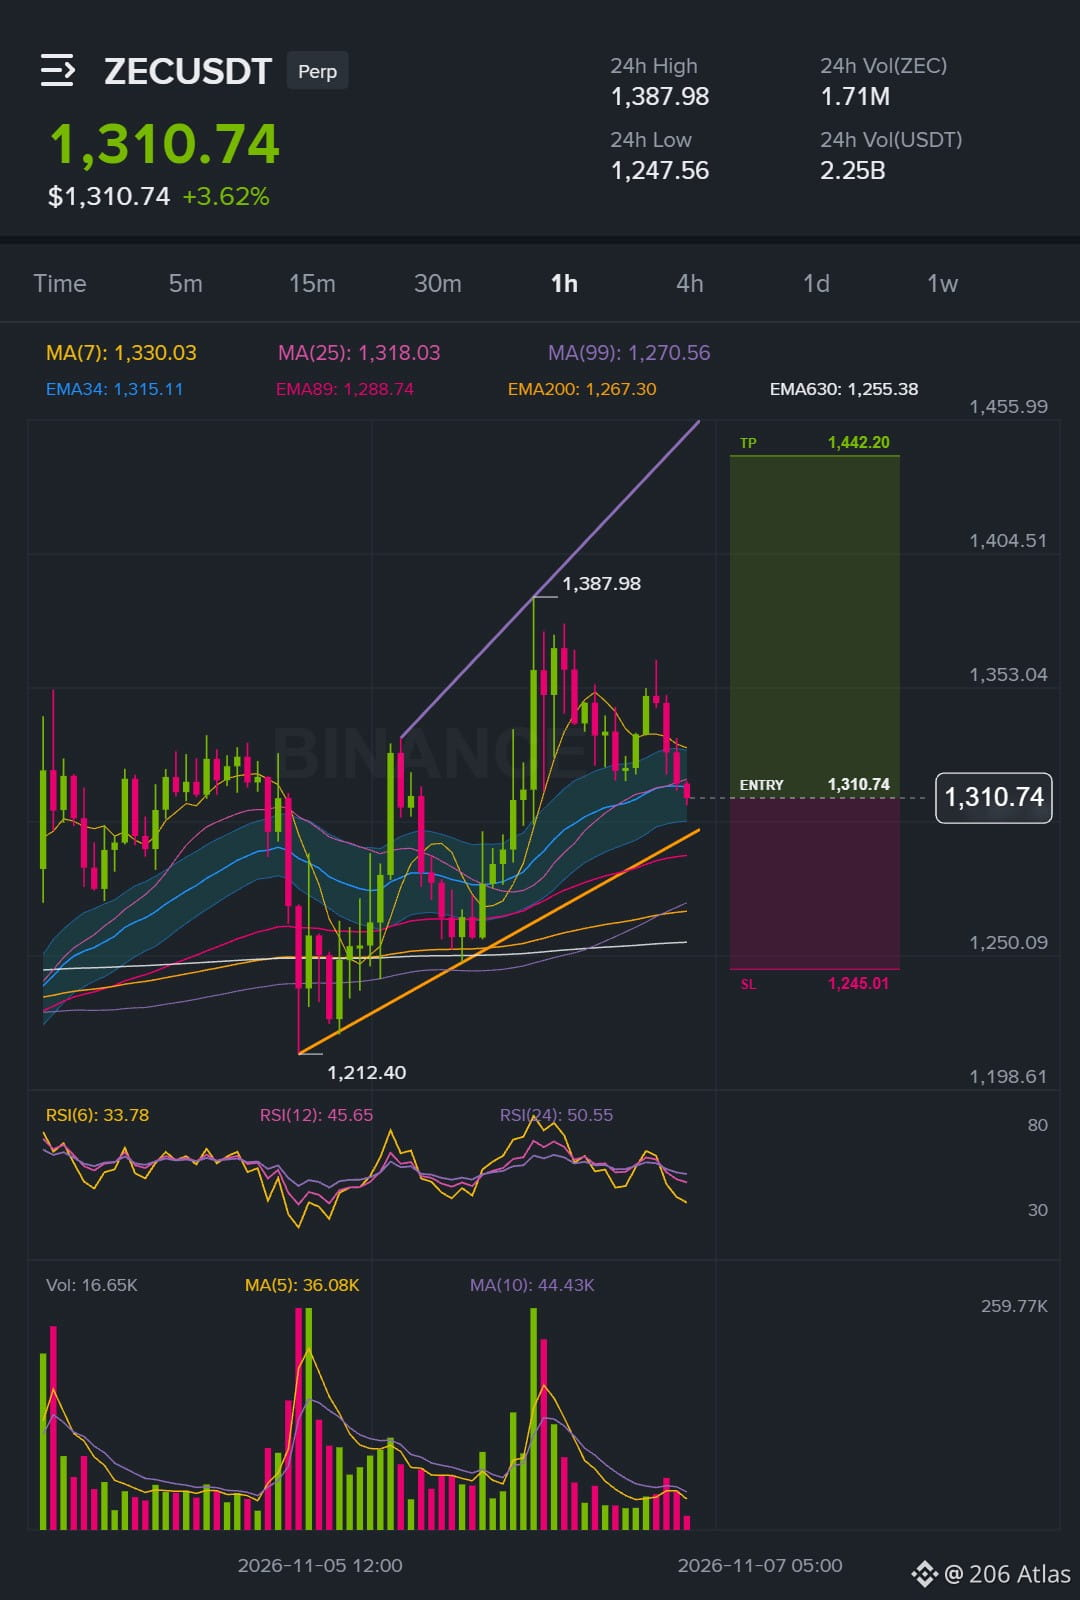
ZEC holding 1308.14 support as the setup forms 📉
$ZEC /USDT - 🟢 LONG
Trade Plan:
Entry: 1308.14 – 1313.34
SL: 1245.01
TP Area: 1360.04 - 1442.20
RSI is stretched to the downside compared with its usual range, so the momentum is still with the trend. This is call 47 today, and I already posted on ZEC a few hours back with the same direction. The price is respecting the structure, so I am adding with the setup.
Chart with my levels 👇
{future}(ZECUSDT)
Personal market analysis only. Not financial advice — manage risk and do your own research.
Working on the $SUI setup next.
ZEC holding 1308.14 support as the setup forms 📉
$ZEC /USDT - 🟢 LONG
Trade Plan:
Entry: 1308.14 – 1313.34
SL: 1245.01
TP Area: 1360.04 - 1442.20
RSI is stretched to the downside compared with its usual range, so the momentum is still with the trend. This is call 47 today, and I already posted on ZEC a few hours back with the same direction. The price is respecting the structure, so I am adding with the setup.
Chart with my levels 👇
Personal market analysis only. Not financial advice — manage risk and do your own research.
Working on the $SUI setup next.
$ZEC /USDT - 🟢 LONG
Trade Plan:
Entry: 1308.14 – 1313.34
SL: 1245.01
TP Area: 1360.04 - 1442.20
RSI is stretched to the downside compared with its usual range, so the momentum is still with the trend. This is call 47 today, and I already posted on ZEC a few hours back with the same direction. The price is respecting the structure, so I am adding with the setup.
Chart with my levels 👇
Personal market analysis only. Not financial advice — manage risk and do your own research.
Working on the $SUI setup next.
23
·
--
Em Baixa
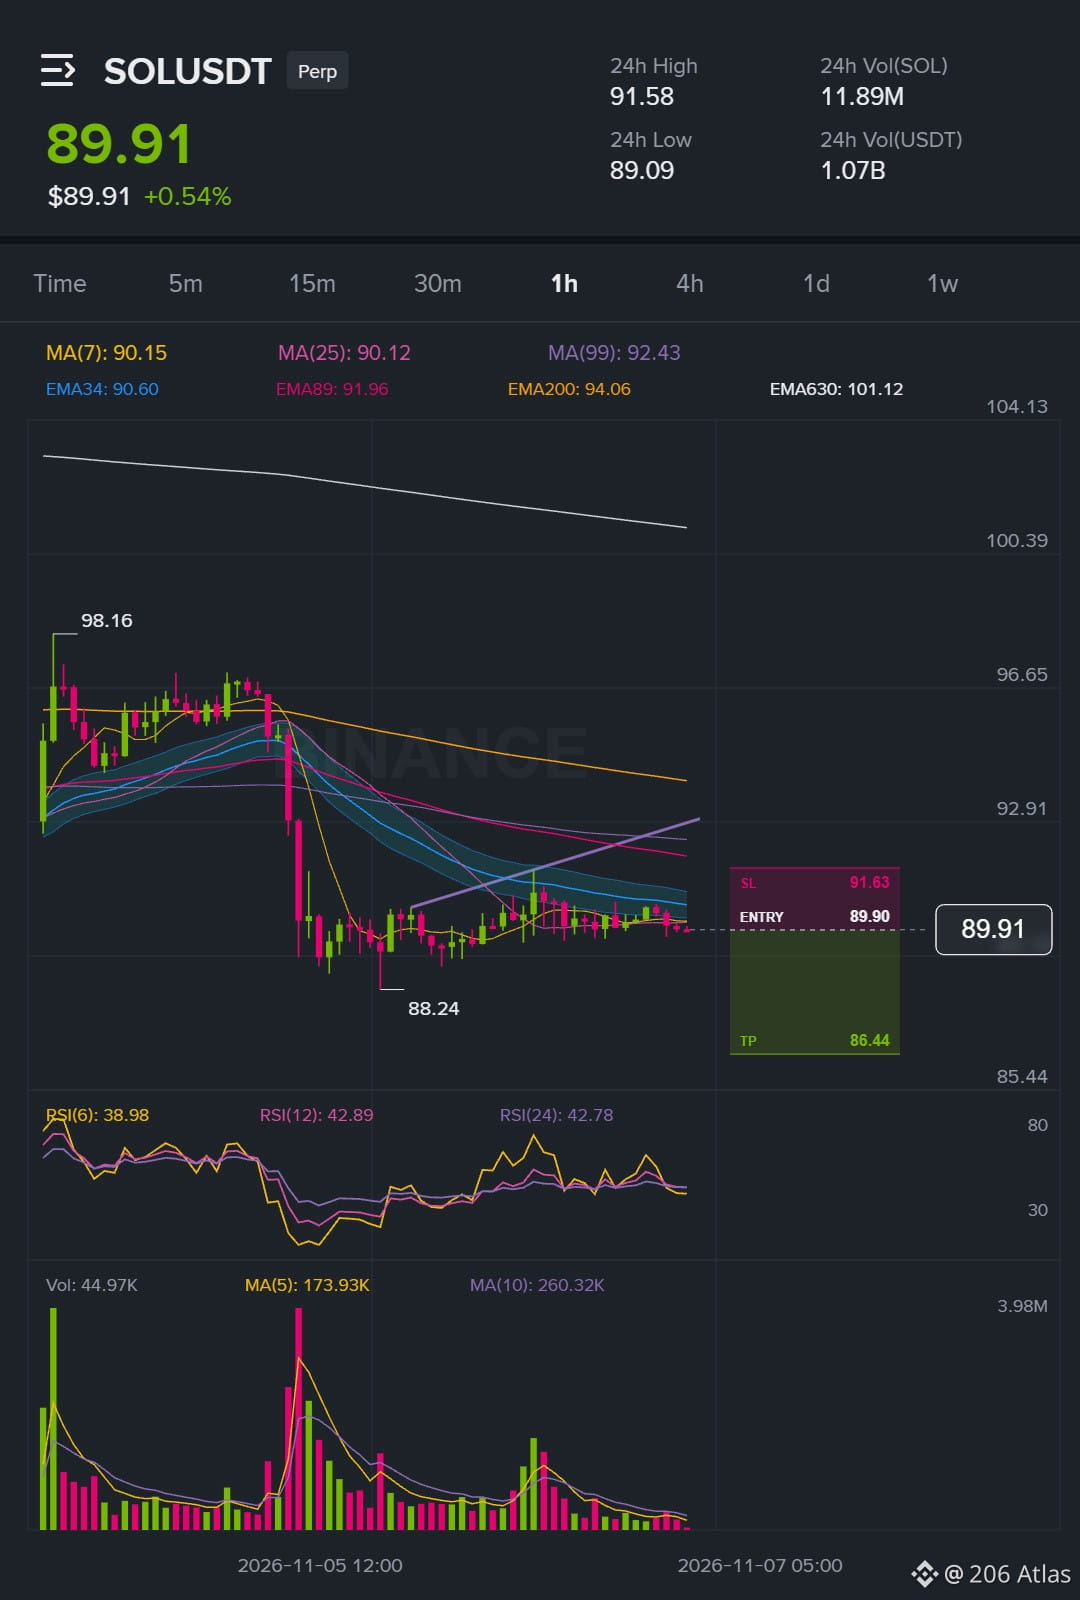
Mais uma sessão lenta, então vou deixar o gráfico vir até mim novamente.
SOL já está dentro da zona de entrada e a estrutura de 1h continua enfraquecendo, então o plano de venda a descoberto acompanha a tendência. O cenário muda se o preço se mantiver acima de 95.0430 no gráfico de 1h, o que invalidaria completamente a configuração.
$SOL /USDT - 🔴 VENDA A DESCOBERTO
Plano de trade:
Entrada: 89.8441 – 89.9559
SL: 91.6306
Área de TP: 88.6021 - 86.4389
Gráfico completo abaixo 👇
{future}(SOLUSDT)
Apenas análise pessoal do mercado. Isto não é aconselhamento financeiro — gerencie o risco e faça sua própria pesquisa.
Mais uma sessão lenta, então vou deixar o gráfico vir até mim novamente.
SOL já está dentro da zona de entrada e a estrutura de 1h continua enfraquecendo, então o plano de venda a descoberto acompanha a tendência. O cenário muda se o preço se mantiver acima de 95.0430 no gráfico de 1h, o que invalidaria completamente a configuração.
$SOL /USDT - 🔴 VENDA A DESCOBERTO
Plano de trade:
Entrada: 89.8441 – 89.9559
SL: 91.6306
Área de TP: 88.6021 - 86.4389
Gráfico completo abaixo 👇
Apenas análise pessoal do mercado. Isto não é aconselhamento financeiro — gerencie o risco e faça sua própria pesquisa.
SOL já está dentro da zona de entrada e a estrutura de 1h continua enfraquecendo, então o plano de venda a descoberto acompanha a tendência. O cenário muda se o preço se mantiver acima de 95.0430 no gráfico de 1h, o que invalidaria completamente a configuração.
$SOL /USDT - 🔴 VENDA A DESCOBERTO
Plano de trade:
Entrada: 89.8441 – 89.9559
SL: 91.6306
Área de TP: 88.6021 - 86.4389
Gráfico completo abaixo 👇
Apenas análise pessoal do mercado. Isto não é aconselhamento financeiro — gerencie o risco e faça sua própria pesquisa.
84
Inicia sessão para explorar mais conteúdos
Junta-te a utilizadores de criptomoedas de todo o mundo na Binance Square
⚡️ Obtém informações úteis e recentes sobre criptomoedas.
💬 Com a confiança da maior exchange de criptomoedas do mundo.
👍 Descobre perspetivas reais de criadores verificados.
E-mail/Número de telefone
Tópicos em Tendência
JobsReportRaisesHikeOdds
226,188 visualizações
1,824 a discutir
Notícias TradFi | EUA criam 165.000 empregos em outubro, mais que o dobro da previsão de 65.000, enquanto desemprego cai para 4,1%
Binance News
·30 gostos
·21.1k visualizações
CPITestsDecemberRateOutlook
12,504 visualizações
181 a discutir
BitcoinRebounds$75KAsChipsLead
19,541 visualizações
210 a discutir