

Huutruong
10.3k Publicações

Huutruong
Denunciar
Bloquear Utilizador
💰 Theo dõi Crypto | Tìm kiếm cơ hội mỗi ngày ( KITE-277880 )
Aberto ao trading
Trader Frequente
5.5 ano(s)
3.6K+ A seguir
2.4K+ Seguidores
846 Gostaram
Publicações
Portfólio
Tudo
Cotações
Vídeos
Em direto
·
--
Em Baixa
Ver tradução
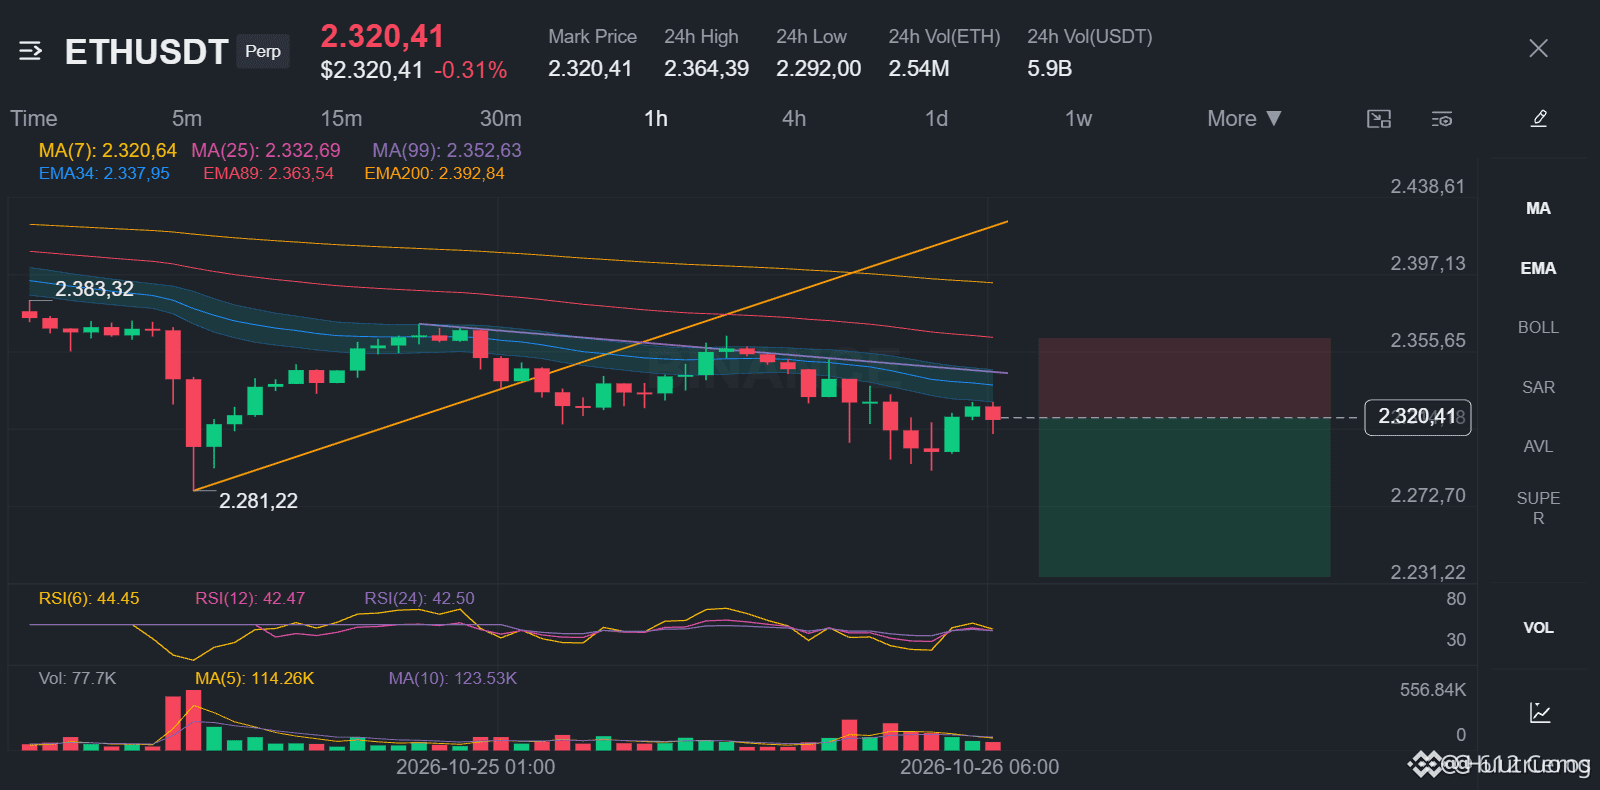
ETH is sliding in a clear bearish stack.
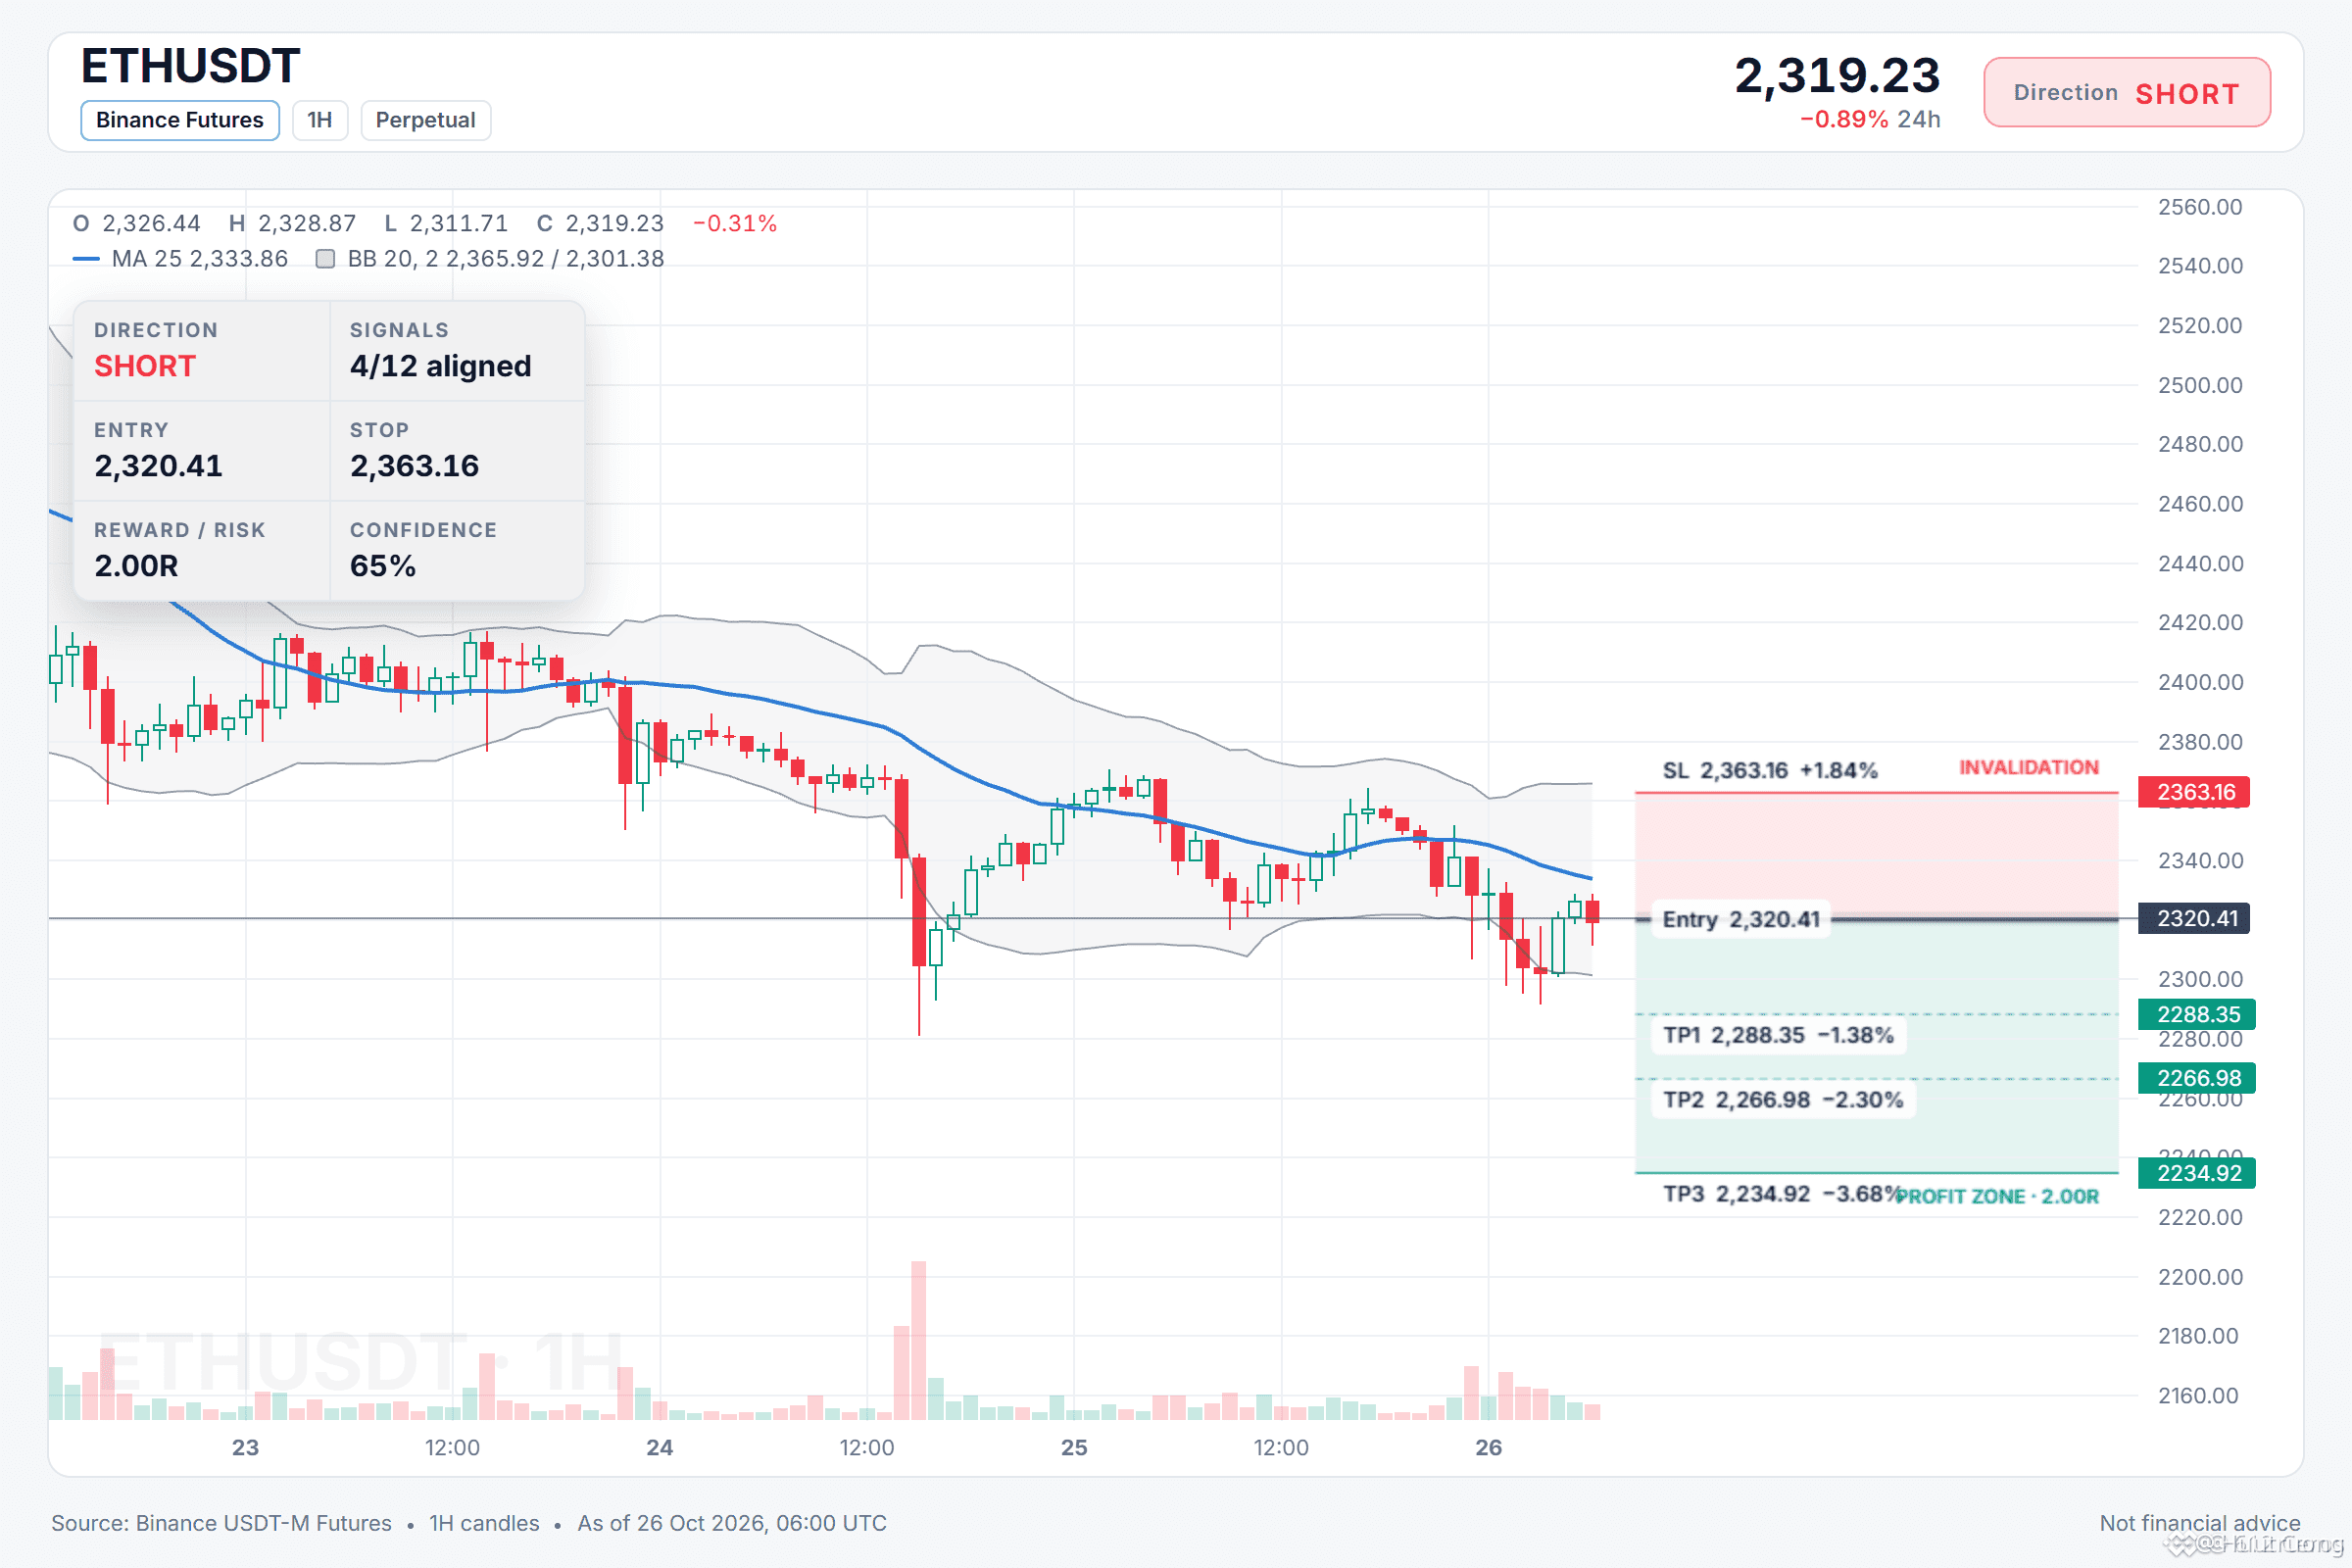
🔴 SHORT $ETH /USDT: expecting price to go DOWN
Bias: SHORT · Leaning
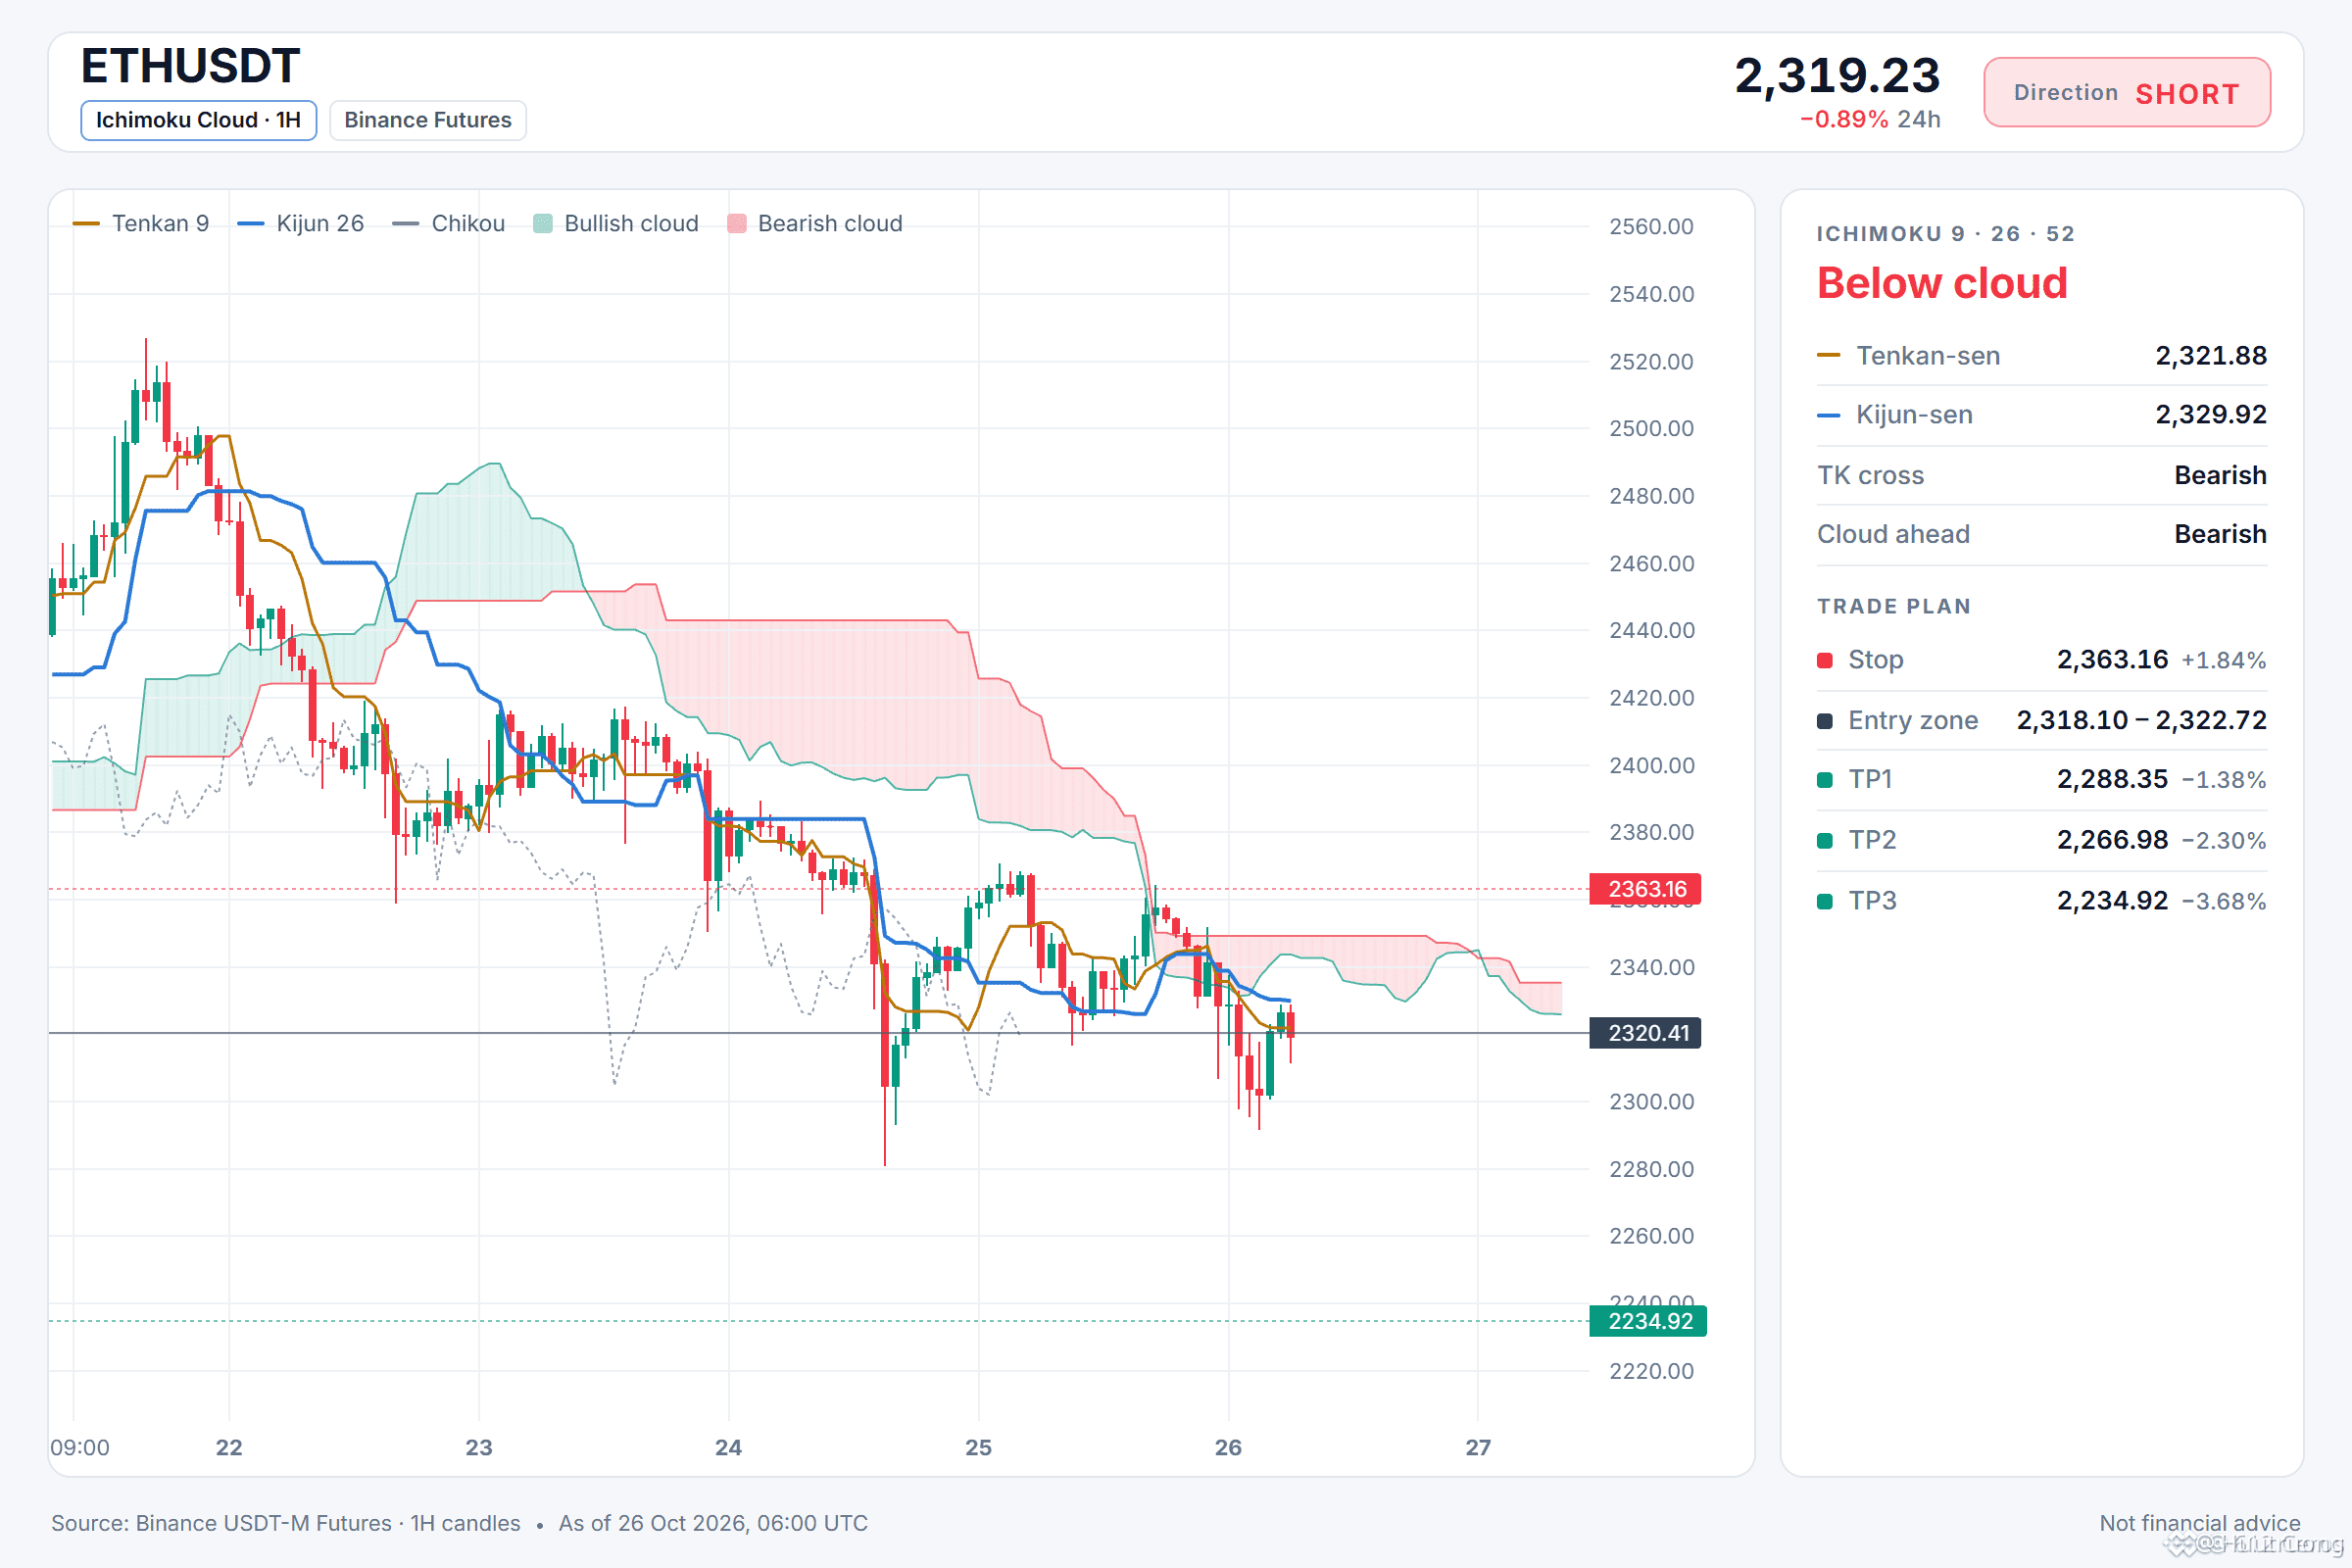
Entry: 2318.10 – 2322.72
TP1: 2288.35 (-1.4%)
TP2: 2266.98 (-2.3%)
TP3: 2234.92 (-3.7%)
SL: 2363.16 (+1.8%)
Plan: enter only inside the zone, close 50% at TP1, 25% at TP2, 25% at TP3, and move the stop to entry after TP1.
Note: moderate conviction only, keep size light.
Why SHORT? 4/12 signals agree, 0 against.
• 4h trend down (below EMA50 & EMA200)
• 1h trend down (below EMA50 & EMA200)
• Sellers have the momentum (4h RSI 33.4)
Plan A:
If the 4h trend keeps price below both EMAs, the 1h bearish stack may push it toward the TP1 zone.
Plan B (invalidation):
If price reclaims the entry level and holds above it, I would close the short and wait.
Where do you set your ETH level?
18
·
--
Em Baixa
Ver tradução
SOL is in a clear 4h downtrend
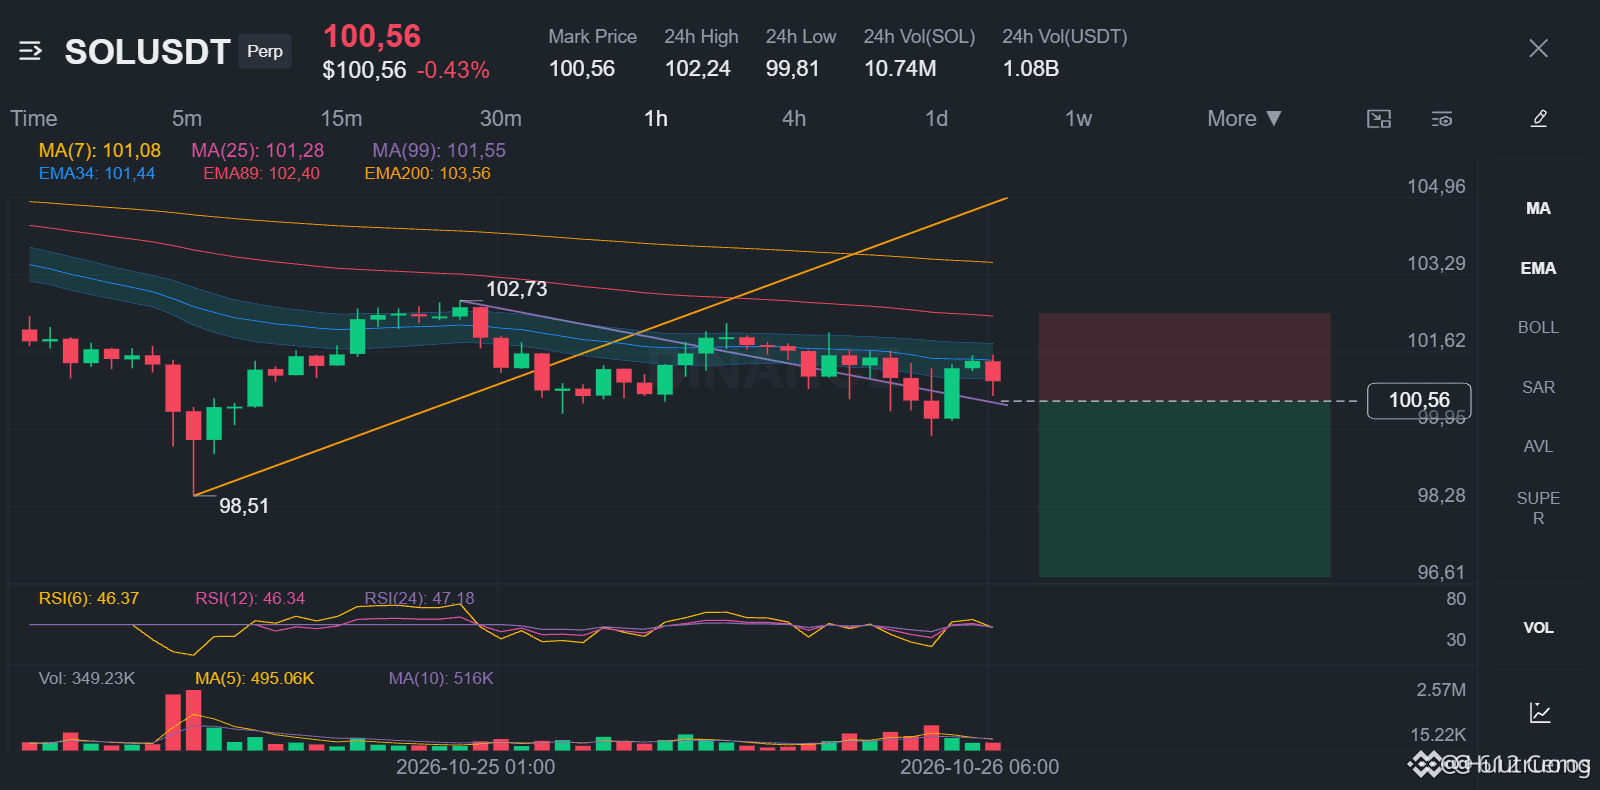
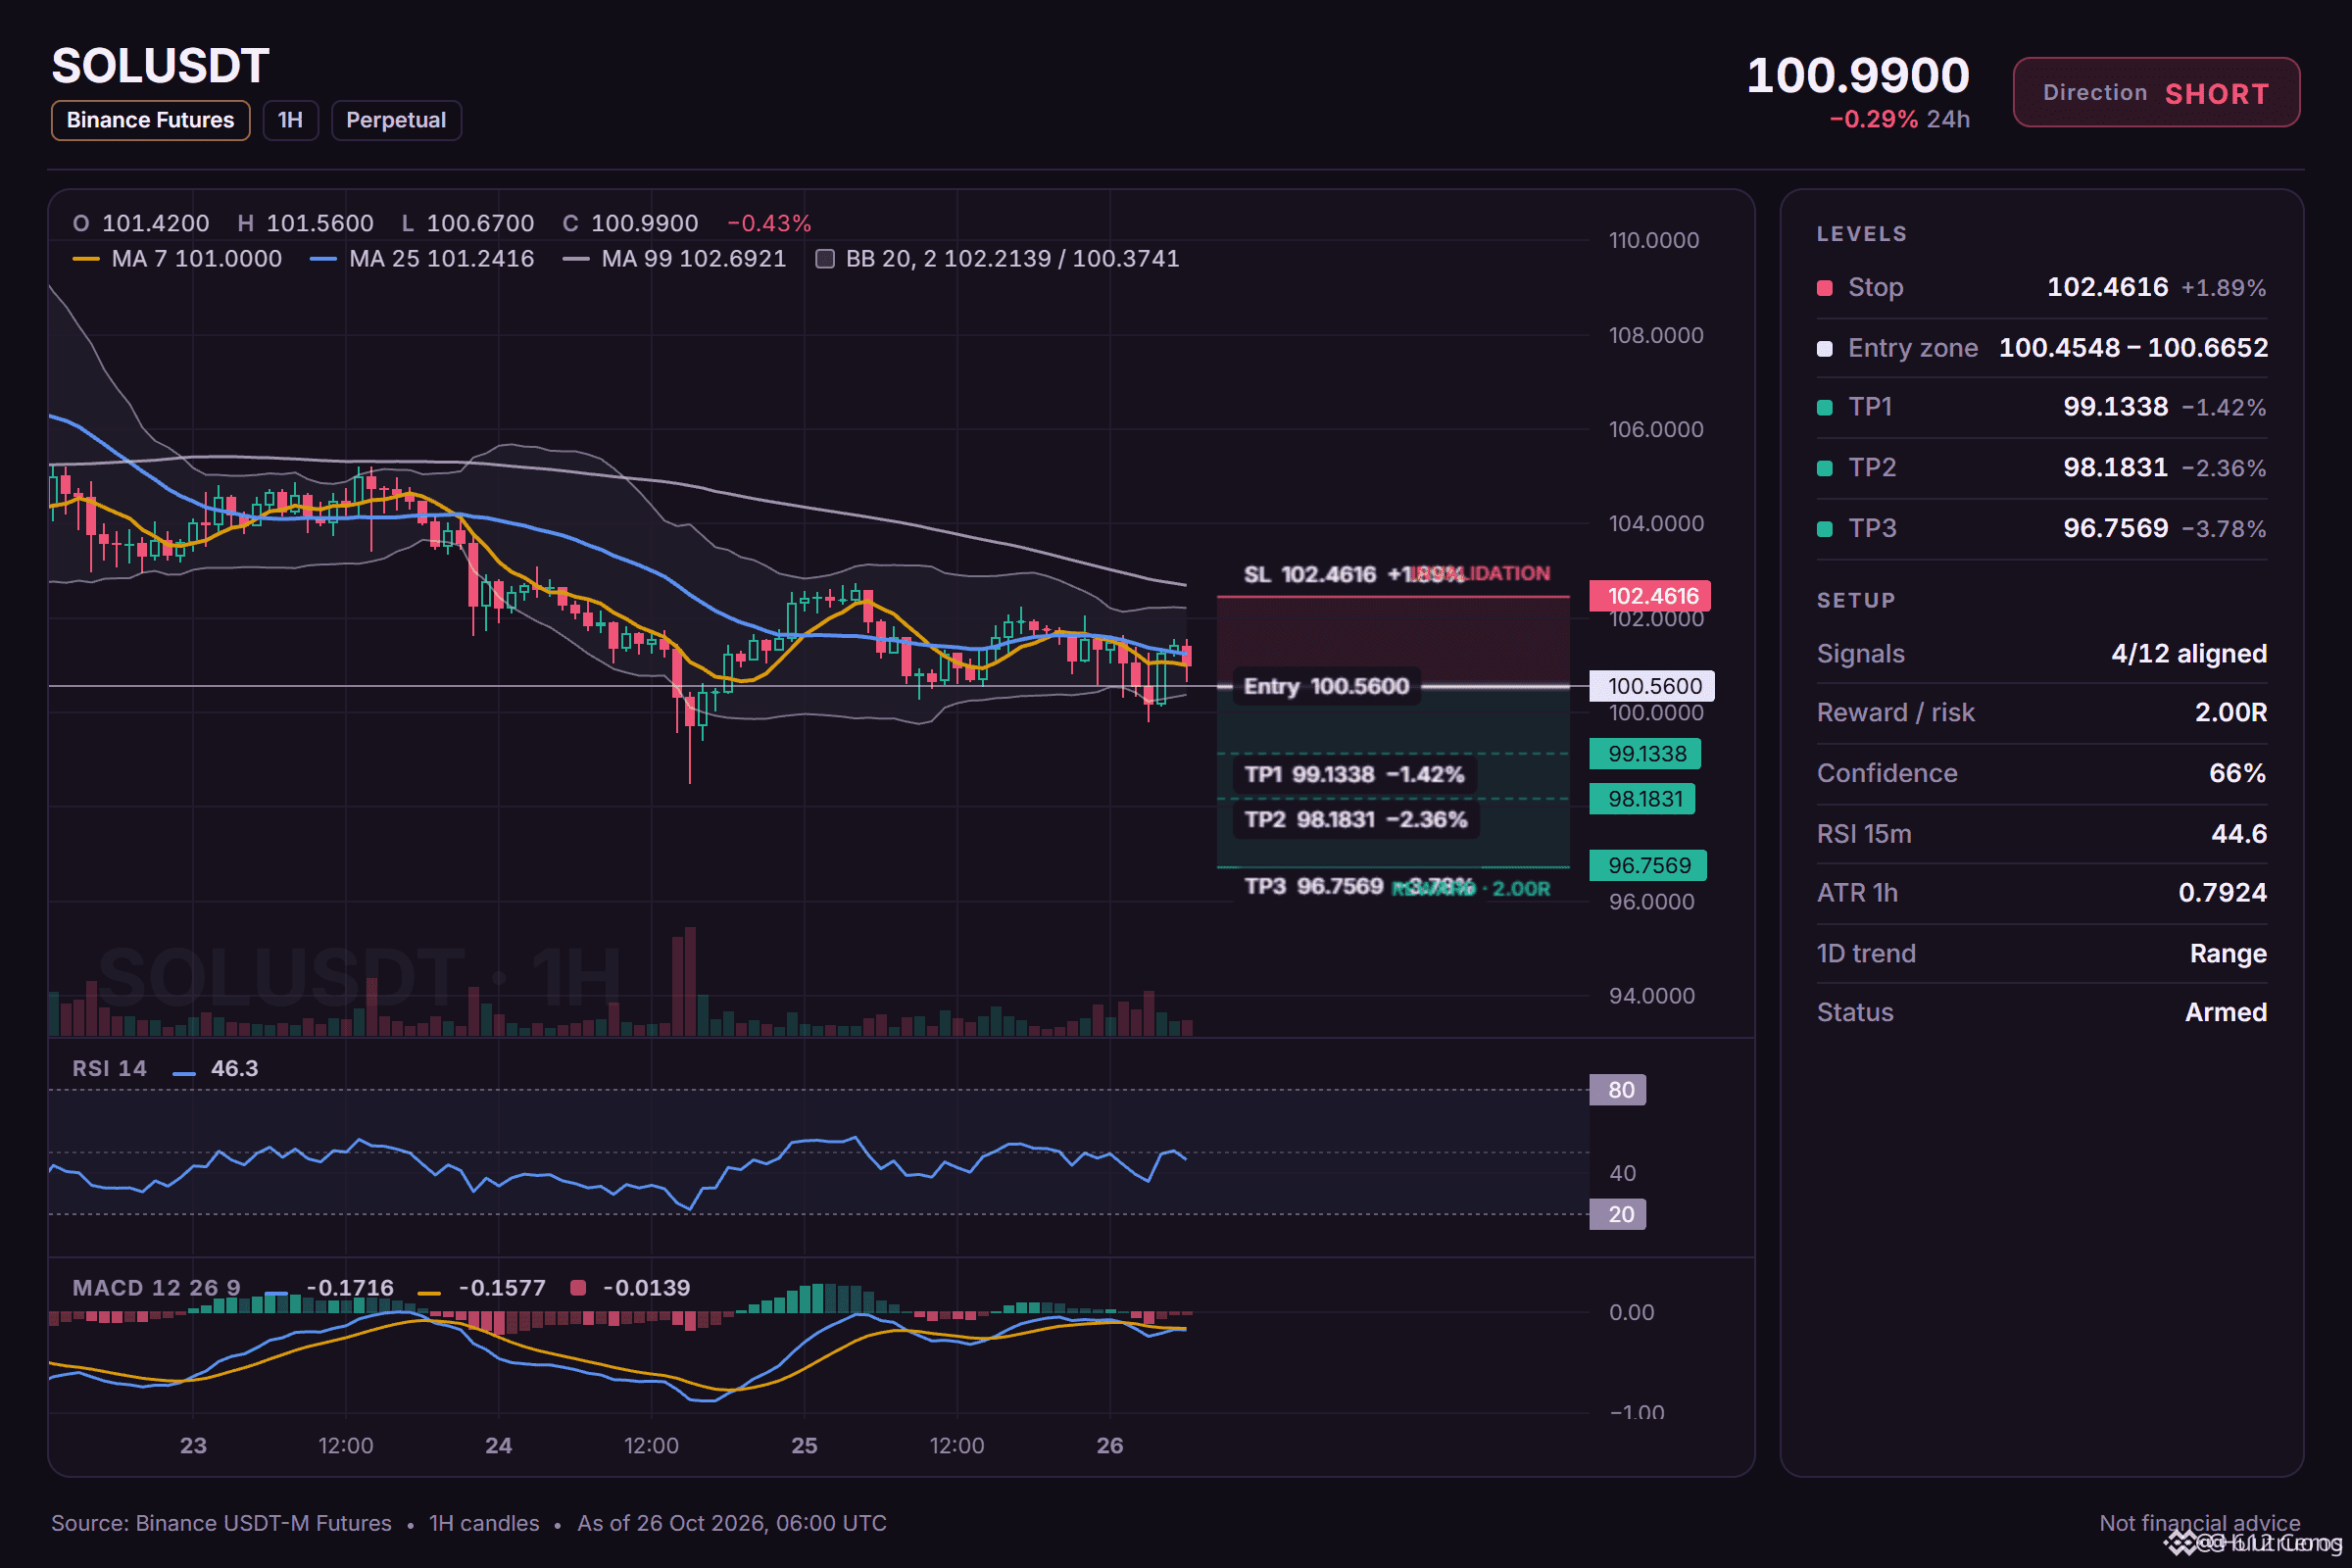
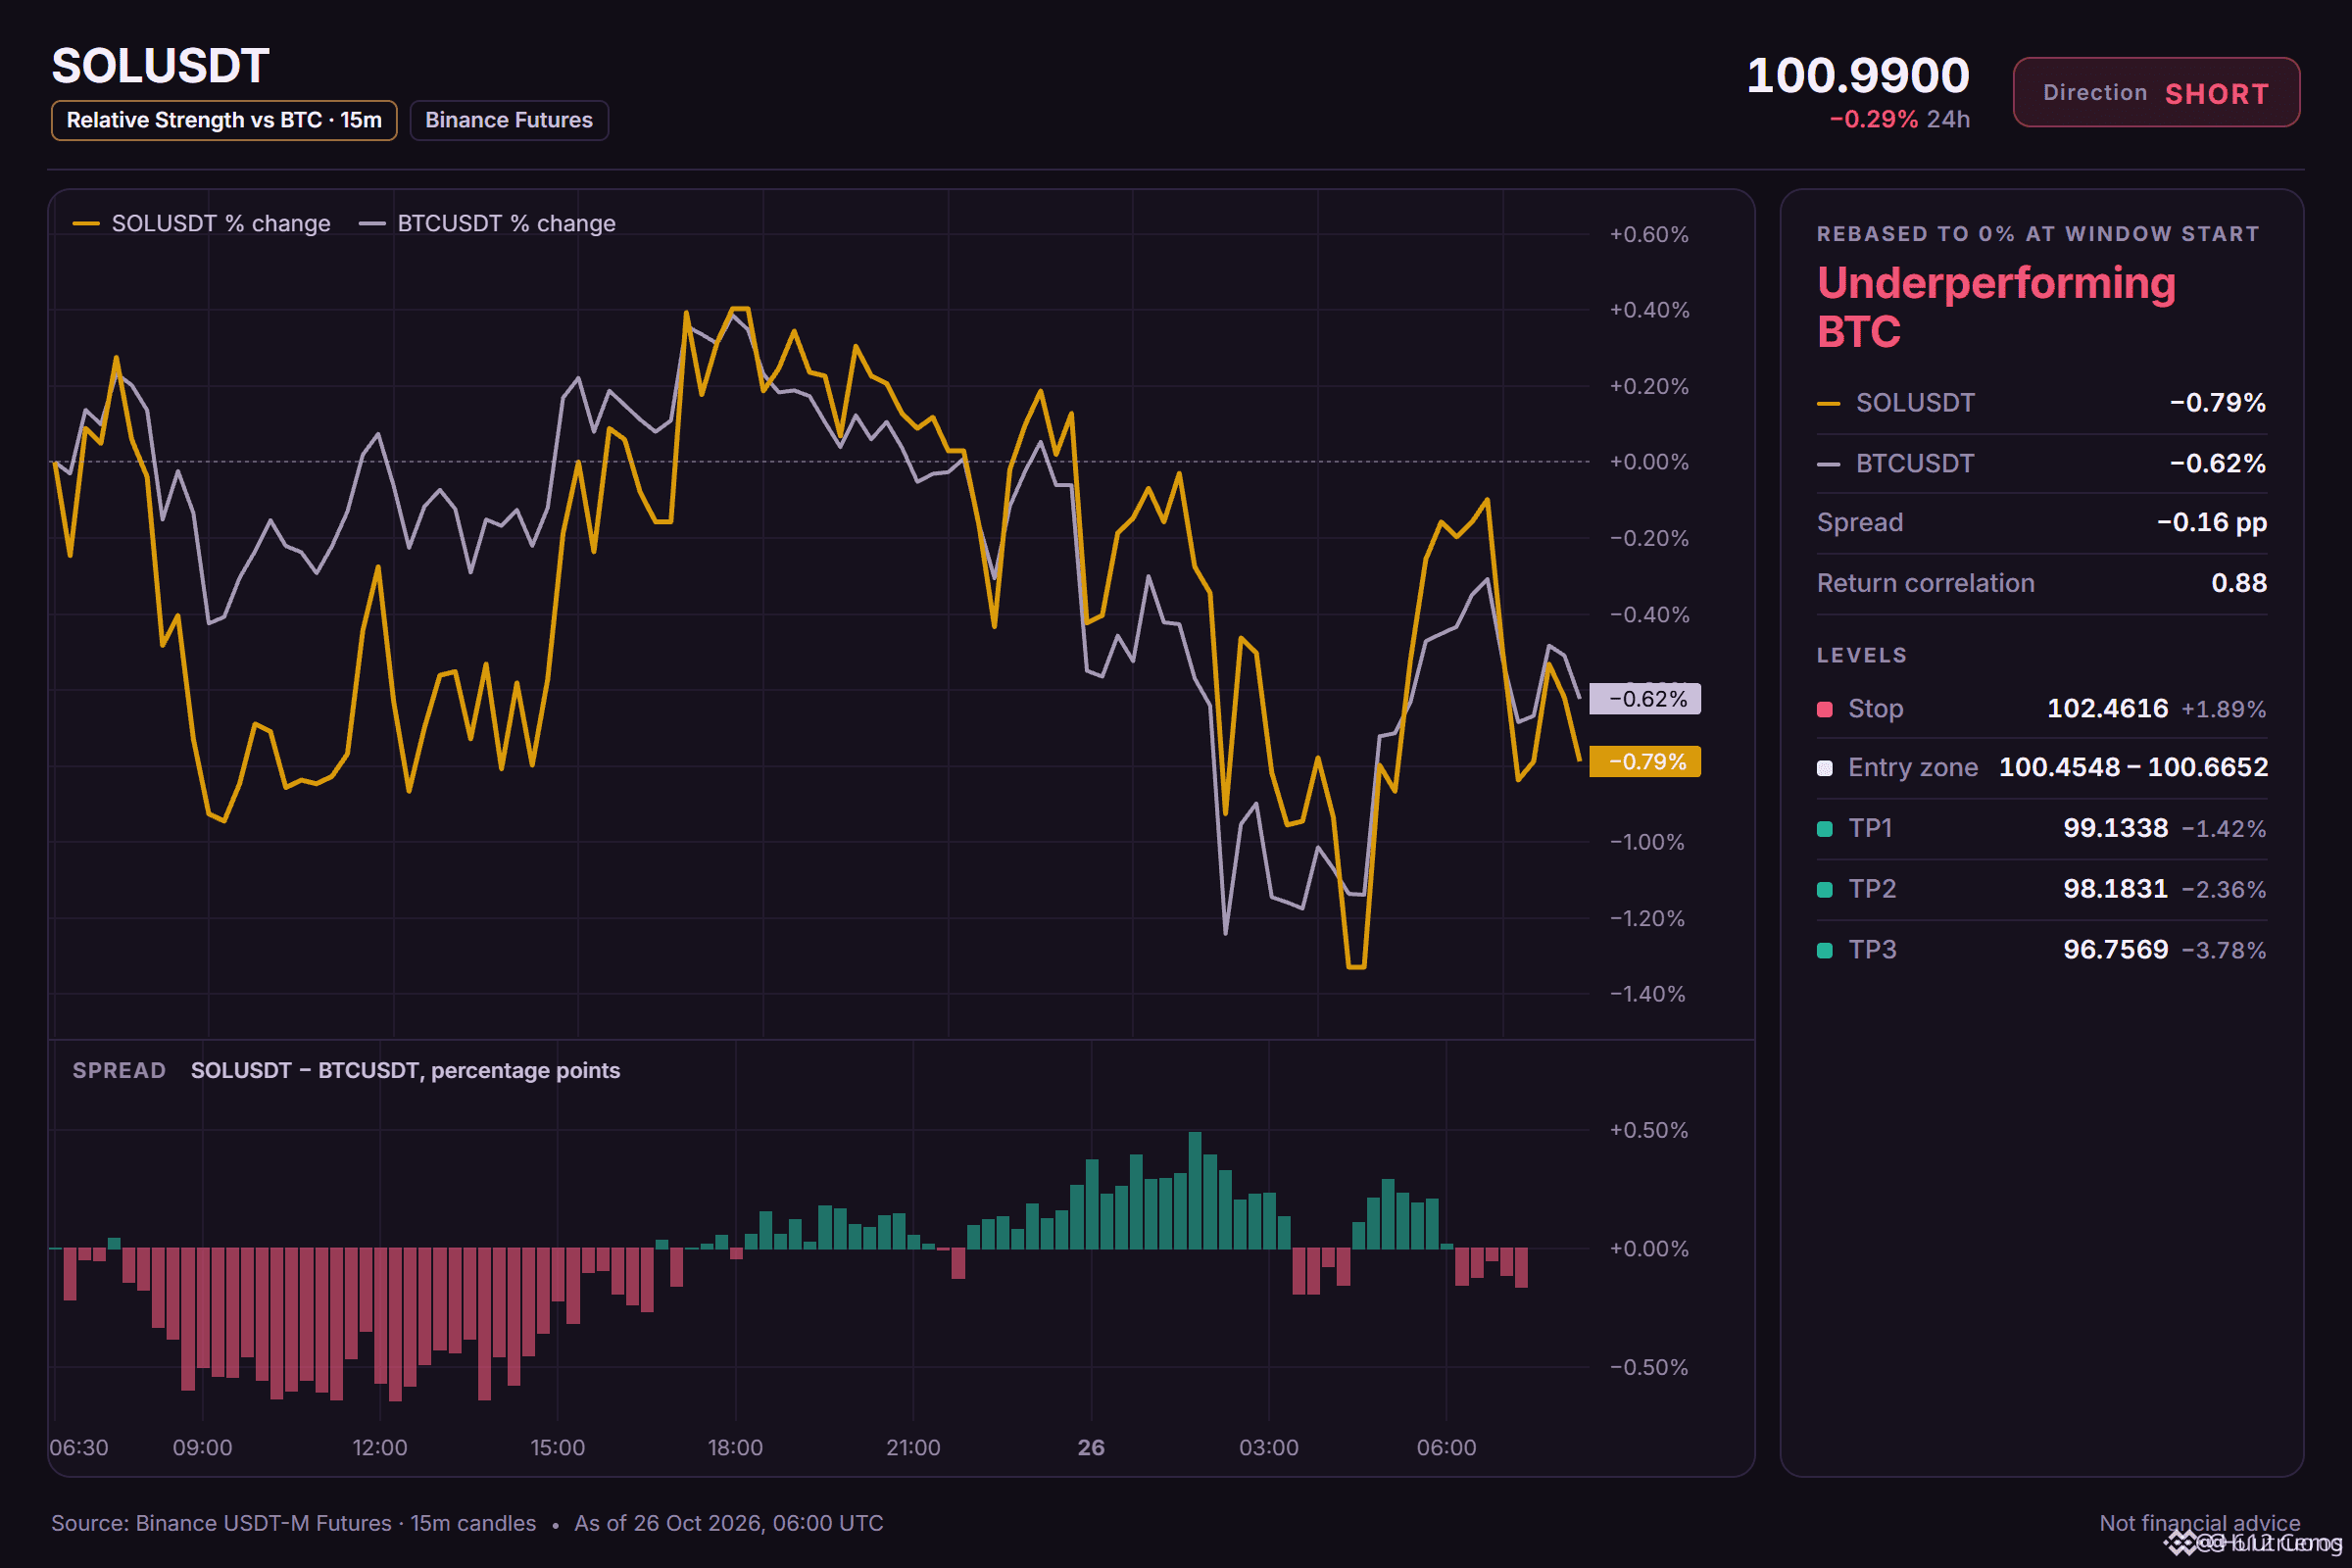
🔴 SHORT $SOL /USDT: expecting price to go DOWN
Bias: SHORT · Leaning
Entry: 100.4548 – 100.6652
TP1: 99.1338 (-1.4%)
TP2: 98.1831 (-2.4%)
TP3: 96.7569 (-3.8%)
SL: 102.4616 (+1.9%)
Plan: enter only inside the zone, close 50% at TP1, 25% at TP2, 25% at TP3, and move the stop to entry after TP1.
Note: moderate conviction only, keep size light.
Why SHORT? 4/12 signals agree, 0 against.
• 4h trend down (below EMA50 & EMA200)
• 1h trend down (below EMA50 & EMA200)
• is falling, this coin follows (corr 0.89)
Why now?
is trading below both the 1h and 4h EMA stacks, confirming the short-term trend is down. The 1h price is 100.5600, and RSI at 44.62 shows sellers have momentum. This is a leaning short with conviction, not a strong signal.
Where is your invalidation level for this trade?
8
·
--
Em Alta
Ver tradução
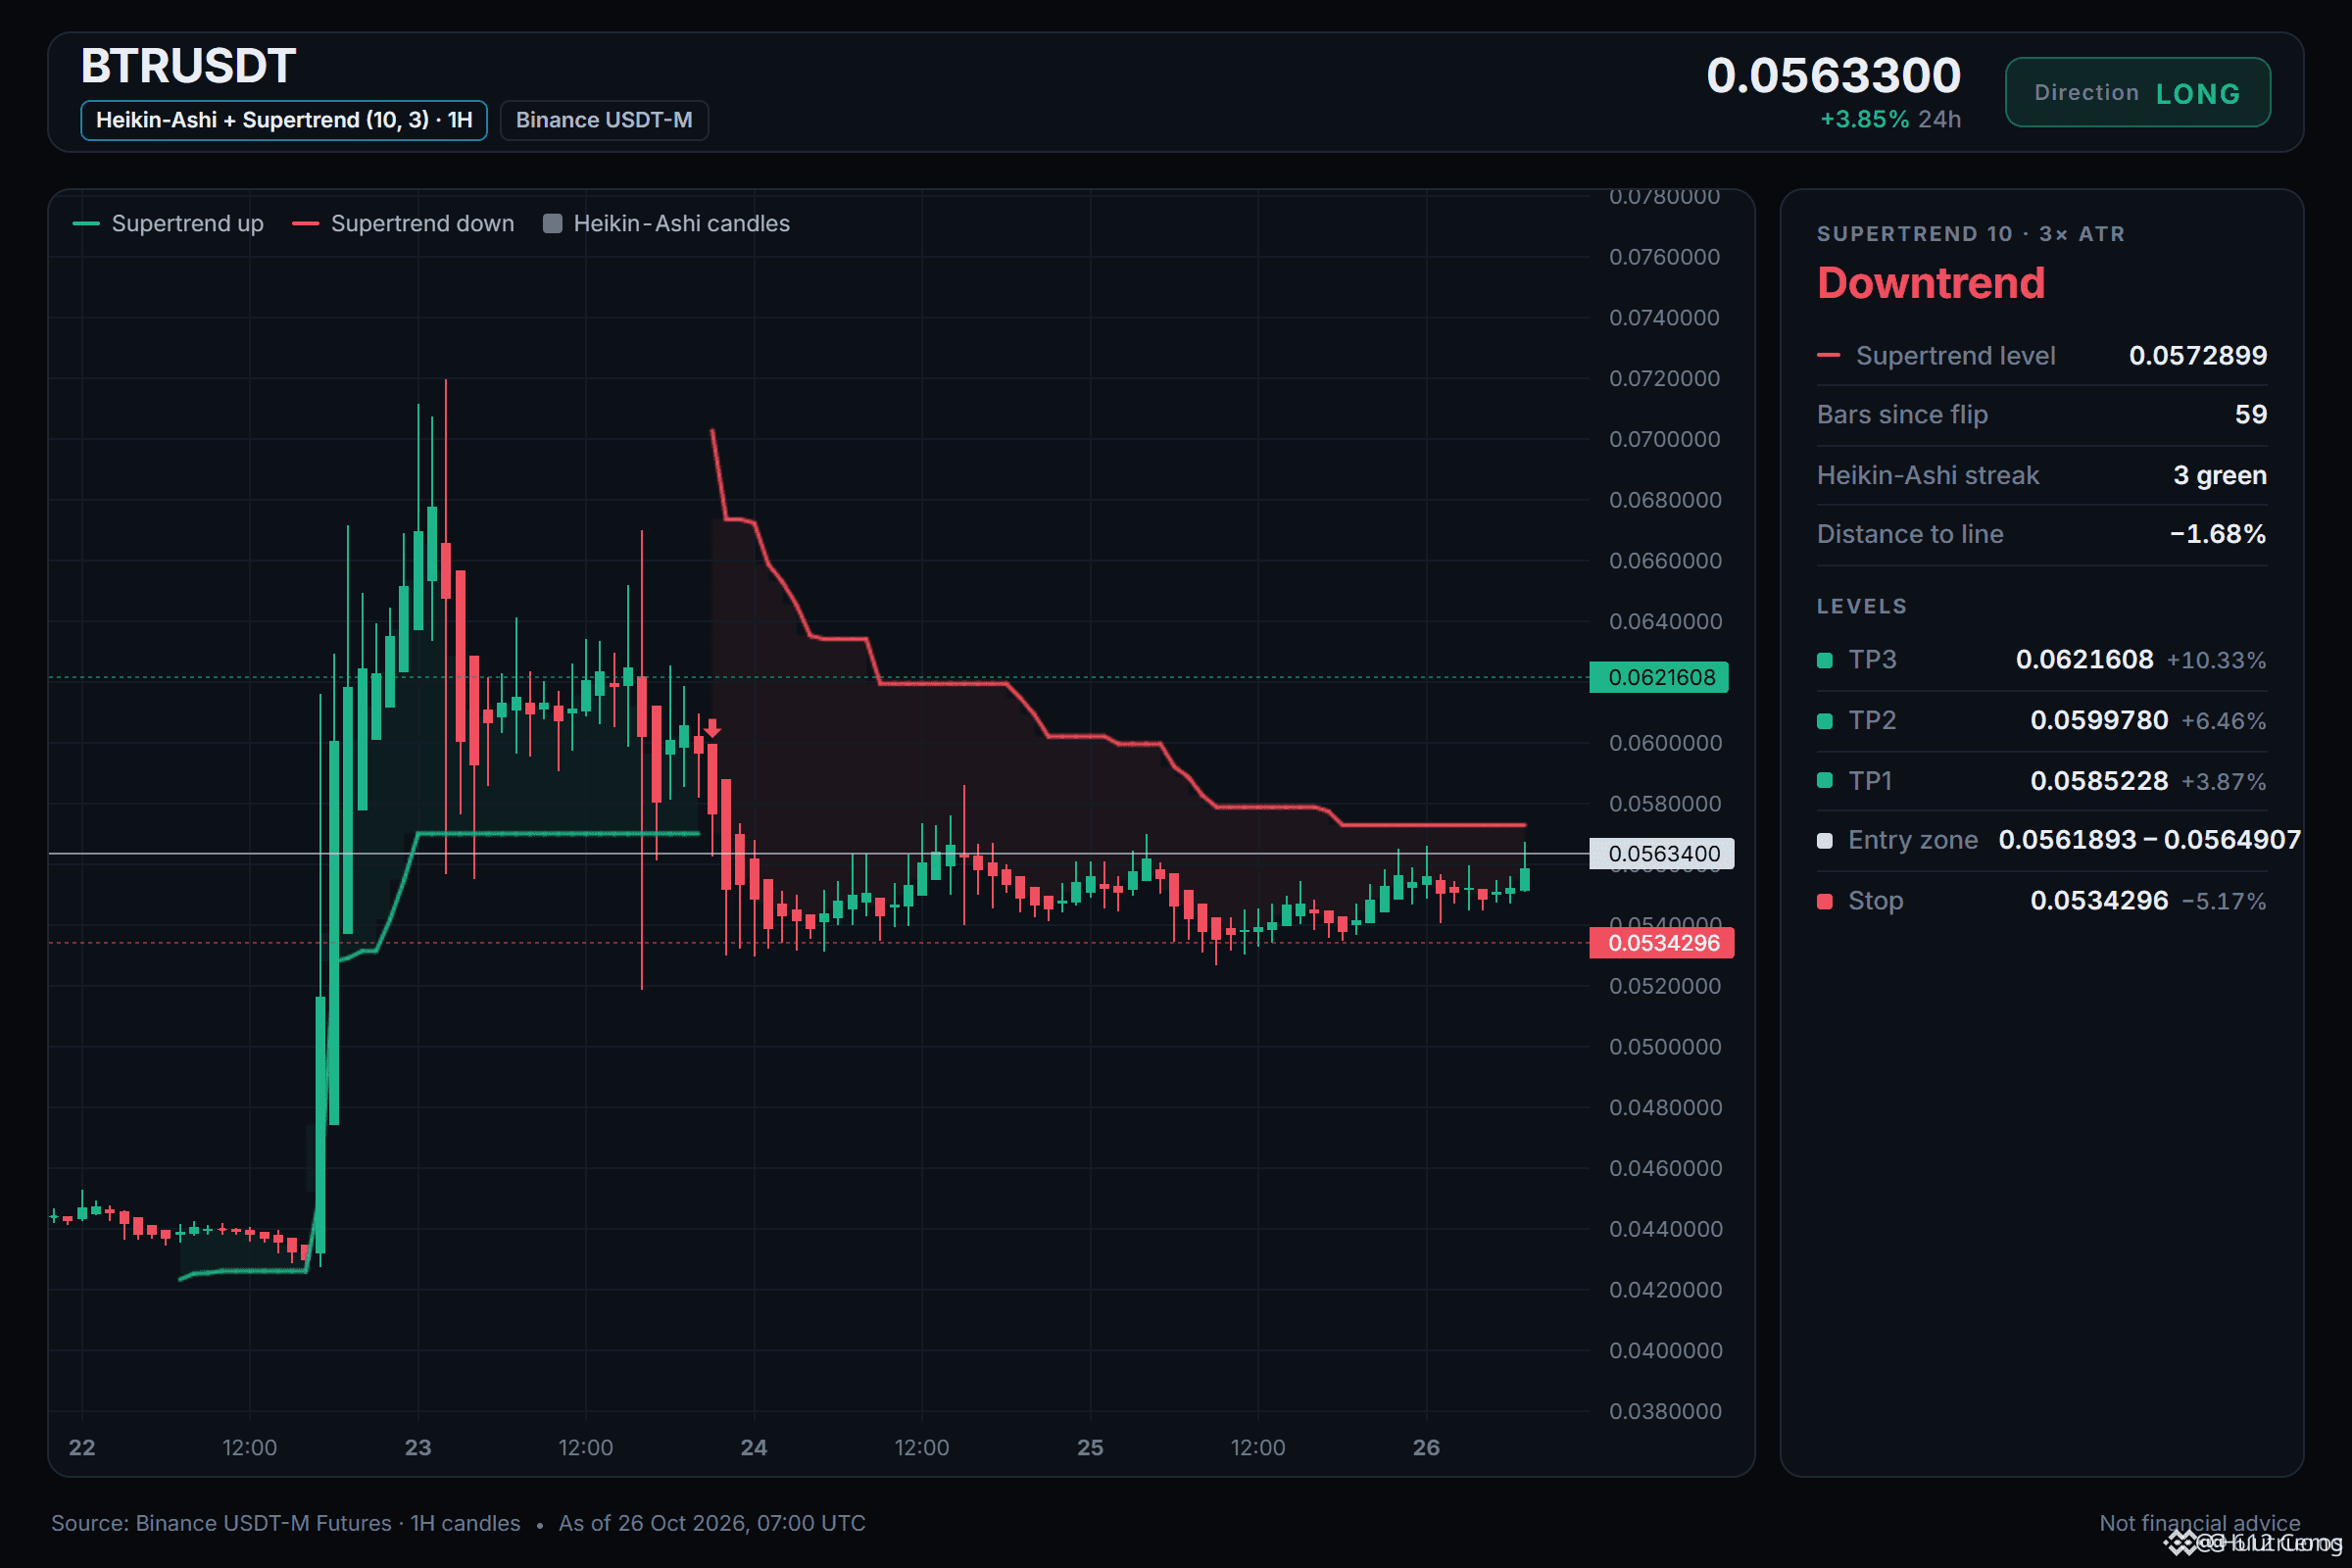
Is BTR actually trending up or just noisy
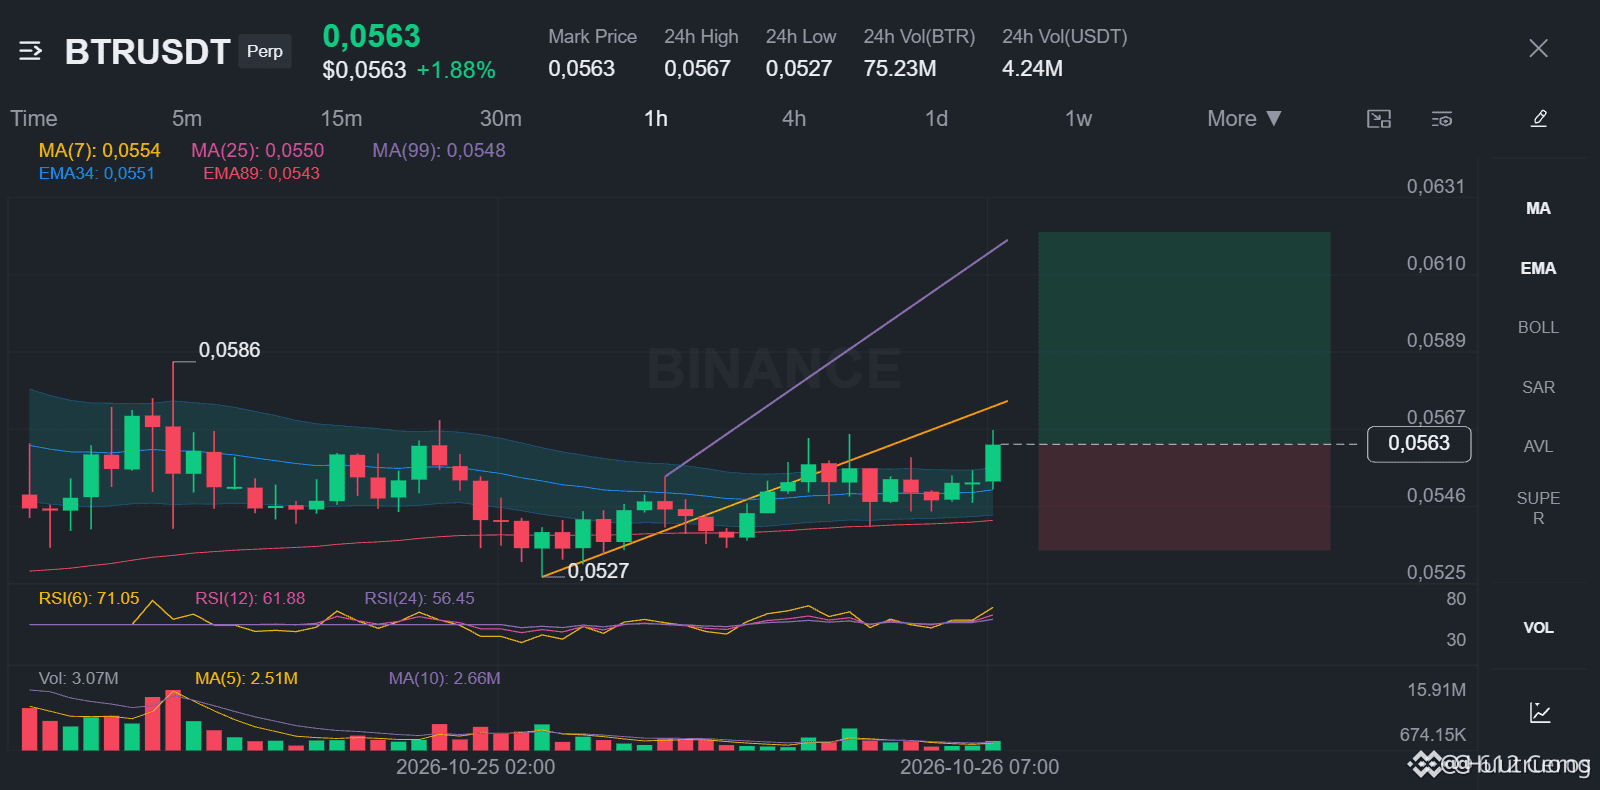
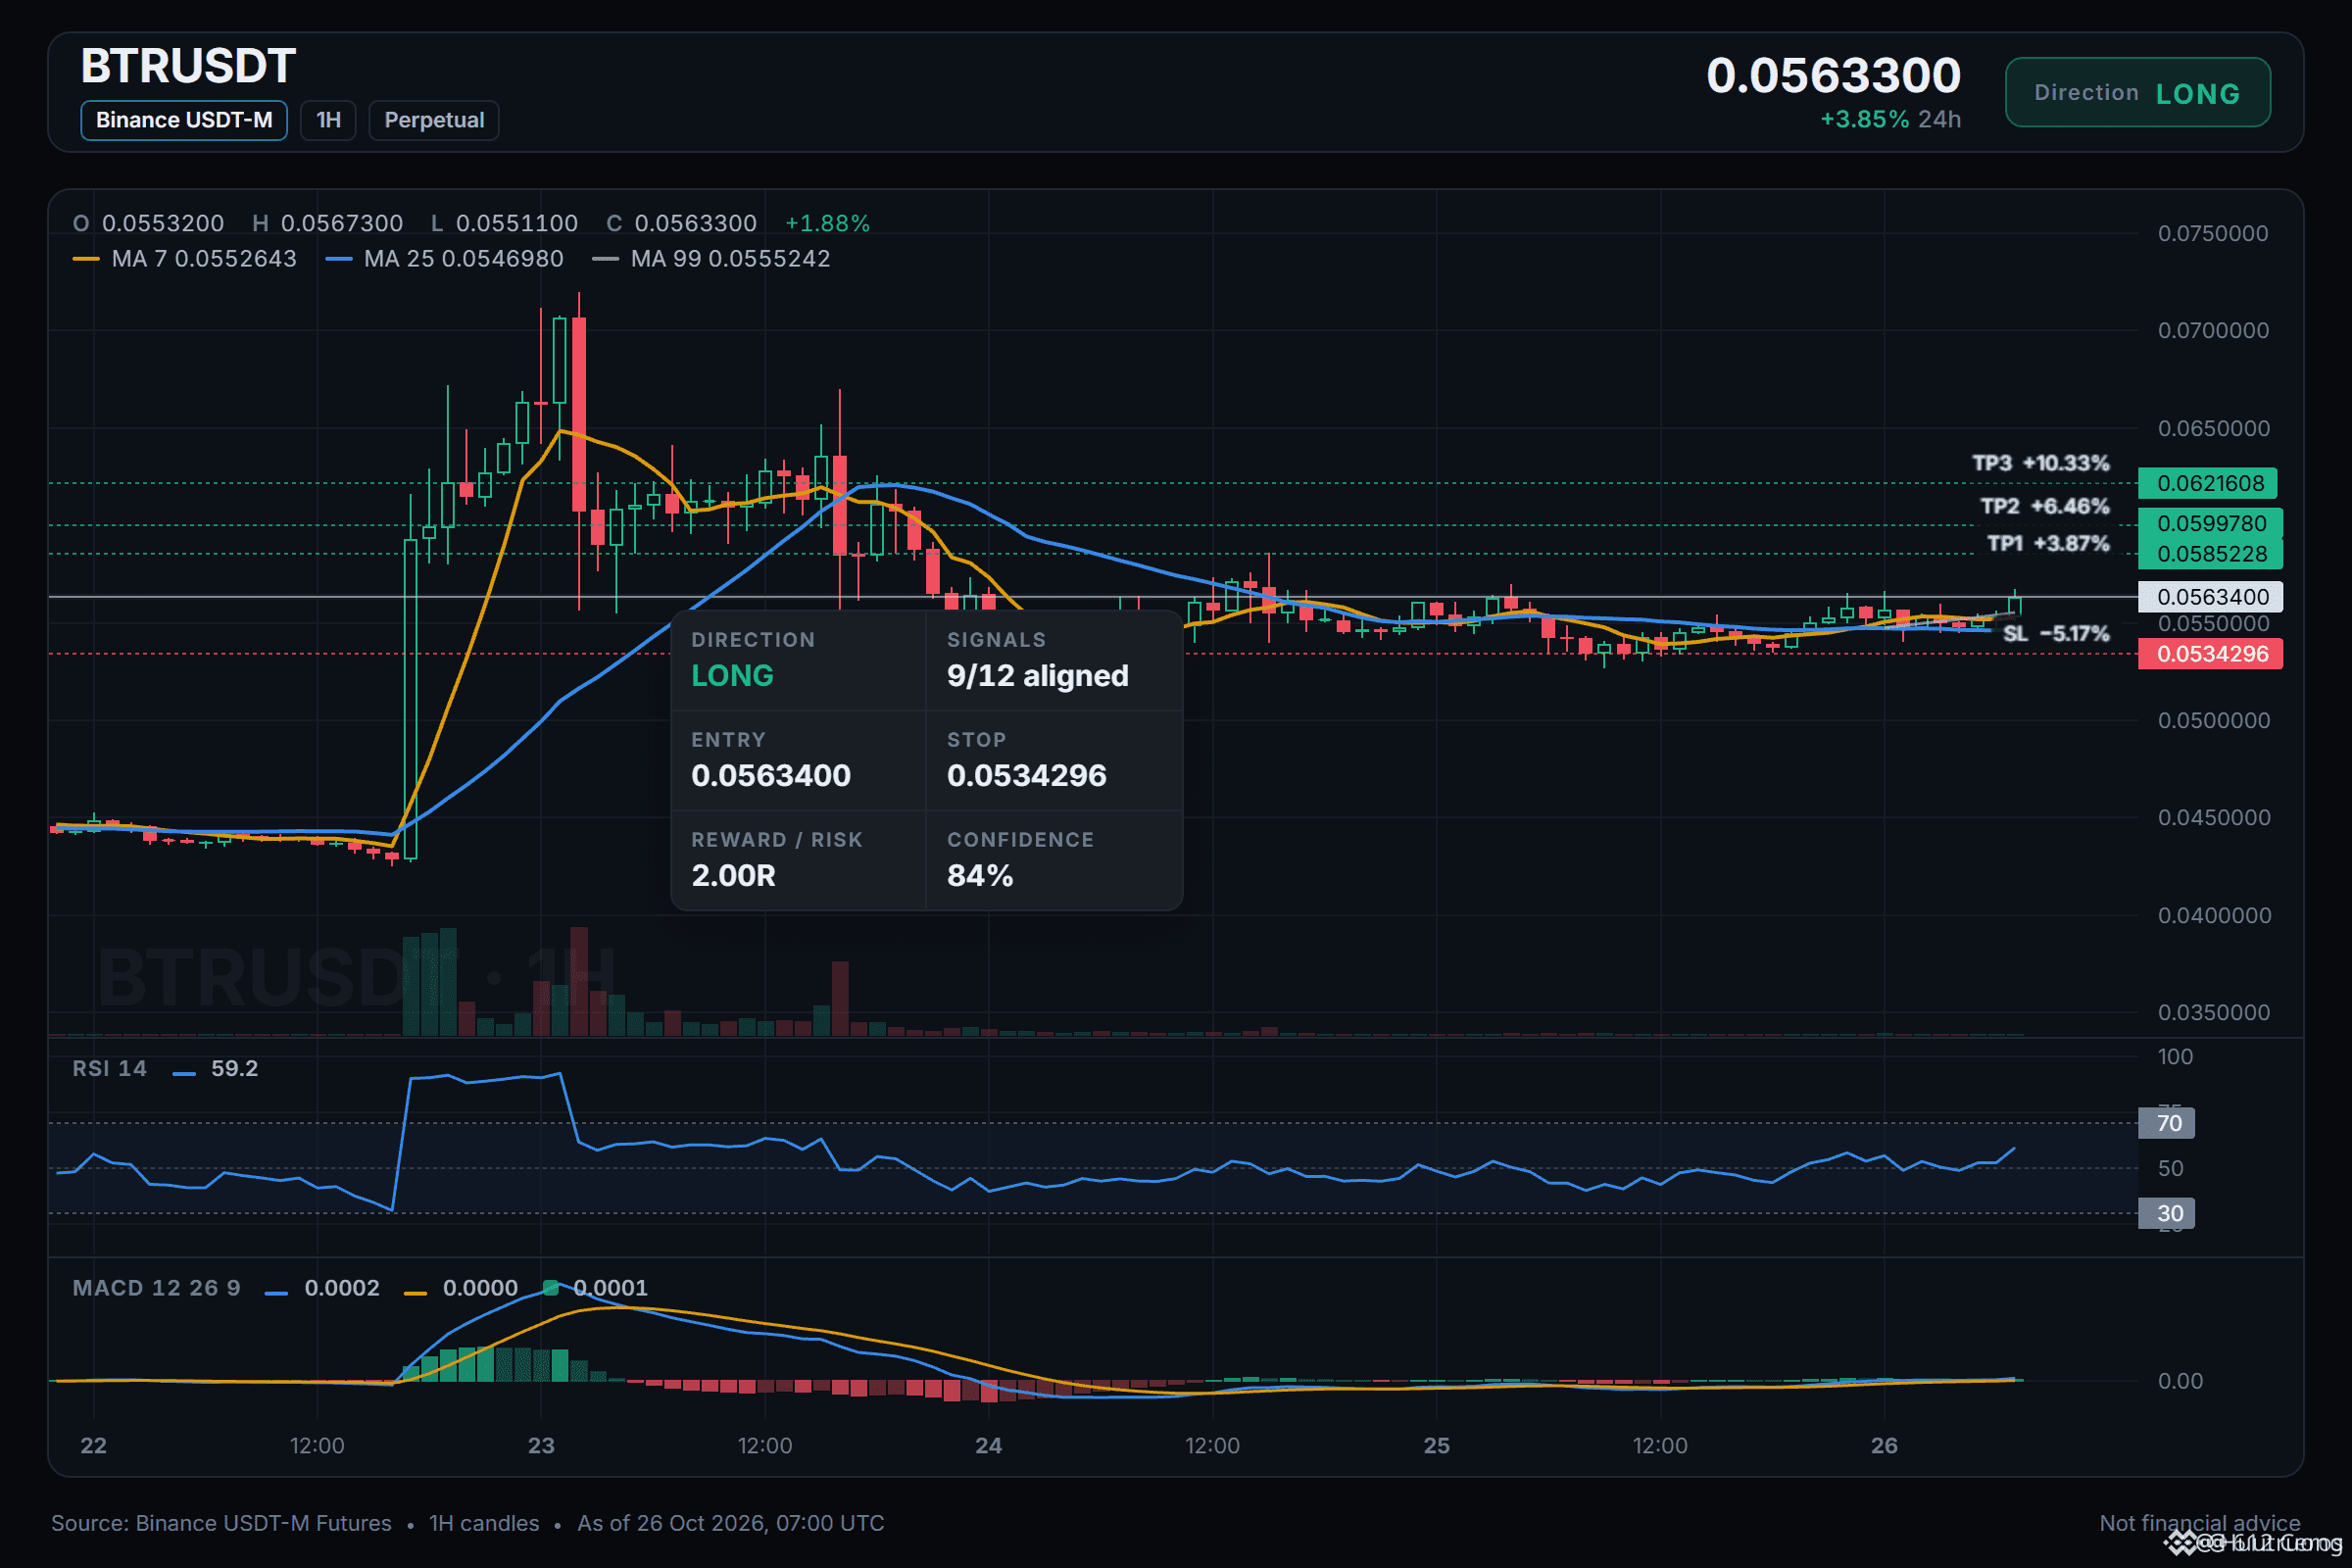
🟢 LONG $BTR /USDT: expecting price to go UP
Bias: LONG · Strong
Entry: 0.0561893 – 0.0564907
TP1: 0.0585228 (+3.9%)
TP2: 0.0599780 (+6.5%)
TP3: 0.0621608 (+10.3%)
SL: 0.0534296 (-5.2%)
Plan: enter only inside the zone, close 50% at TP1, 25% at TP2, 25% at TP3, and move the stop to entry after TP1.
Why LONG? 9/12 signals agree, 0 against.
• Daily trend up (above EMA50 & EMA200)
• 4h trend up (above EMA50 & EMA200)
• 1h trend up (above EMA50 & EMA200)
Q: Why go long when RSI is already 64.4?
A: The 1h RSI is 64.4, meaning buyers still have room to push.
Q: What if the daily trend reverses and traps longs?
A: The daily trend is bullish with price above EMA50 and EMA200.
What is your invalidation level for BTR ?
21
·
--
Em Baixa
Ver tradução
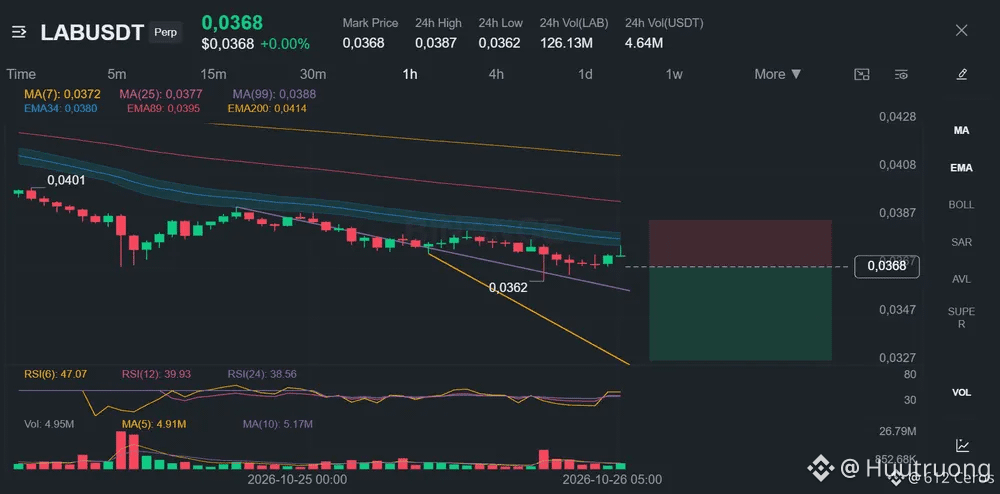
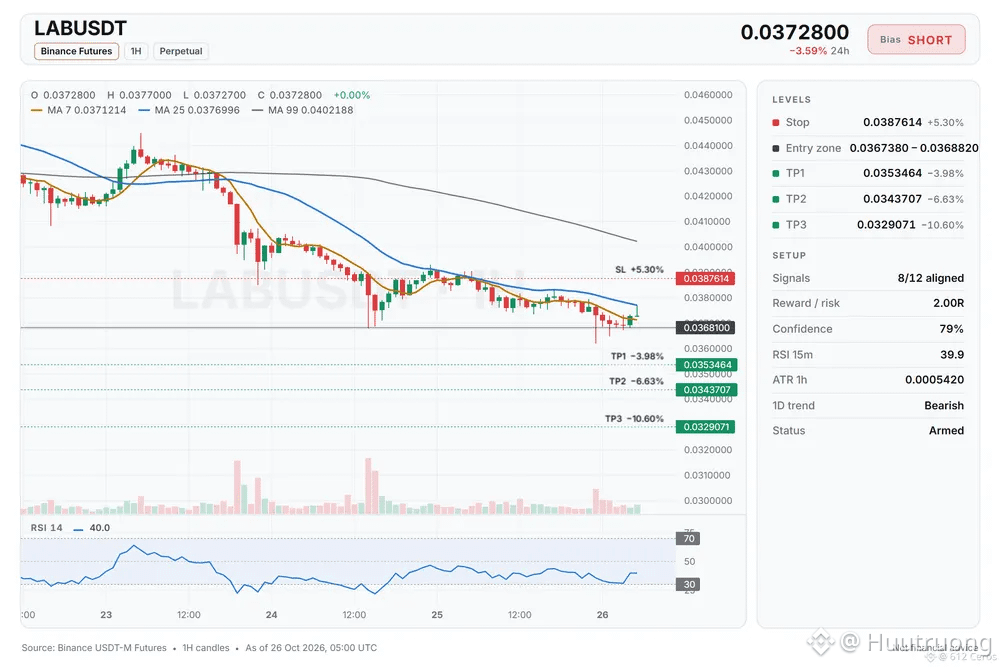
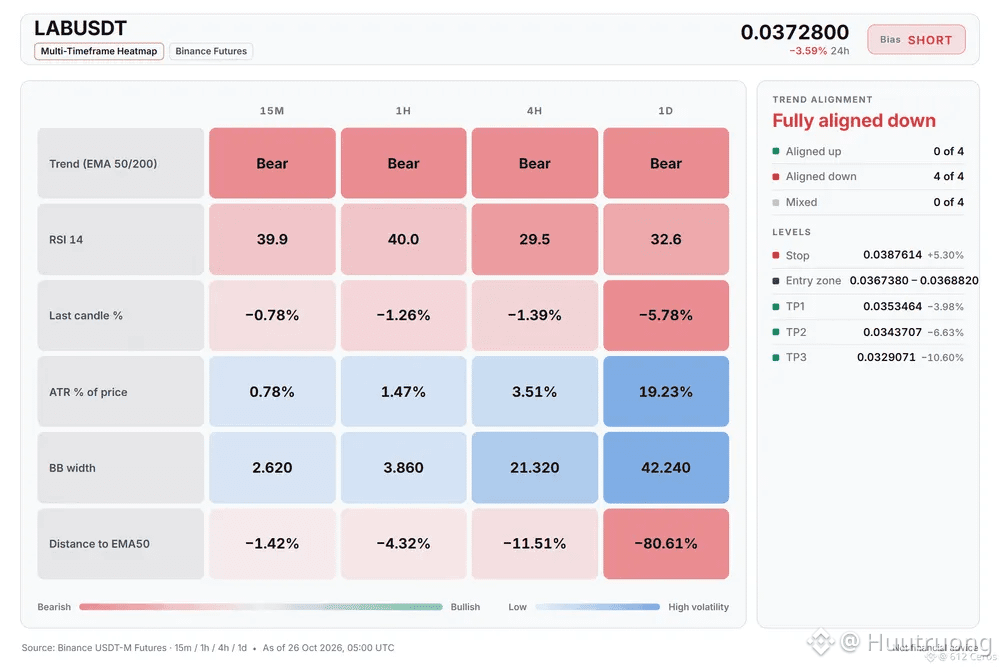
LAB is deep in a bearish stack across every trend
🔴 SHORT $LAB /USDT: expecting price to go DOWN
Bias: SHORT · Strong
Entry: 0.0367380 – 0.0368820
TP1: 0.0353464 (-4.0%)
TP2: 0.0343707 (-6.6%)
TP3: 0.0329071 (-10.6%)
SL: 0.0387614 (+5.3%)
Plan: enter only inside the zone, close 50% at TP1, 25% at TP2, 25% at TP3, and move the stop to entry after TP1.
Why SHORT? LAB checklist: 8/12 agree, 1 against.
• Daily trend down (below EMA50 & EMA200)
• 4h trend down (below EMA50 & EMA200)
• 1h trend down (below EMA50 & EMA200)
Watch: Far below its average, bounce likely (−3.1 ATR from 1h EMA50)
Watch: The idea is wrong if price reaches the stop at 0.0387614
Bottom line: The daily bearish stack (price below both EMAs) is the strongest sign, but price is 3.1 ATR below the 1h EMA50, which means a bounce is likely
Where is your invalidation level if this short fails?
7
·
--
Em Baixa
Ver tradução
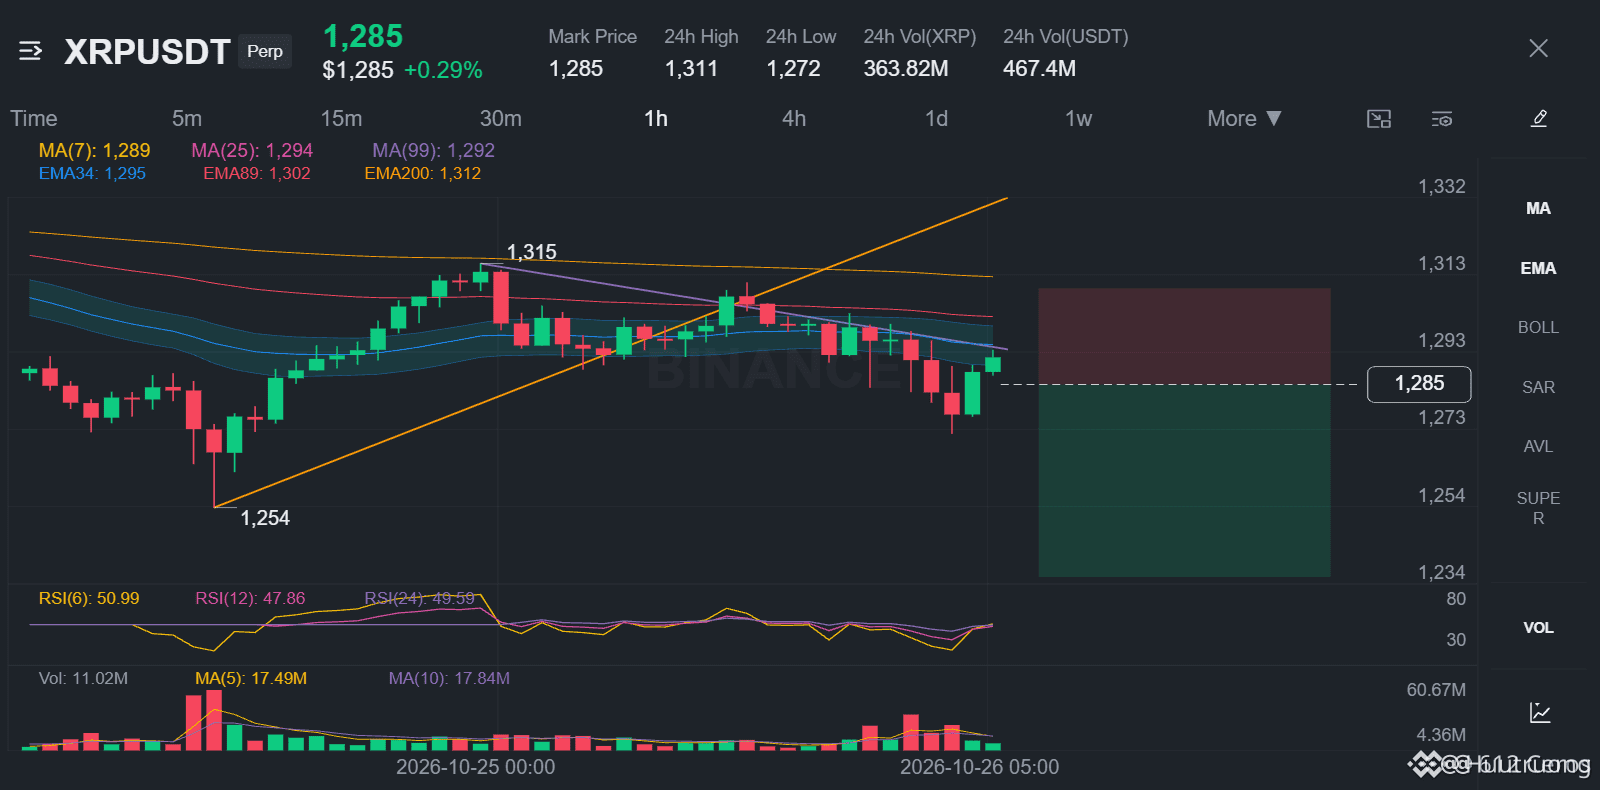
XRP stays below a stacked EMA ribbon on the 4h
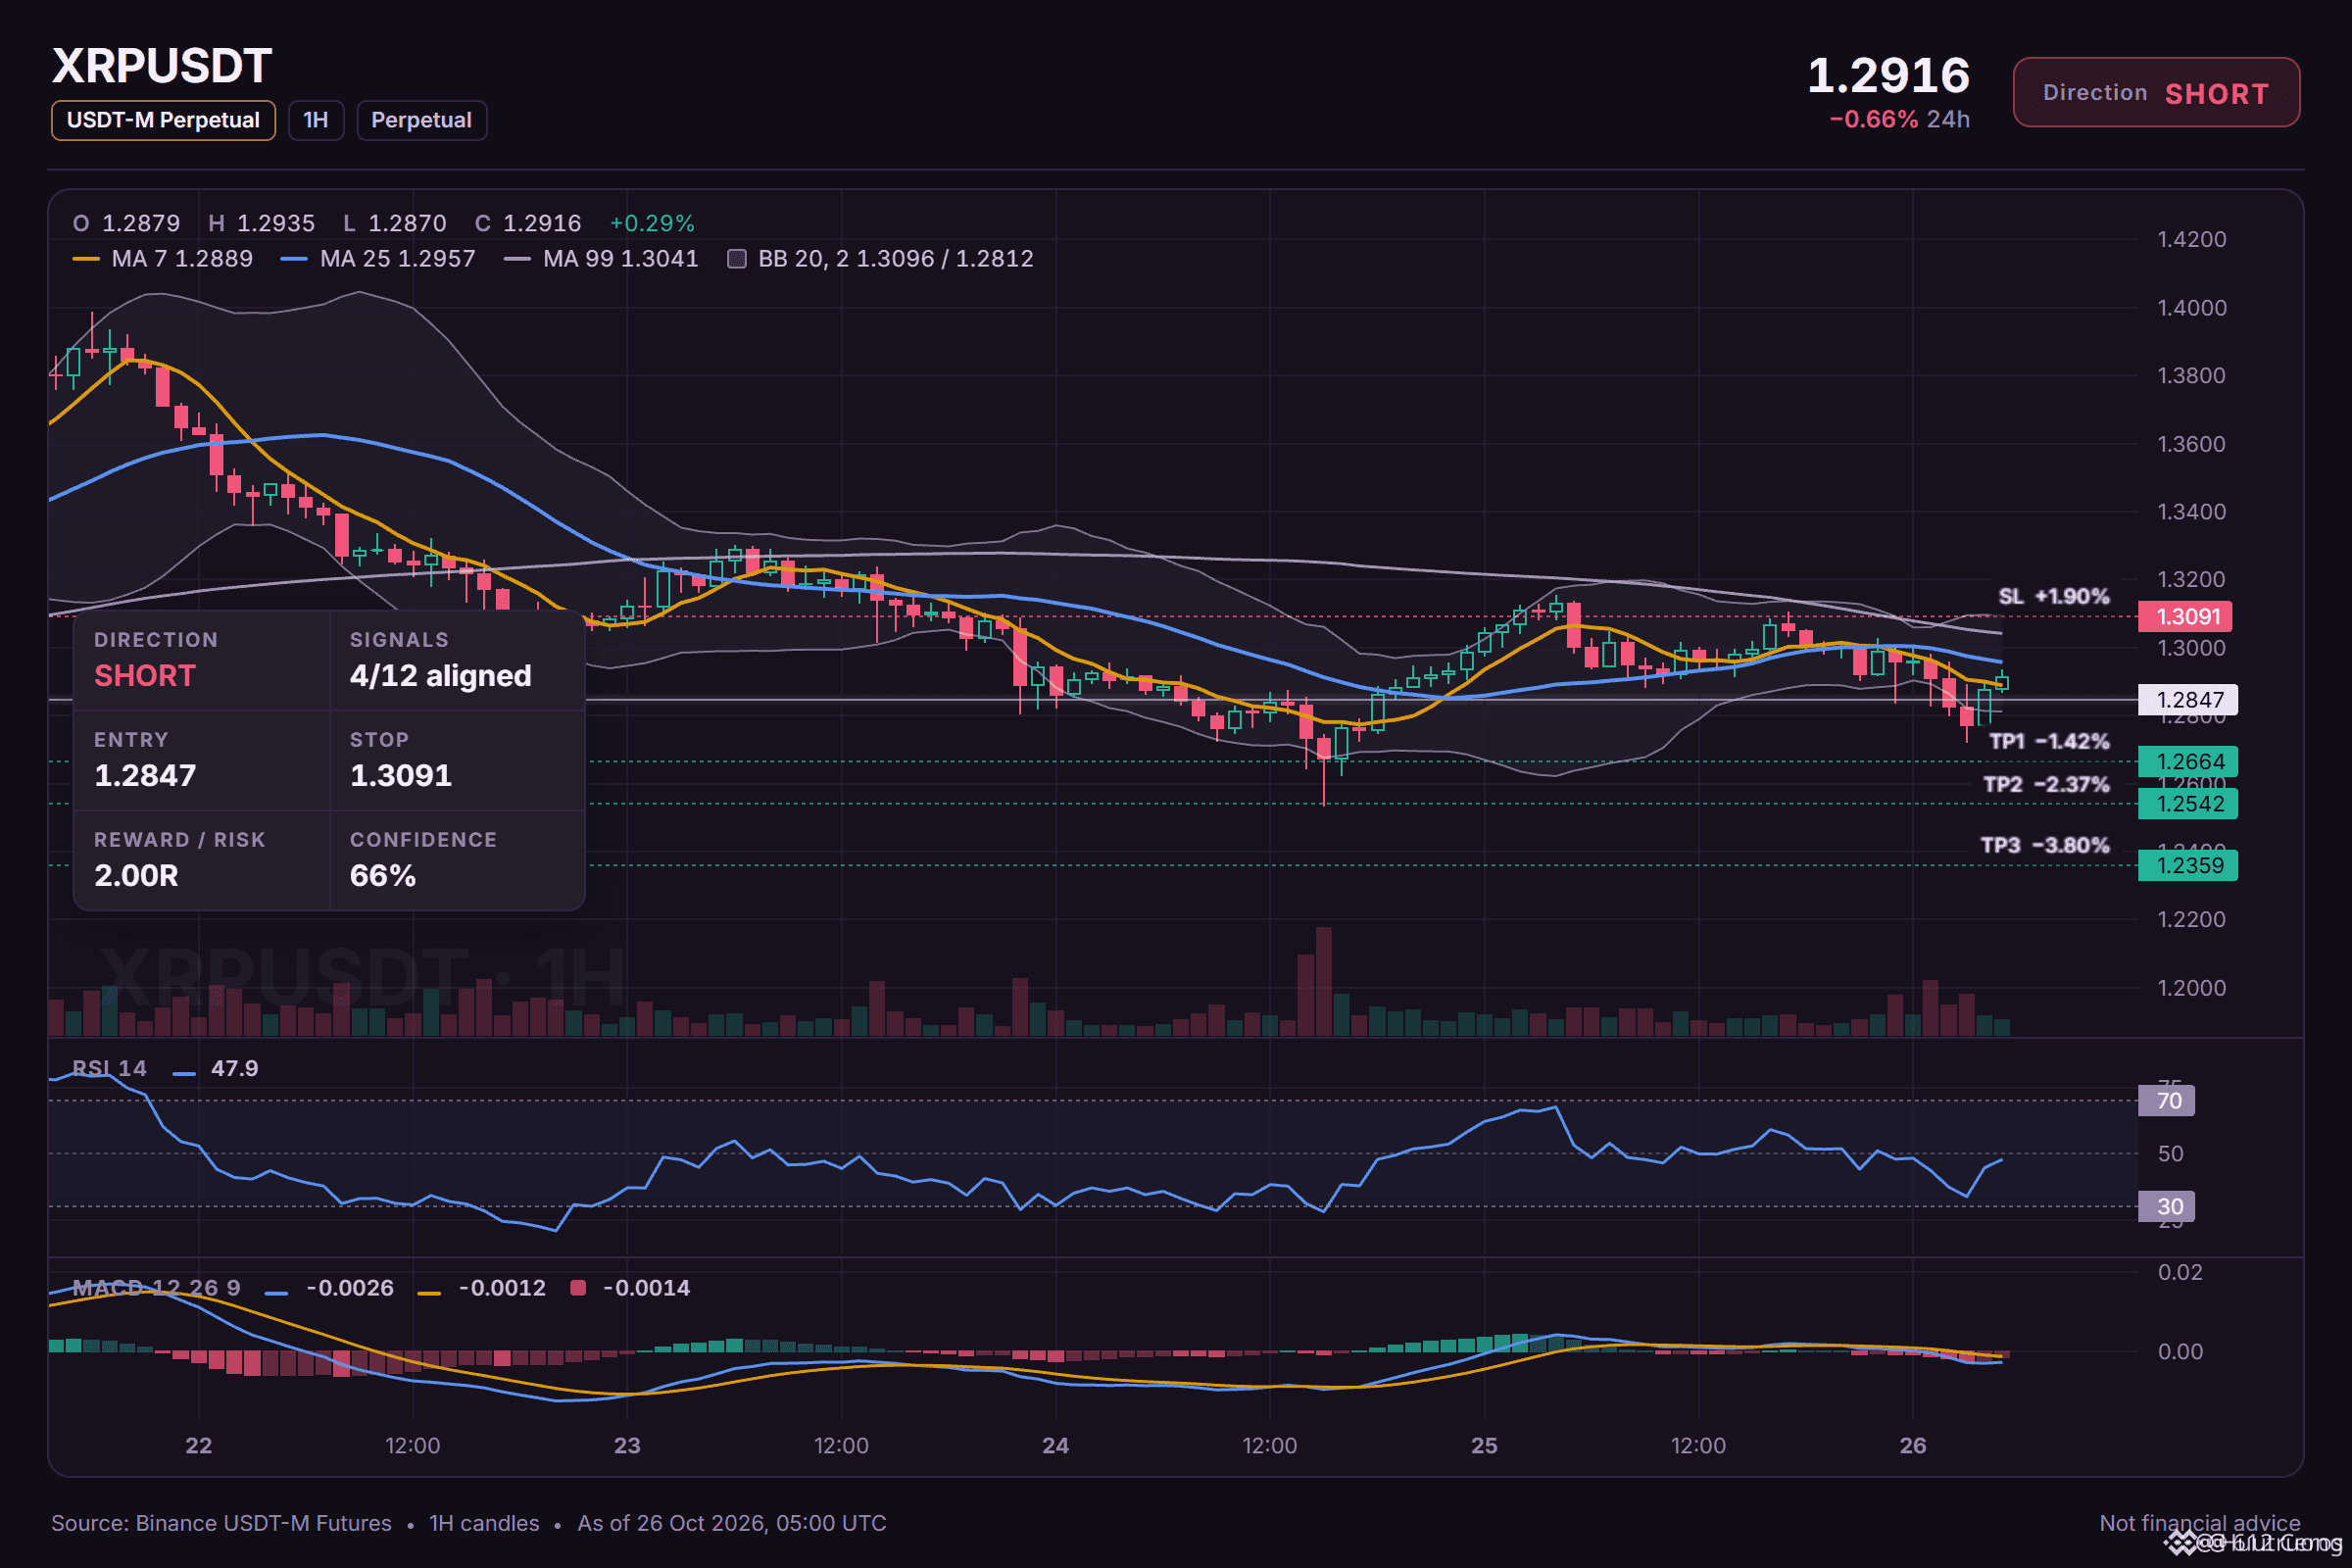
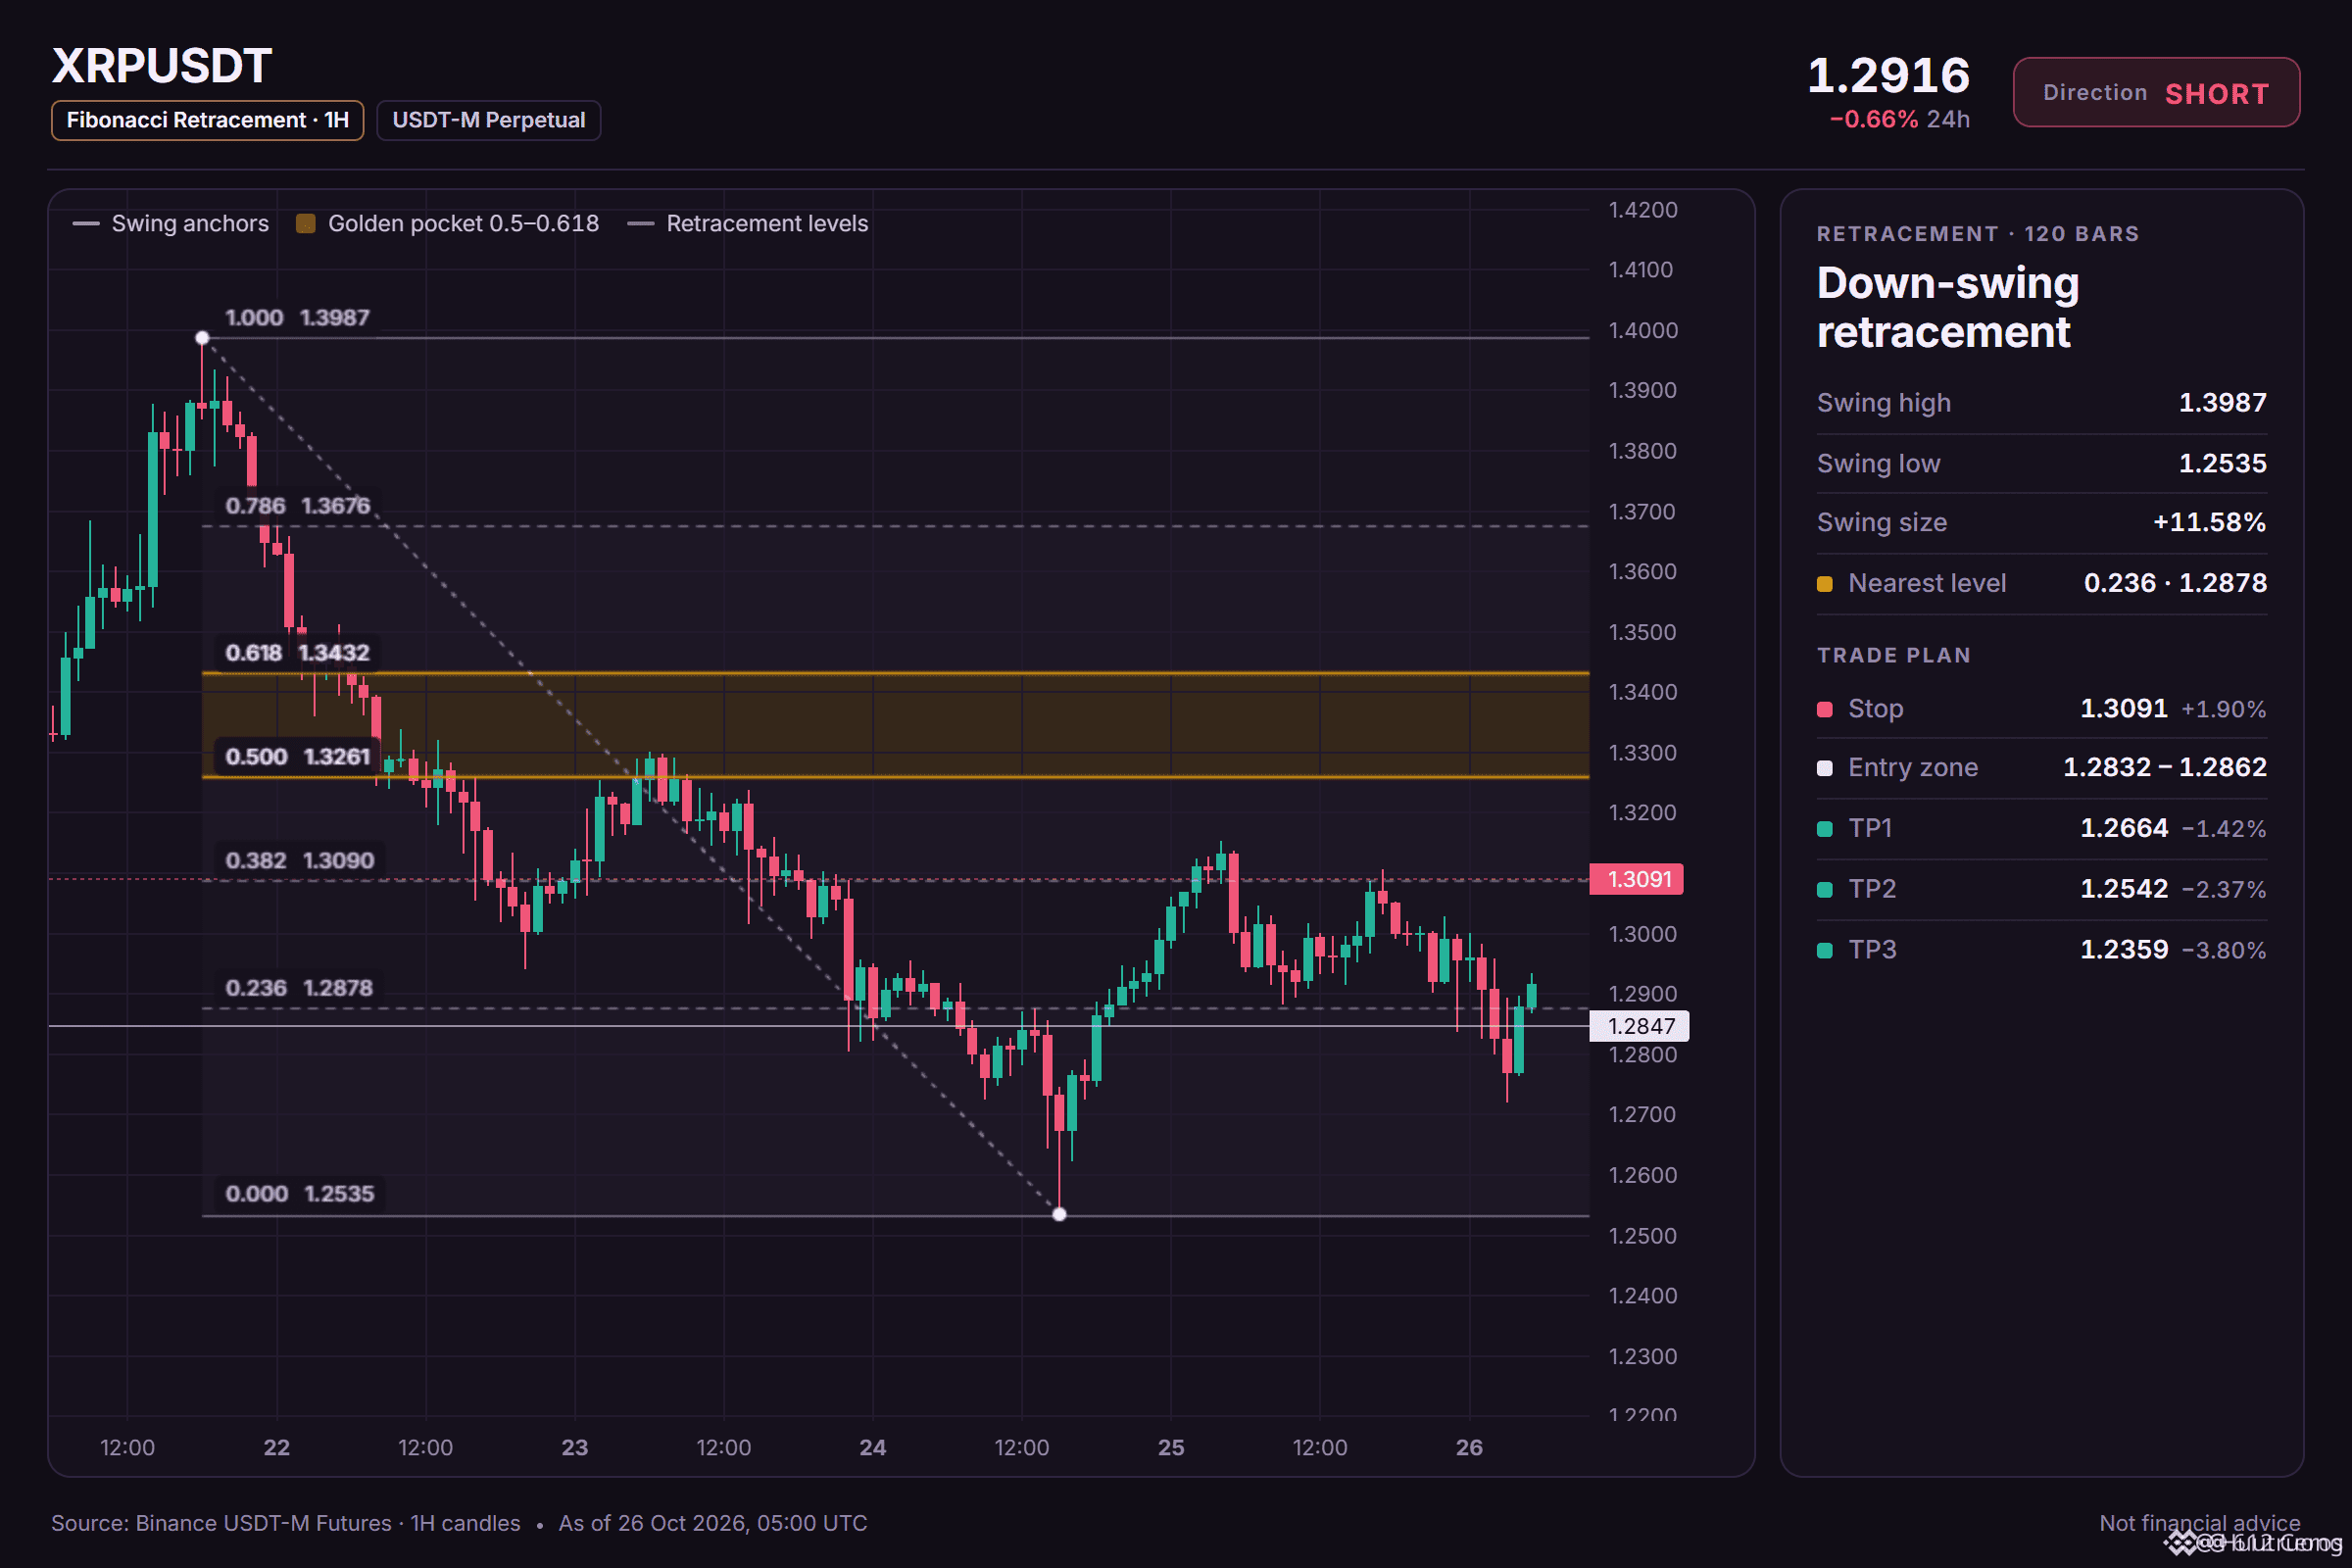
🔴 SHORT $XRP /USDT: expecting price to go DOWN
Bias: SHORT · Leaning
Entry: 1.2832 – 1.2862
TP1: 1.2664 (-1.4%)
TP2: 1.2542 (-2.4%)
TP3: 1.2359 (-3.8%)
SL: 1.3091 (+1.9%)
Plan: enter only inside the zone, close 50% at TP1, 25% at TP2, 25% at TP3, and move the stop to entry after TP1.
Note: moderate conviction only, keep size light.
Why SHORT? 4/12 signals agree, 0 against.
• 4h trend down (below EMA50 & EMA200)
• 1h trend down (below EMA50 & EMA200)
• Sellers are driving the move (15m ADX 25.8)
The short version:
1. the 4h trend shows price below EMA50 and EMA200, a bearish stack suggesting the swing is down.
2. the 1h trend also has price below EMA50 and EMA200, so the short-term trend is down too.
3. the 4h RSI sits at 38.1, bearish momentum below 45, but the daily range makes the move less decisive.
Where would you set your level if you disagreed?
6
·
--
Em Baixa
Ver tradução
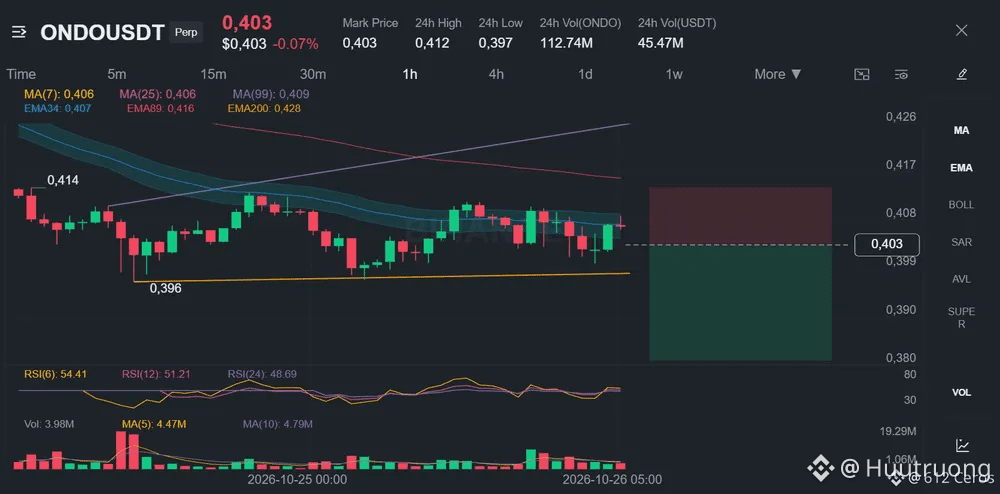
Range-bound coins often trap longs into fading moves.
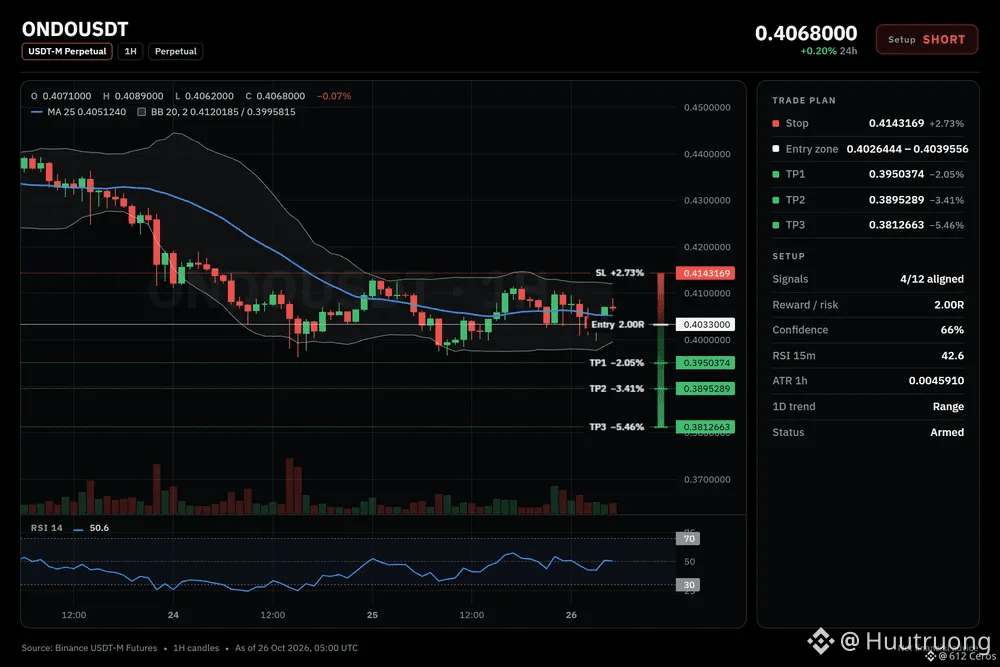
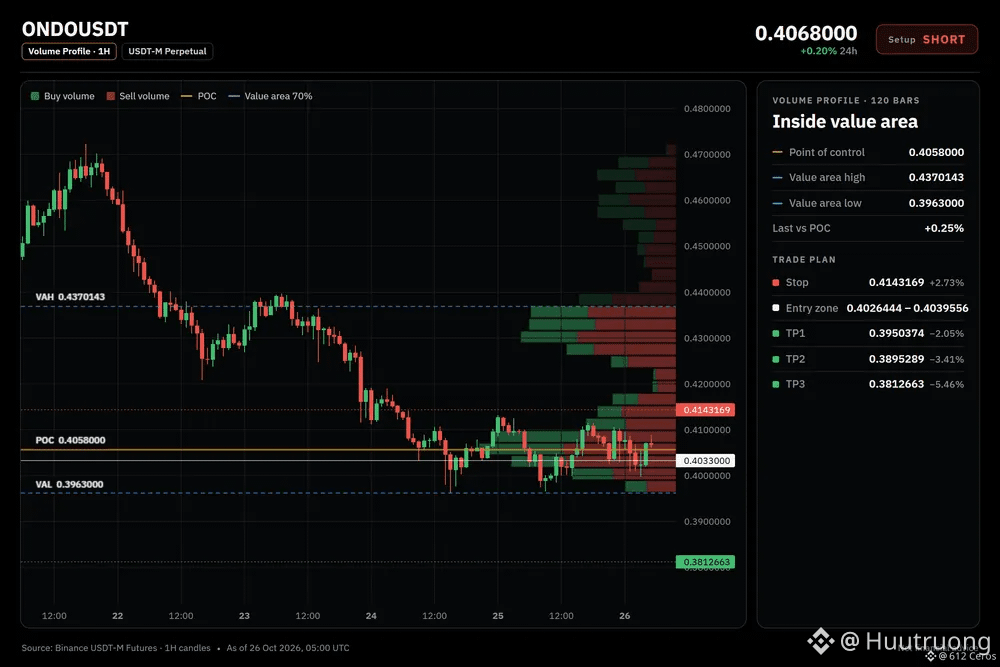
🔴 SHORT $ONDO /USDT: expecting price to go DOWN
Bias: SHORT · Leaning
Entry: 0.4026444 – 0.4039556
TP1: 0.3950374 (-2.0%)
TP2: 0.3895289 (-3.4%)
TP3: 0.3812663 (-5.5%)
SL: 0.4143169 (+2.7%)
Plan: enter only inside the zone, close 50% at TP1, 25% at TP2, 25% at TP3, and move the stop to entry after TP1.
Note: moderate conviction only, keep size light.
Why SHORT? 4/12 signals agree, 0 against.
• 4h trend down (below EMA50 & EMA200)
• 1h trend down (below EMA50 & EMA200)
• Sellers are driving the move (15m ADX 20.9)
Bear path:
If the 4h trend holds with price below the EMA stack, the 1h price may continue sliding toward the first target. The daily trend being range means the move could stay contained.
What kills it:
If the 1h price reclaims the entry level at 0.4039556, the bearish structure breaks and I would exit the short.
Where do you want to see price before shorting?
7
·
--
Em Baixa
Ver tradução
The 4h stack is bearish across every timeframe.
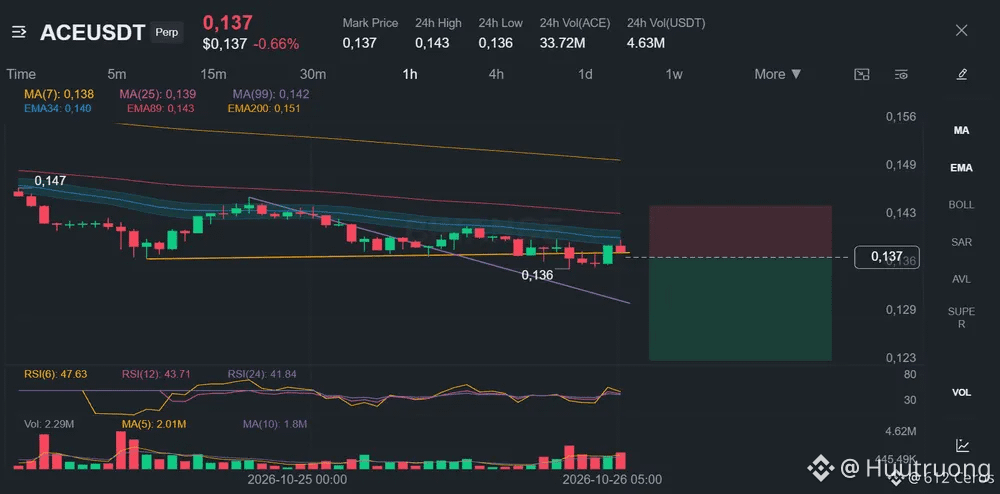
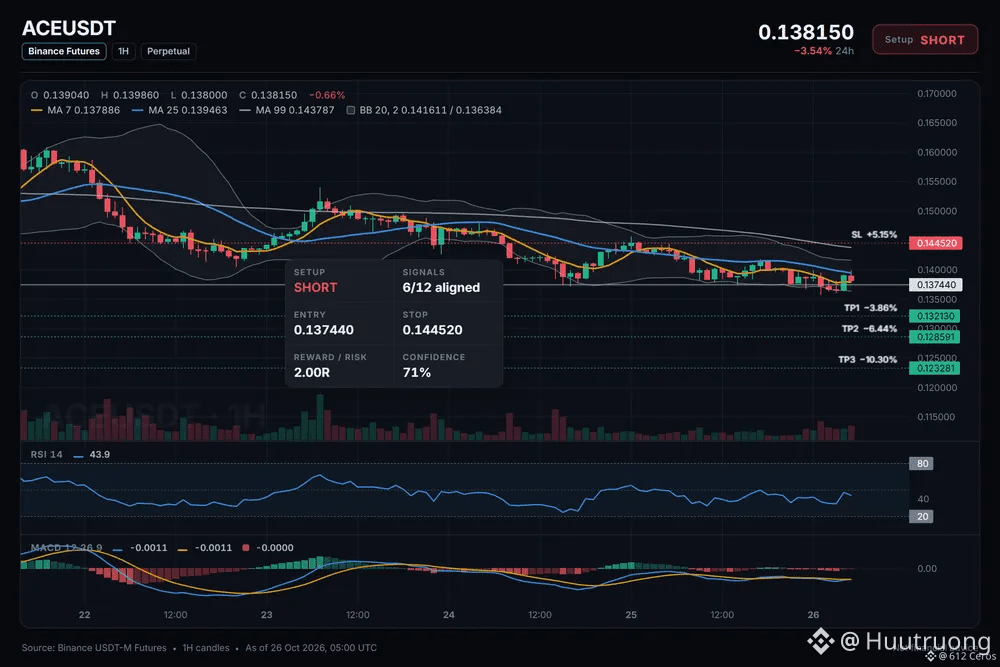
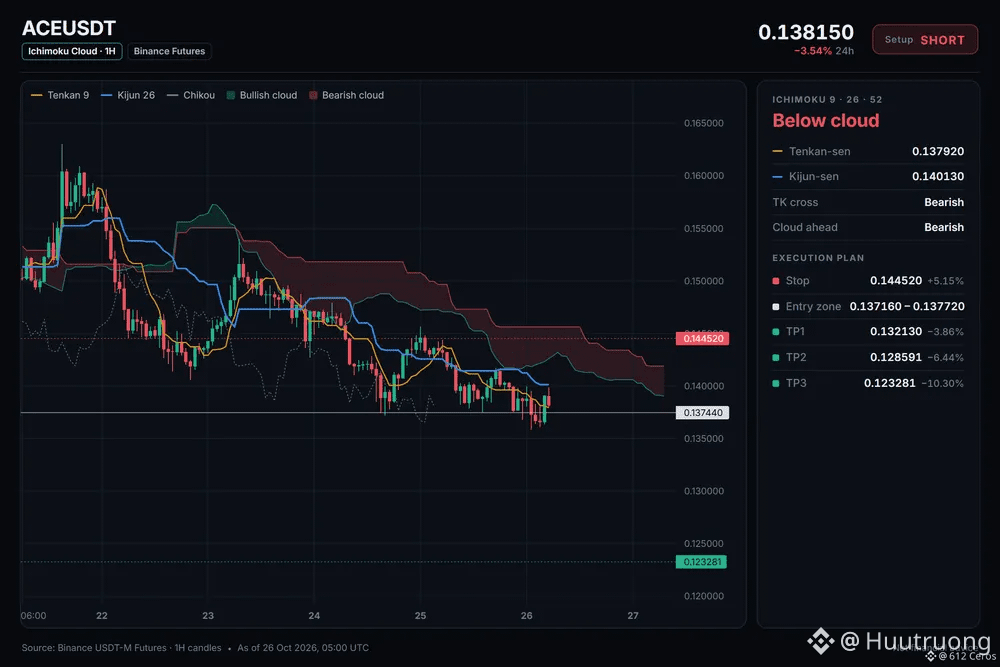
🔴 SHORT $ACE /USDT: expecting price to go DOWN
Bias: SHORT · Strong
Entry: 0.137160 – 0.137720
TP1: 0.132130 (-3.9%)
TP2: 0.128591 (-6.4%)
TP3: 0.123281 (-10.3%)
SL: 0.144520 (+5.2%)
Plan: enter only inside the zone, close 50% at TP1, 25% at TP2, 25% at TP3, and move the stop to entry after TP1.
Why SHORT? 6/12 signals agree, 0 against.
• 4h trend down (below EMA50 & EMA200)
• 1h trend down (below EMA50 & EMA200)
• Sellers have the momentum (4h RSI 33.9)
My read on ACE today
I'm watching a short setup on ACE. The 1h price is 0.137440, and the daily trend is a range, so the move is driven by the 4h bearish stack. I want to see the daily trend stay in range while the 4h stack holds.
Where is your invalidation level for this trade?
6
·
--
Em Baixa
Ver tradução
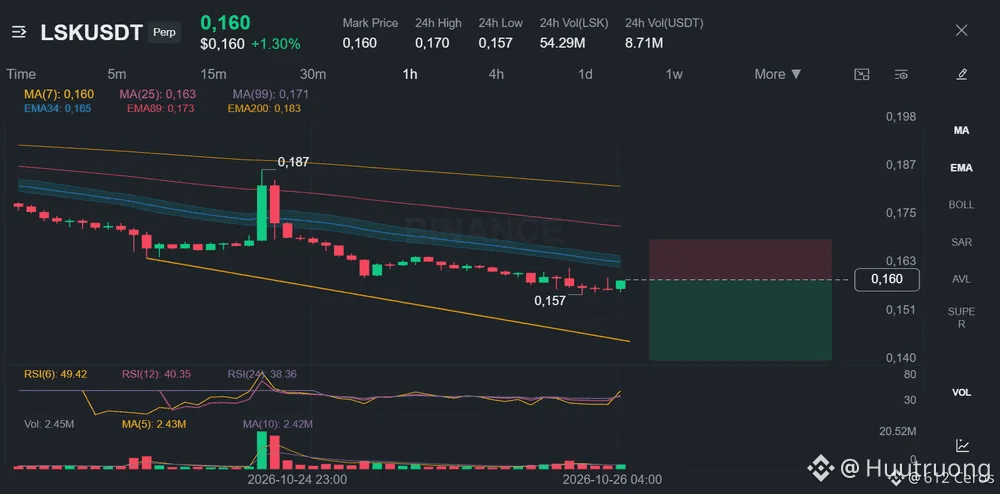
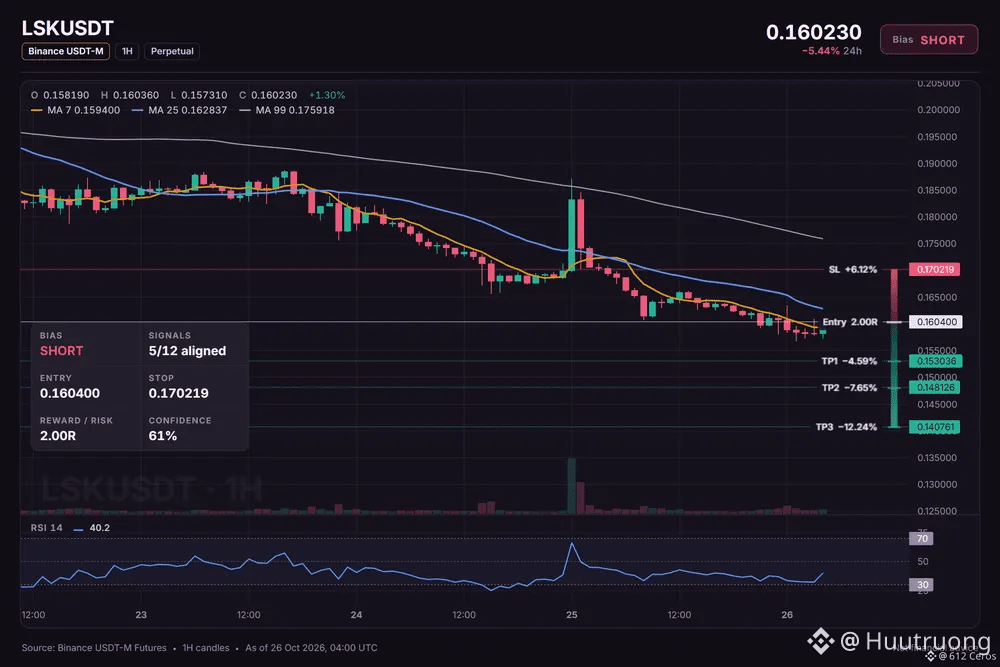
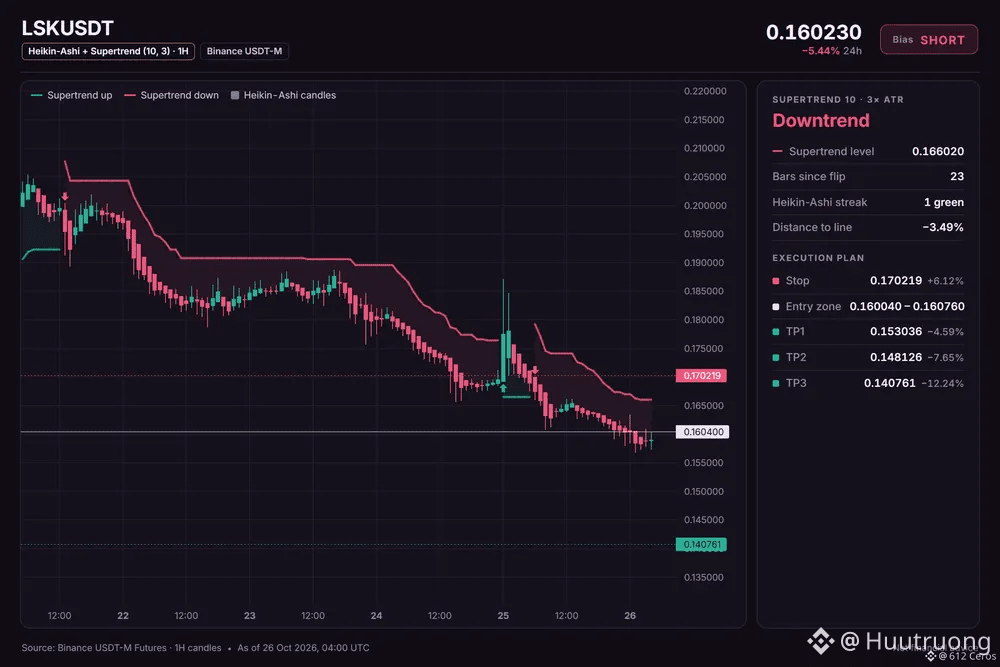
🔴 SHORT $LSK /USDT: expecting price to go DOWN
Bias: SHORT · Leaning
Entry: 0.160040 – 0.160760
TP1: 0.153036 (-4.6%)
TP2: 0.148126 (-7.7%)
TP3: 0.140761 (-12.2%)
SL: 0.170219 (+6.1%)
Plan: enter only inside the zone, close 50% at TP1, 25% at TP2, 25% at TP3, and move the stop to entry after TP1.
Note: moderate conviction only, keep size light.
LSK looks weak but buyers are fighting back now
Why SHORT? 5/12 signals agree, 2 against.
• 4h trend down (below EMA50 & EMA200)
• 1h trend down (below EMA50 & EMA200)
• Sellers have the momentum (1h RSI 40.2)
Risk: Price is washed out, bounces are common from here (4h RSI 24.4, oversold)
The 4h trend is bearish and the 1h RSI is below 45, but the 15m RSI shows buyers in control, so conviction is moderate.
What is your invalidation level if you are in this trade?
2
·
--
Em Baixa
Ver tradução
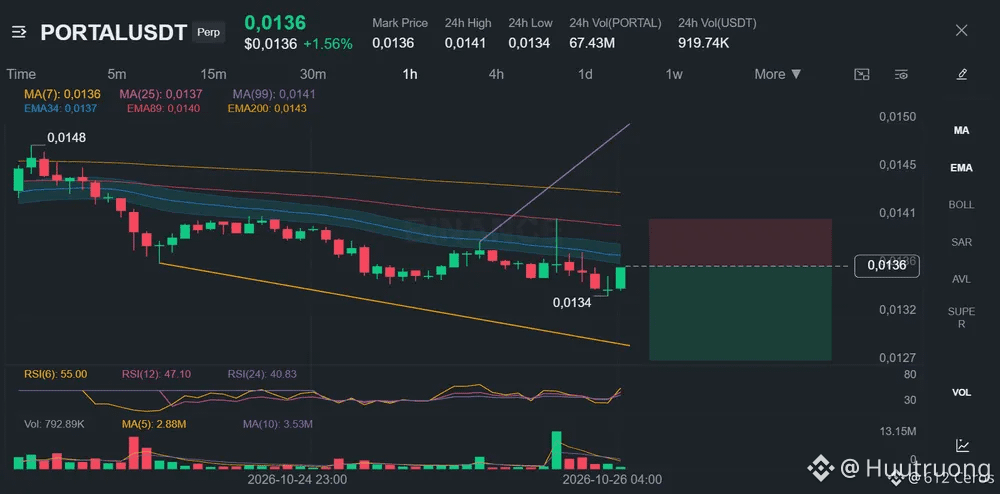
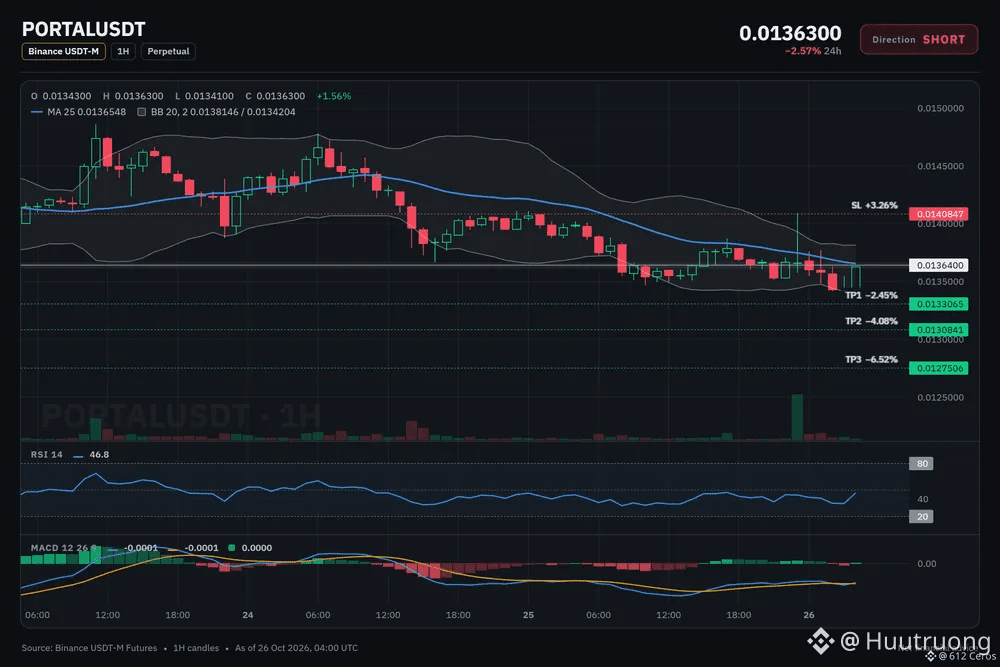
PORTAL short setup: the levels I'm watching
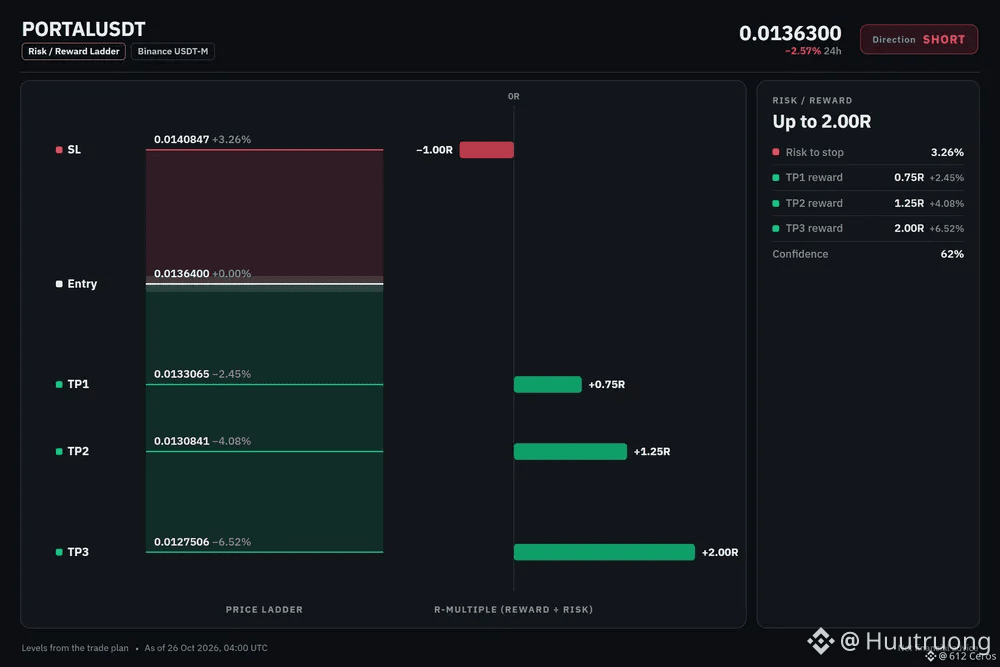
🔴 SHORT $PORTAL /USDT: expecting price to go DOWN
Bias: SHORT · Leaning
Entry: 0.0136135 – 0.0136665
TP1: 0.0133065 (-2.4%)
TP2: 0.0130841 (-4.1%)
TP3: 0.0127506 (-6.5%)
SL: 0.0140847 (+3.3%)
Plan: enter only inside the zone, close 50% at TP1, 25% at TP2, 25% at TP3, and move the stop to entry after TP1.
Note: moderate conviction only, keep size light.
Why SHORT? 4/12 signals agree, 1 against.
• 4h trend down (below EMA50 & EMA200)
• 1h trend down (below EMA50 & EMA200)
• Sellers have the momentum (4h RSI 34.9)
Risk: Buyers are pushing right now (+0.74% 15m candle)
In plain words:
The daily trend reads range, and 4/12 signals aligned favour the short side. The plan is to work the 0.0136135 – 0.0136665 zone, scale out at 0.0133065 and 0.0130841, and stay patient for 0.0127506. A move through 0.0140847 means the idea is wrong and the stop does its job.
Does PORTAL tag 0.0133065 first, or the stop?
7
·
--
Em Alta
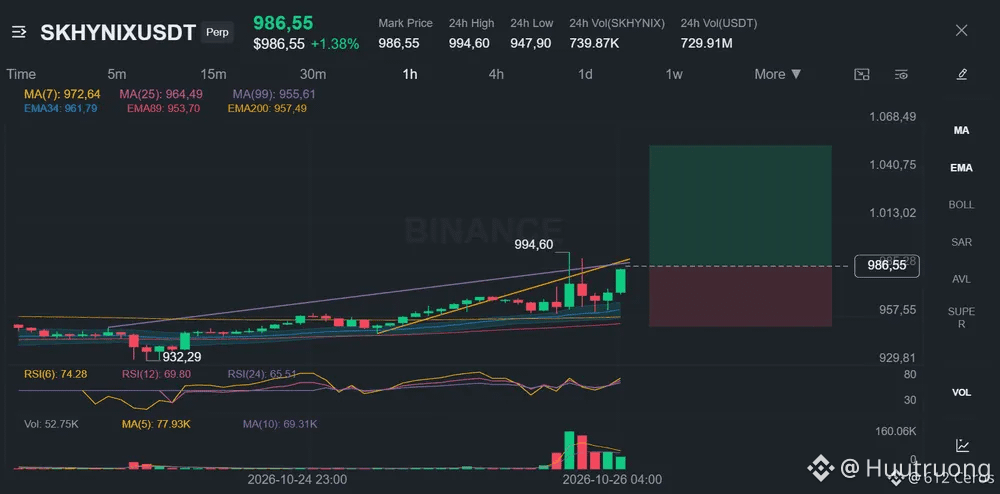
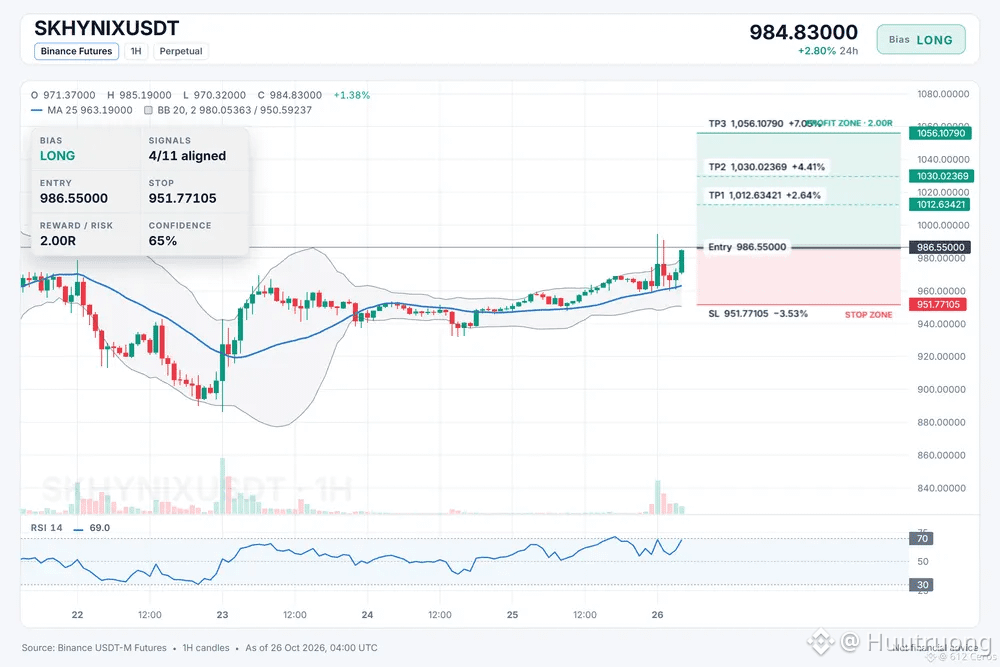
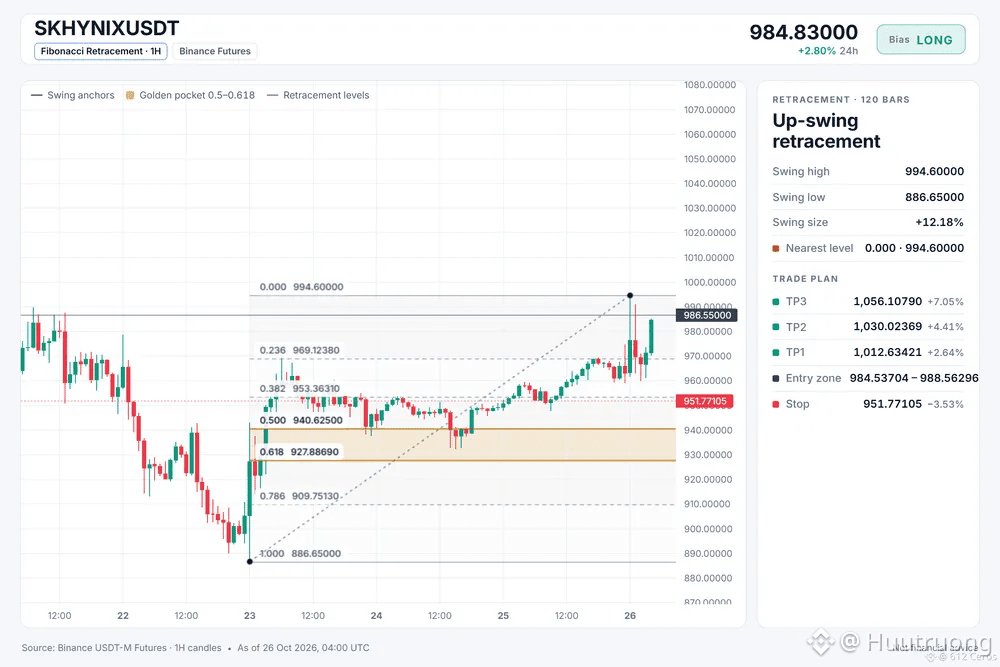
SKHYNIX parece esticada acima do conjunto de EMAs de 1h
🟢 COMPRA $SKHYNIX /USDT: expectativa de alta do preço
Viés: COMPRA · Tendência
Entrada: 984.53704 – 988.56296
TP1: 1012.63421 (+2.6%)
TP2: 1030.02369 (+4.4%)
TP3: 1056.10790 (+7.1%)
SL: 951.77105 (-3.5%)
Plano: entre apenas dentro da zona, feche 50% no TP1, 25% no TP2, 25% no TP3 e mova o stop para o preço de entrada após o TP1.
Nota: convicção moderada; mantenha a posição pequena.
Por que COMPRA? 4/11 sinais concordam, 0 são contrários.
• Tendência de 1h em alta (acima da EMA50 e da EMA200)
• Os compradores têm o impulso (RSI de 4h em 59.1)
• Os compradores têm o impulso (RSI de 1h em 69.0)
Cenário de alta:
Se a tendência de 1h se mantiver acima da EMA200, o preço poderá alcançar o primeiro alvo, onde o RSI de 1h indica que os compradores ainda têm impulso.
O que invalida a operação:
Se o preço romper o stop loss na mínima da entrada, o regime de amplitude diária provavelmente indica que essa configuração estava errada, então eu sairia da operação.
Onde você define a invalidação desta operação?
1
·
--
Em Baixa
Ver tradução
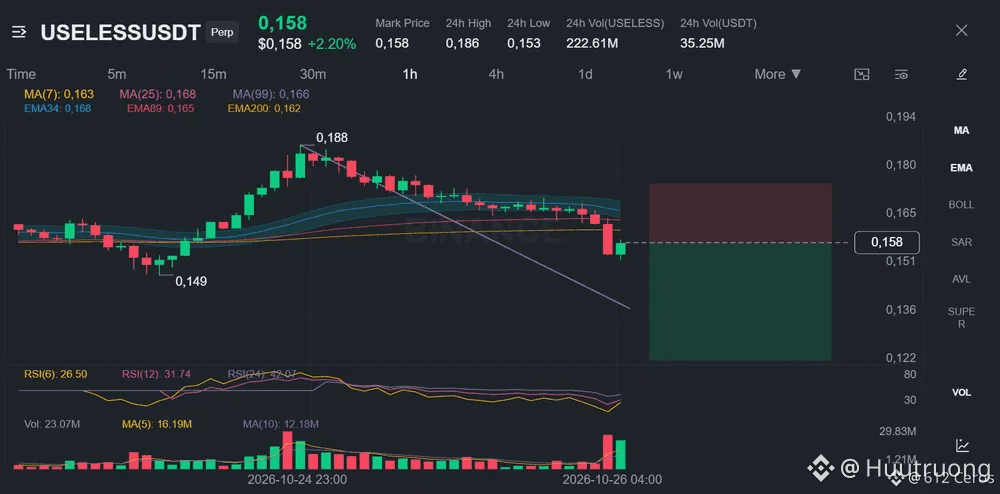
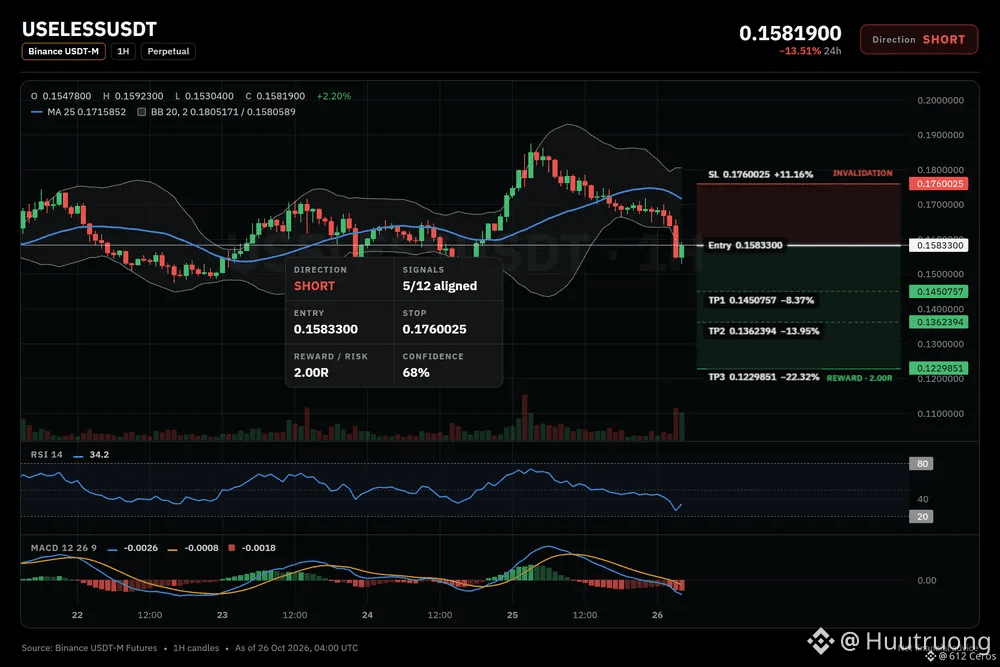
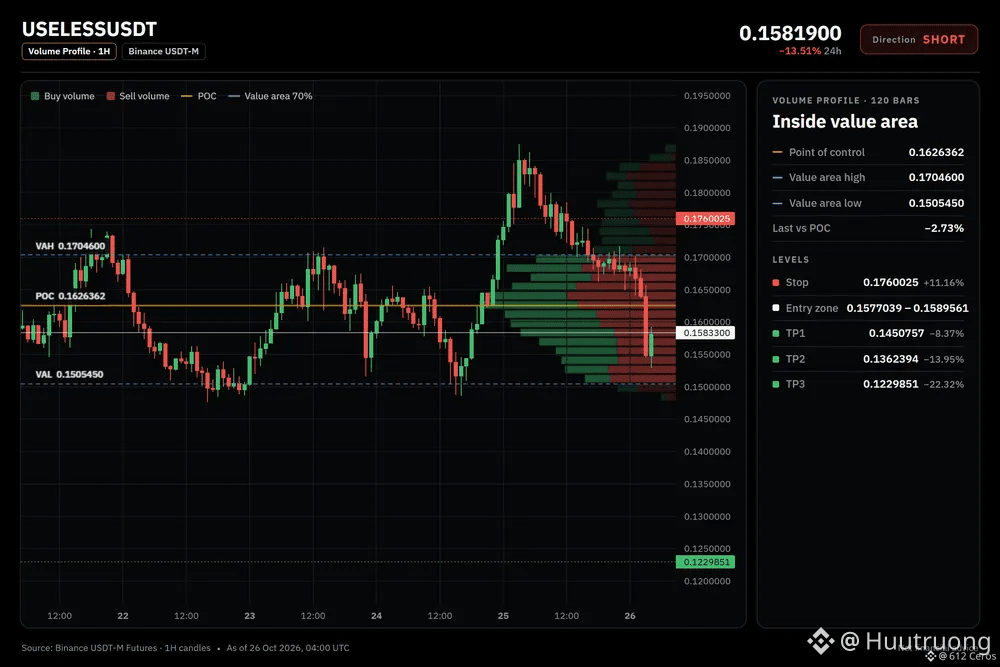
USELESS is grinding below its moving averages
🔴 SHORT $USELESS /USDT: expecting price to go DOWN
Bias: SHORT · Leaning
Entry: 0.1577039 – 0.1589561
TP1: 0.1450757 (-8.4%)
TP2: 0.1362394 (-14.0%)
TP3: 0.1229851 (-22.3%)
SL: 0.1760025 (+11.2%)
Plan: enter only inside the zone, close 50% at TP1, 25% at TP2, 25% at TP3, and move the stop to entry after TP1.
Note: moderate conviction only, keep size light.
Why SHORT? 5/12 signals agree, 0 against.
• 4h trend down (below EMA50 & EMA200)
• Sellers are driving the move (15m ADX 37.1)
• Sellers have the momentum (4h RSI 43.4)
Q: Why short when the daily trend is range?
A: The 4h chart shows a bearish stack with price below both EMAs.
Q: When is this setup wrong?
A: If price holds above 0.1760025 the short thesis fails.
What is your invalidation level for this trade?
9
·
--
Em Baixa
Ver tradução
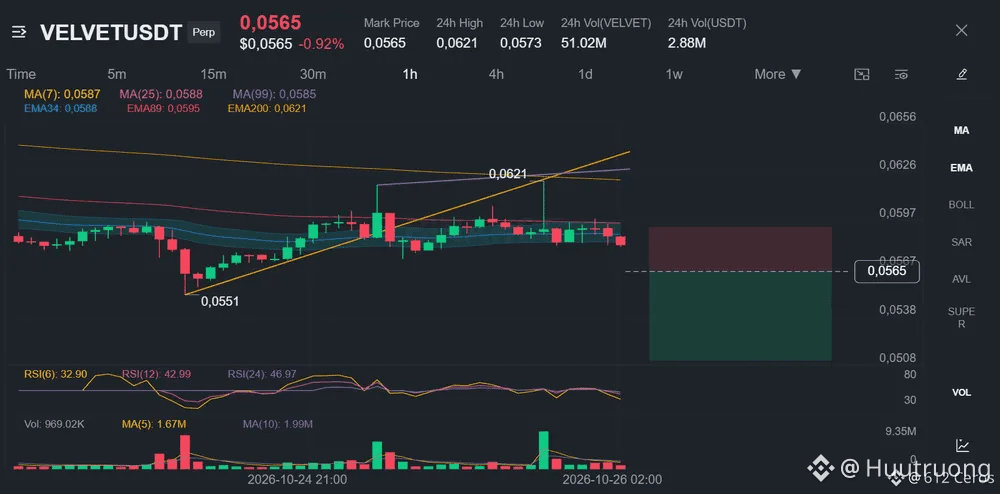
VELVET short setup: the levels I'm watching
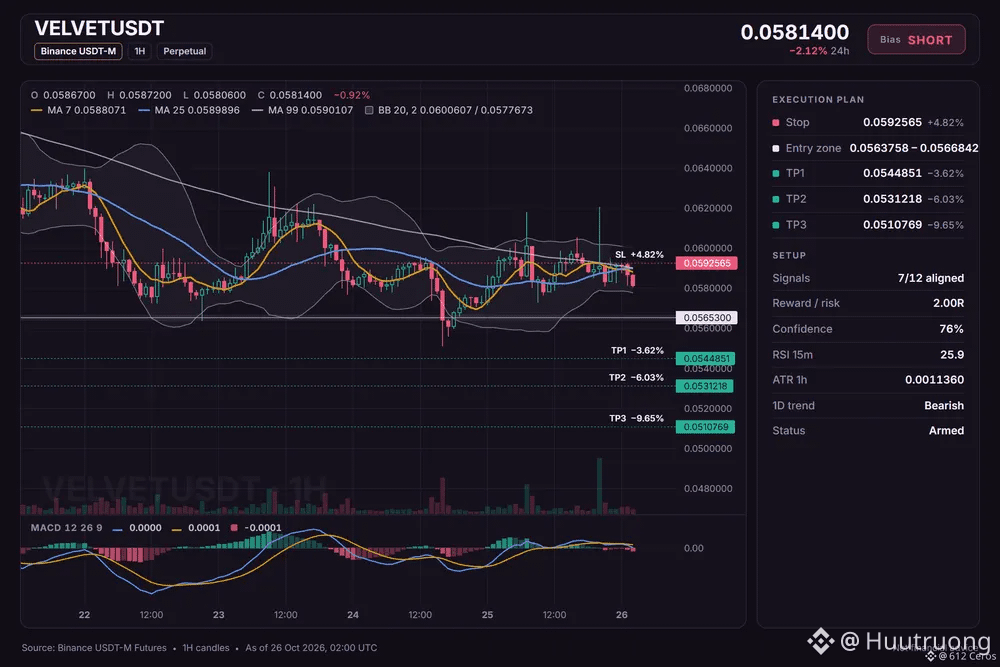
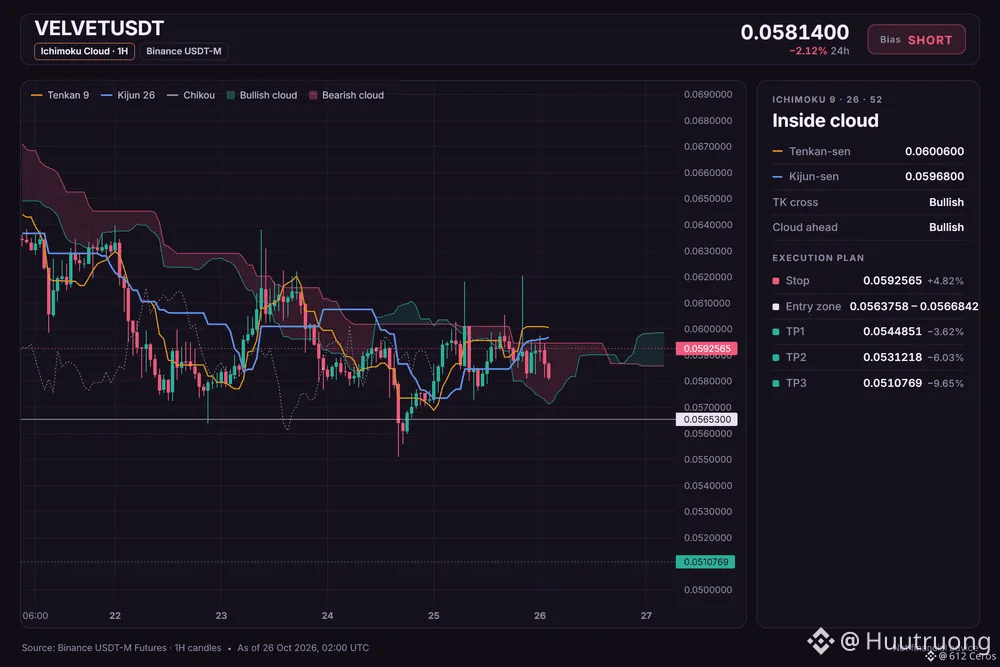
🔴 SHORT $VELVET /USDT: expecting price to go DOWN
Bias: SHORT · Strong
Entry: 0.0563758 – 0.0566842
TP1: 0.0544851 (-3.6%)
TP2: 0.0531218 (-6.0%)
TP3: 0.0510769 (-9.6%)
SL: 0.0592565 (+4.8%)
Plan: enter only inside the zone, close 50% at TP1, 25% at TP2, 25% at TP3, and move the stop to entry after TP1.
Why SHORT? 7/12 signals agree, 1 against.
• Daily trend down (below EMA50 & EMA200)
• 4h trend down (below EMA50 & EMA200)
• 1h trend down (below EMA50 & EMA200)
Risk: Range bottom, buyers often step in (RSI z −2.72)
In plain words:
The daily trend reads bearish, and 7/12 signals aligned favour the short side. The plan is to work the 0.0563758 – 0.0566842 zone, scale out at 0.0544851 and 0.0531218, and stay patient for 0.0510769. A move through 0.0592565 means the idea is wrong and the stop does its job.
Does VELVET tag 0.0544851 first, or the stop?
6
·
--
Em Baixa
Ver tradução
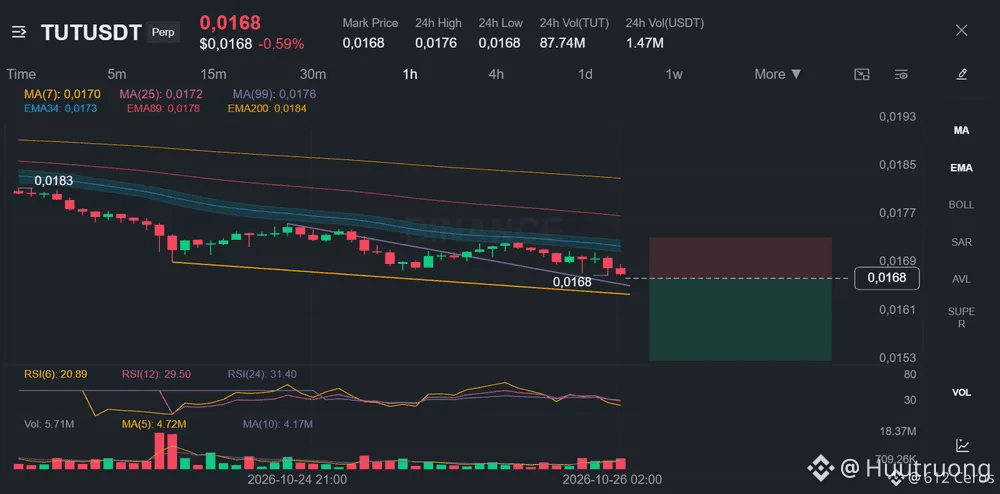
TUT is grinding below both EMAs across two timeframes.
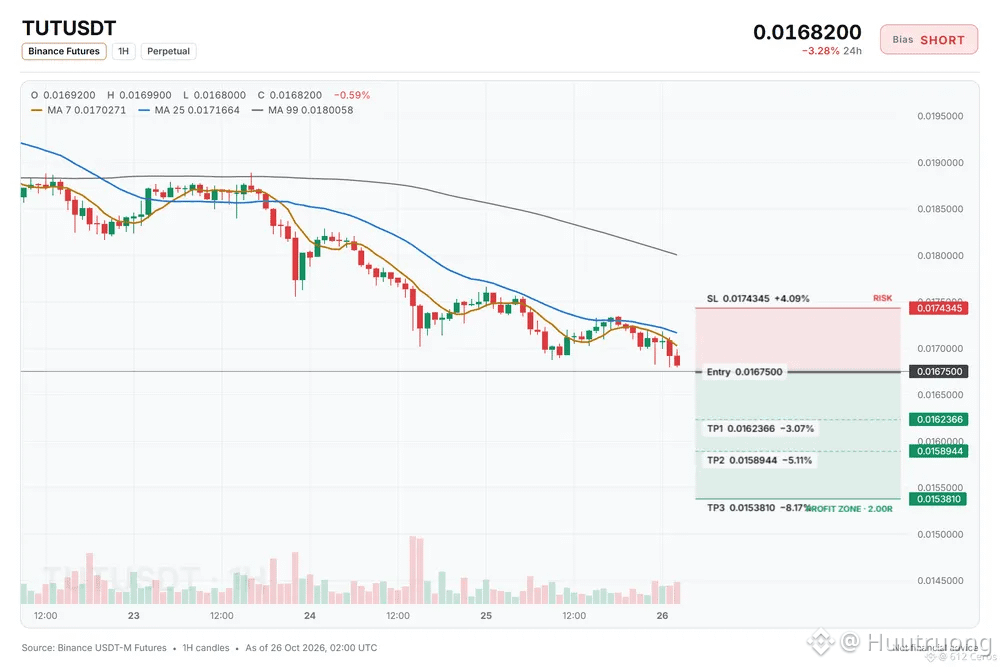
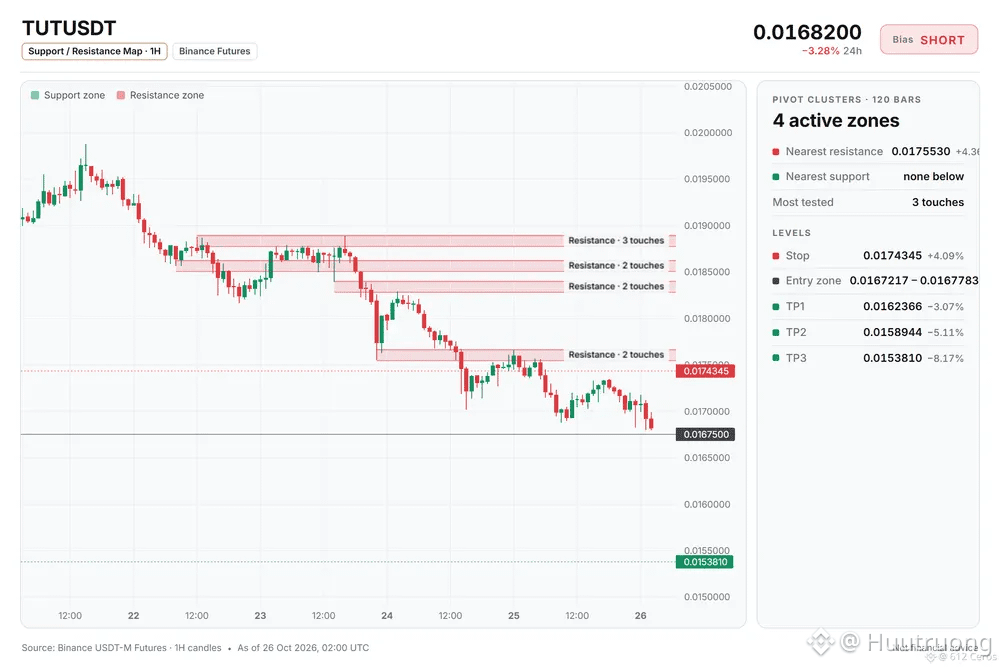
🔴 SHORT $TUT /USDT: expecting price to go DOWN
Bias: SHORT · Strong
Entry: 0.0167217 – 0.0167783
TP1: 0.0162366 (-3.1%)
TP2: 0.0158944 (-5.1%)
TP3: 0.0153810 (-8.2%)
SL: 0.0174345 (+4.1%)
Plan: enter only inside the zone, close 50% at TP1, 25% at TP2, 25% at TP3, and move the stop to entry after TP1.
Why SHORT? checklist: 8/12 agree, 1 against.
• 4h trend down (below EMA50 & EMA200)
• 1h trend down (below EMA50 & EMA200)
• Sellers are driving the move (15m ADX 34.4)
Watch: Far below its average, bounce likely (−3.7 ATR from 1h EMA50)
Watch: The idea is wrong if price reaches the stop at 0.0174345
Bottom line: The 4h bearish stack and strong seller momentum support the short, but price is 3.7 ATR below the 1h EMA50, so a bounce is possible.
Where would you set your short entry on ?
4
·
--
Em Baixa
Ver tradução
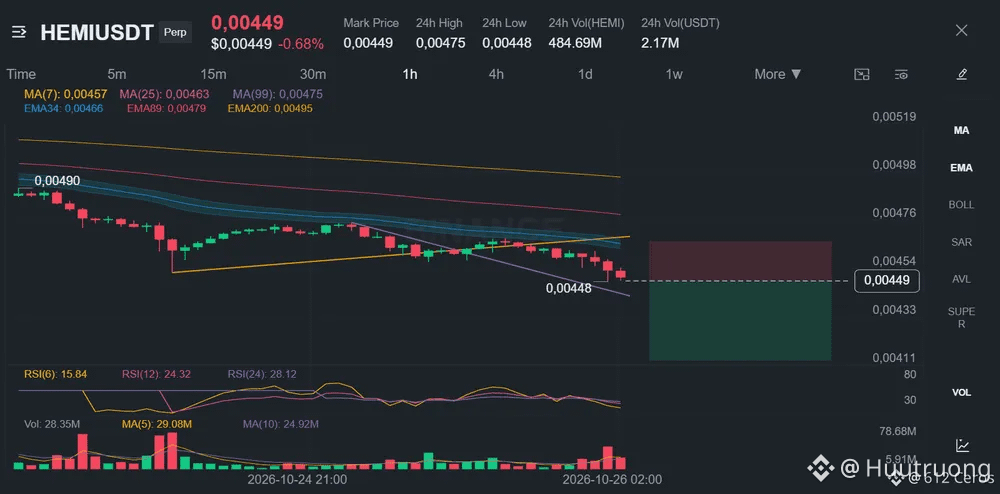
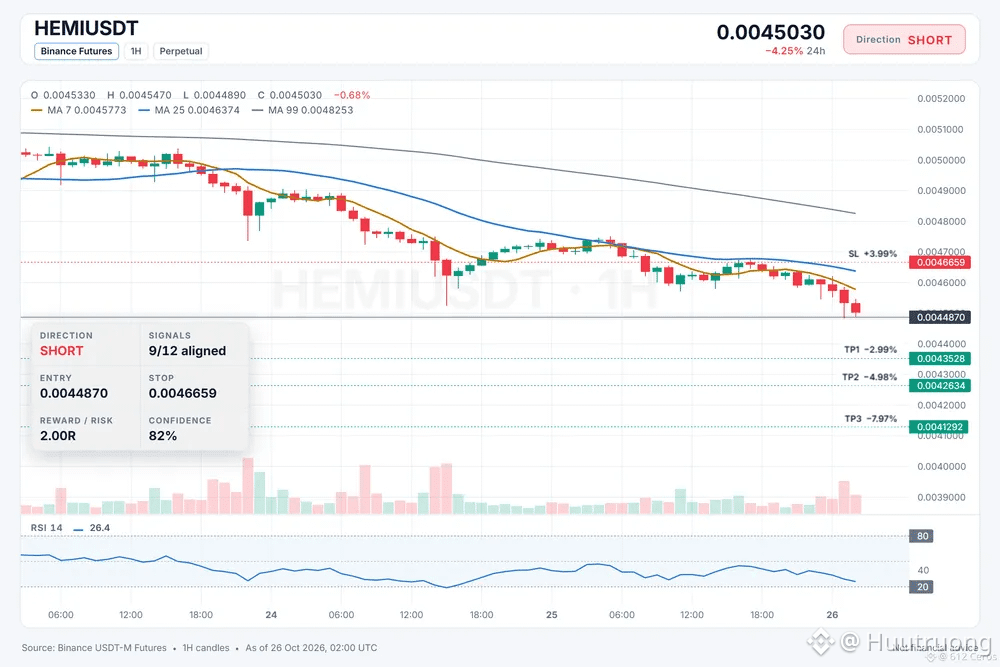
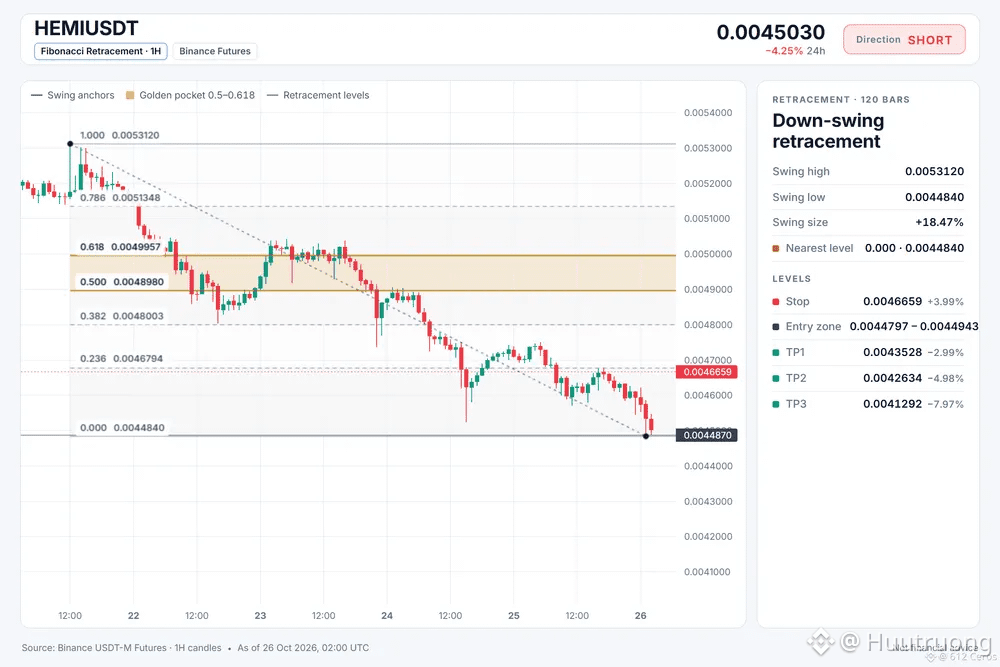
HEMI is grinding lower through a bearish stack across timeframes.
🔴 SHORT $HEMI /USDT: expecting price to go DOWN
Bias: SHORT · Strong
Entry: 0.0044797 – 0.0044943
TP1: 0.0043528 (-3.0%)
TP2: 0.0042634 (-5.0%)
TP3: 0.0041292 (-8.0%)
SL: 0.0046659 (+4.0%)
Plan: enter only inside the zone, close 50% at TP1, 25% at TP2, 25% at TP3, and move the stop to entry after TP1.
Why SHORT? 9/12 signals agree, 1 against.
• Daily trend down (below EMA50 & EMA200)
• 4h trend down (below EMA50 & EMA200)
• 1h trend down (below EMA50 & EMA200)
Risk: Far below its average, bounce likely (−4.2 ATR from 1h EMA50)
Bear path:
If the idea works, price should keep sliding toward the 1h EMA50, confirming the bearish momentum.
What kills it:
A bounce back above the entry invalidates the short and proves the sellers are exhausted.
Where do you see HEMI finding resistance first?
4
·
--
Em Baixa
Ver tradução
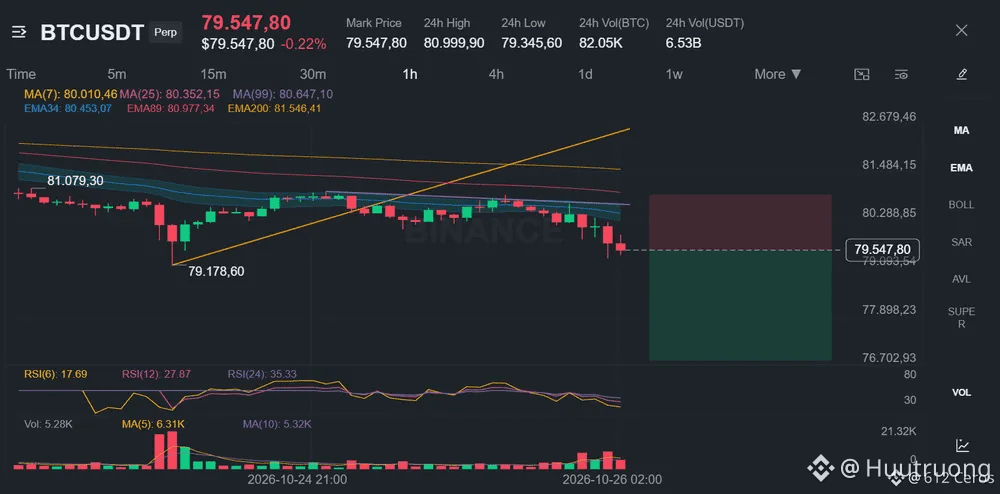
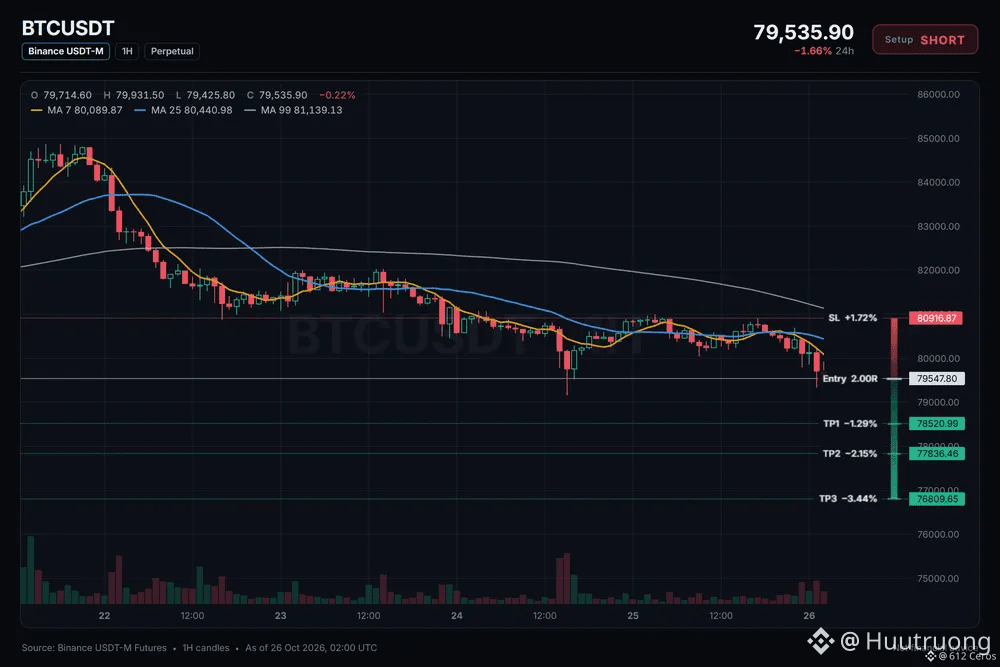
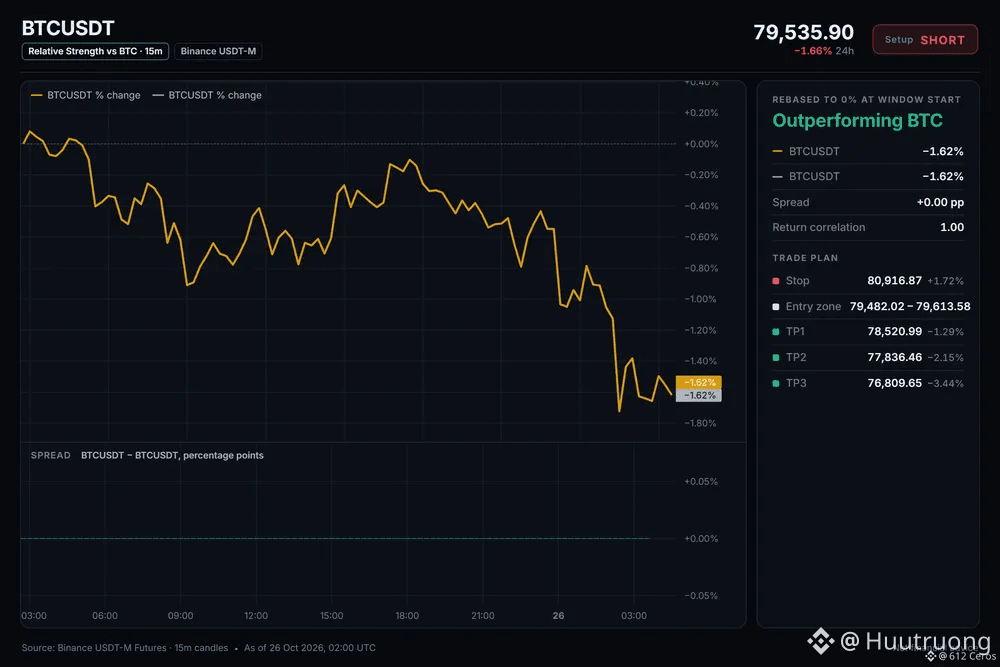
Liệu BTC có thể tiếp tục giảm xuống trong vùng giảm giá 4 giờ không?
🔴 BÁN KHỐNG $BTC /USDT: dự đoán giá sẽ GIẢM.
Xu hướng: BÁN KHỐNG · Điểm vào lệnh mạnh
: 79482.02 – 79613.58
TP1: 78520.99 (-1.3%)
TP2: 77836.46 (-2.2%)
TP3: 76809.65 (-3.4%)
SL: 80916.87 (+1.7%)
Kế hoạch: chỉ vào lệnh trong vùng này, chốt lời 50% tại TP1, 25% tại TP2, 25% tại TP3, và di chuyển điểm dừng lỗ về điểm vào lệnh sau TP1.
Tại sao BÁN KHỐNG? 6/12 tín hiệu đồng ý, 0 tín hiệu phản đối.
• Xu hướng giảm trên biểu đồ 4 giờ (dưới EMA50 & EMA200)
• Xu hướng giảm trên biểu đồ 1 giờ (dưới EMA50 & EMA200)
• Người bán đang đẩy giá xuống (ADX 15 phút ở mức 33.3)
Tại sao lại là bây giờ?
Xu hướng 4 giờ cho thấy giá nằm dưới cả EMA 50 và 200, với người bán đang đẩy giá xuống khi ADX ở mức 33.3 và RSI 1 giờ ở mức 30.2. Xu hướng hàng ngày đang đi ngang và bối cảnh BTC đang giảm, vì vậy thiết lập lệnh bán phù hợp với động lượng chung. Cửa sổ vào lệnh là từ 79482.02 đến 79613.58.
Bạn sẽ đặt điểm hủy lệnh ở đâu nếu bạn thực hiện lệnh bán này?
14
·
--
Kite e o próximo capítulo da economia dos agentes
A verdadeira oportunidade na economia dos agentes não está simplesmente em criar mais agentes de IA. Está em construir um ambiente onde os agentes possam coordenar-se, interagir e contribuir para atividades econômicas significativas.
À medida que os agentes de IA se tornam mais capazes, surge uma questão crucial: como agentes independentes podem descobrir oportunidades, estabelecer confiança e colaborar de forma eficaz em ecossistemas digitais?
É aqui que acredito que Kite merece atenção. Em vez de olhar para a economia dos agentes apenas pela ótica do desempenho da IA, também devemos considerar a infraestrutura, a coordenação e a participação necessárias para tornar úteis, na prática, os sistemas impulsionados por agentes.
Para a Web3, a oportunidade mais promissora está na interseção entre software autônomo e redes digitais abertas. Se os agentes puderem participar de forma mais eficaz nesses ambientes, novas formas de colaboração e serviços digitais poderão se tornar possíveis. No entanto, o progresso real dependerá da adoção prática, da segurança, da confiabilidade e da utilidade mensurável — não apenas do hype.
Na minha opinião, o futuro da economia dos agentes será definido não pelo número de agentes criados, mas pela capacidade deles de trabalhar juntos para resolver problemas reais.
Como você acha que projetos como Kite podem ajudar a transformar a economia dos agentes, de uma ideia emergente em infraestrutura prática?
[https://app.binance.com/uni-qr/cpro/Deaflove?l=en&r=JQ3F4UE9&uc=web_square_share_link&us=copylink](https://app.binance.com/uni-qr/cpro/Deaflove?l=en&r=JQ3F4UE9&uc=web_square_share_link&us=copylink)
#KiteBBW $KITE @GoKiteAI
Kite e o próximo capítulo da economia dos agentes
A verdadeira oportunidade na economia dos agentes não está simplesmente em criar mais agentes de IA. Está em construir um ambiente onde os agentes possam coordenar-se, interagir e contribuir para atividades econômicas significativas.
À medida que os agentes de IA se tornam mais capazes, surge uma questão crucial: como agentes independentes podem descobrir oportunidades, estabelecer confiança e colaborar de forma eficaz em ecossistemas digitais?
É aqui que acredito que Kite merece atenção. Em vez de olhar para a economia dos agentes apenas pela ótica do desempenho da IA, também devemos considerar a infraestrutura, a coordenação e a participação necessárias para tornar úteis, na prática, os sistemas impulsionados por agentes.
Para a Web3, a oportunidade mais promissora está na interseção entre software autônomo e redes digitais abertas. Se os agentes puderem participar de forma mais eficaz nesses ambientes, novas formas de colaboração e serviços digitais poderão se tornar possíveis. No entanto, o progresso real dependerá da adoção prática, da segurança, da confiabilidade e da utilidade mensurável — não apenas do hype.
Na minha opinião, o futuro da economia dos agentes será definido não pelo número de agentes criados, mas pela capacidade deles de trabalhar juntos para resolver problemas reais.
Como você acha que projetos como Kite podem ajudar a transformar a economia dos agentes, de uma ideia emergente em infraestrutura prática?
https://app.binance.com/uni-qr/cpro/Deaflove?l=en&r=JQ3F4UE9&uc=web_square_share_link&us=copylink
#KiteBBW $KITE @GoKiteAI

37
·
--
Em Baixa
Ver tradução
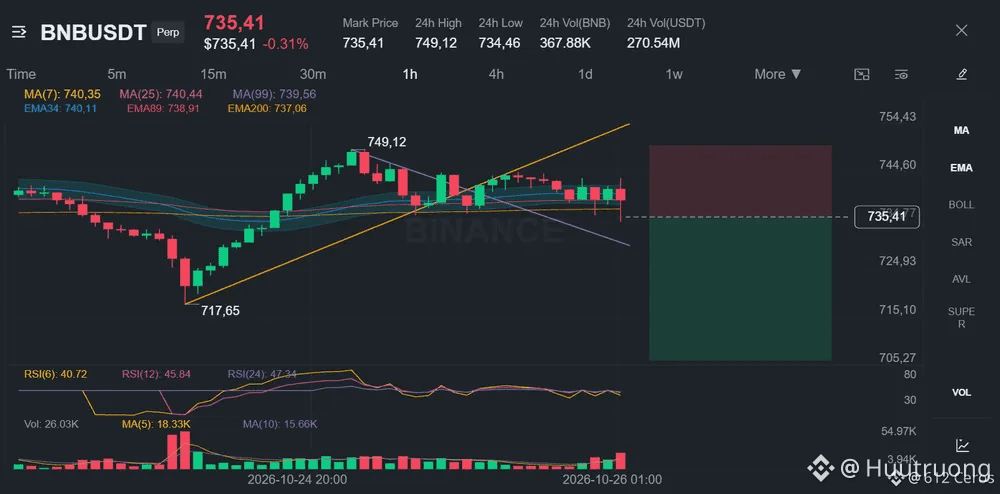
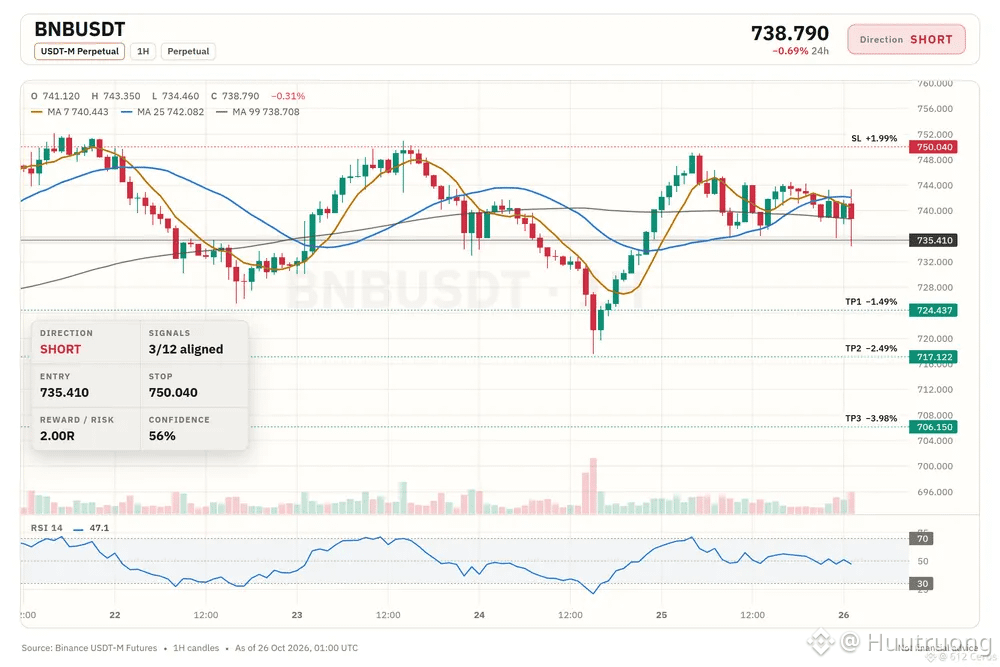
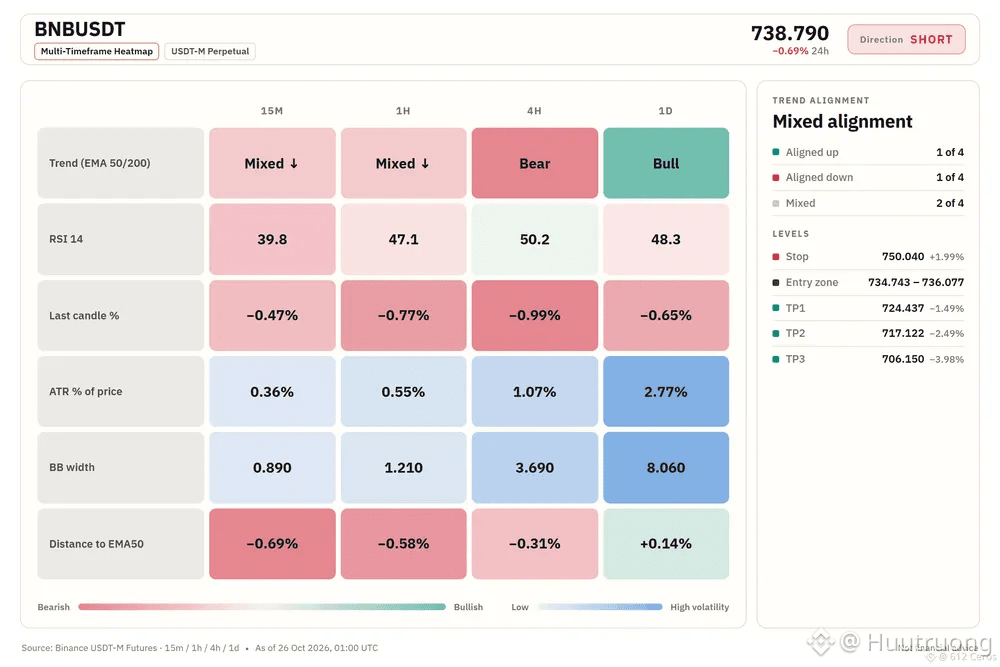
price below both EMAs on the 4h chart
🔴 SHORT $BNB /USDT: expecting price to go DOWN
Bias: SHORT · Leaning
Entry: 734.743 – 736.077
TP1: 724.437 (-1.5%)
TP2: 717.122 (-2.5%)
TP3: 706.150 (-4.0%)
SL: 750.040 (+2.0%)
Plan: enter only inside the zone, close 50% at TP1, 25% at TP2, 25% at TP3, and move the stop to entry after TP1.
Caution: counter-trend idea backed by 3 signals only. Smaller size, hard stop.
Why SHORT? 3/12 signals agree, 1 against.
• 4h trend down (below EMA50 & EMA200)
• is falling, this coin follows (corr 0.90)
• Sellers are pushing right now (−0.47% 15m candle)
Risk: Daily trend up (above EMA50 & EMA200)
Trade note:
I'm watching for a short on because the 4h trend shows price below the EMA50 and EMA200, a bearish stack. The 15m RSI is 39.78, a reading below 50 that means sellers are in control right now. I want to see BNB push from the 1h price of 735.41 toward the daily trend, but the daily trend is bullish, so this is a counter-trend reversal bet and I will size down and respect the stop at 750.040. The strongest support is the 4h bearish stack and the BTC backdrop with a 0.90 correlation showing BTC is falling and BNB tends to follow; the main risk is the bullish daily trend stacking against the setup.
Where do you take profit on this short?
32
·
--
Em Baixa
Ver tradução
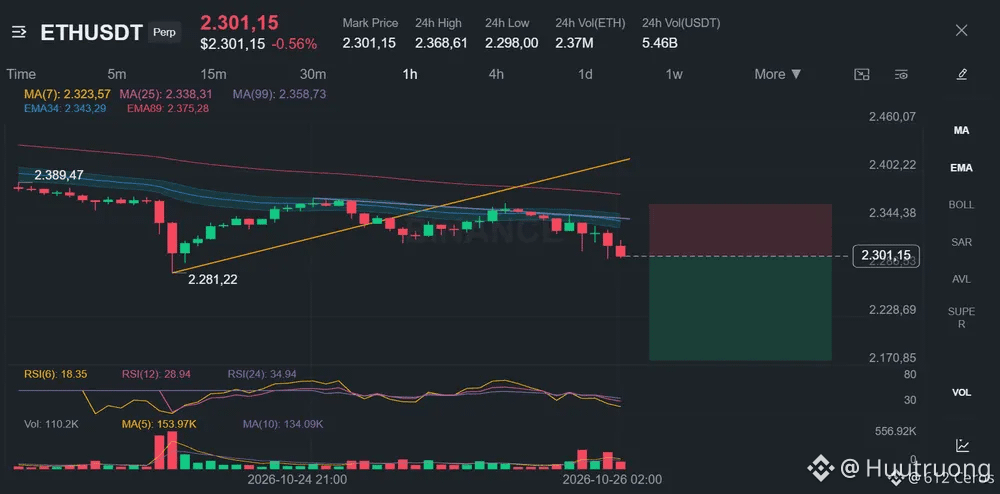
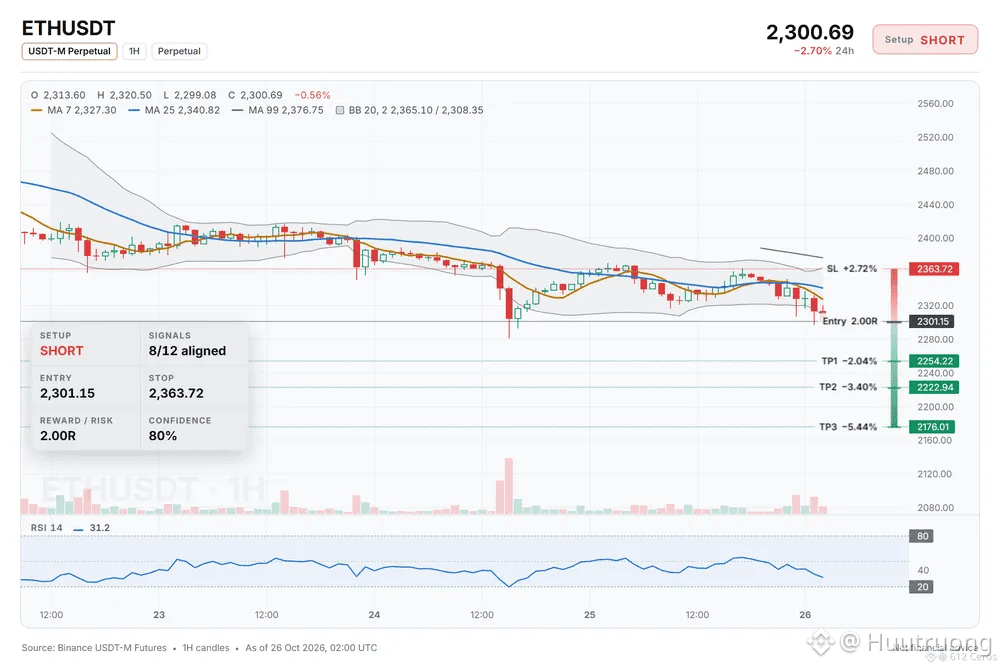
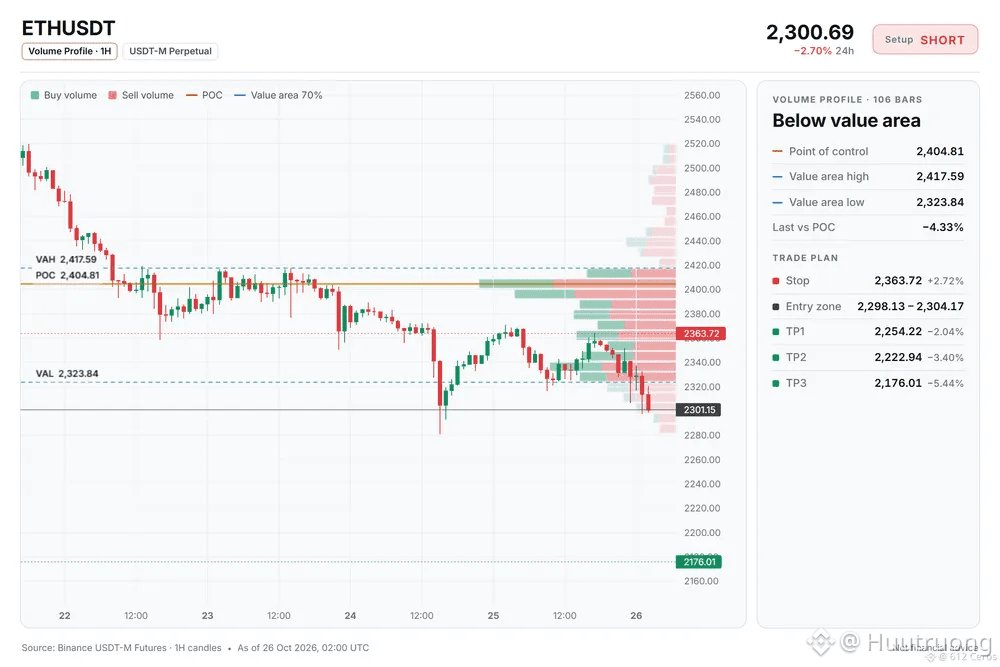
ETH shows a bearish stack across every trend timeframe
🔴 SHORT $ETH /USDT: expecting price to go DOWN
Bias: SHORT · Strong
Entry: 2298.13 – 2304.17
TP1: 2254.22 (-2.0%)
TP2: 2222.94 (-3.4%)
TP3: 2176.01 (-5.4%)
SL: 2363.72 (+2.7%)
Plan: enter only inside the zone, close 50% at TP1, 25% at TP2, 25% at TP3, and move the stop to entry after TP1.
Why SHORT? 8/12 signals agree, 0 against.
• 4h trend down (below EMA50 & EMA200)
• 1h trend down (below EMA50 & EMA200)
• Sellers are driving the move (15m ADX 36.5)
Q: Why short now?
A: The 4h trend shows price below EMA50 below EMA200, confirming the swing trend is down.
Q: When is this trade wrong?
A: If the 1h price moves above 2363.72, the invalidation level is hit and the setup fails.
What is your level if this fails?
47
·
--
Em Baixa
Ver tradução
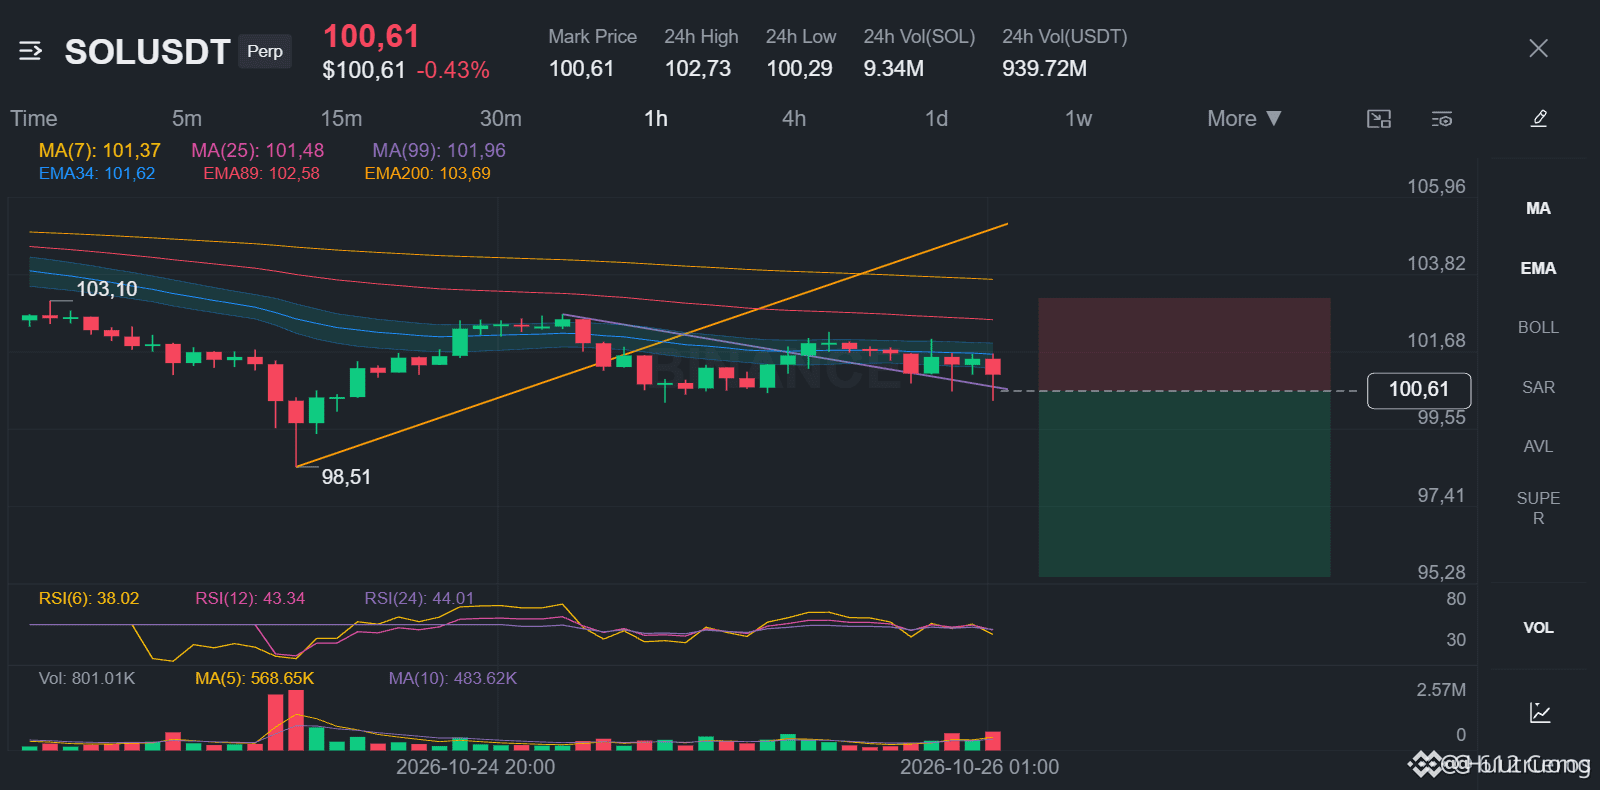
Range breaks often flip into fast moves lower.
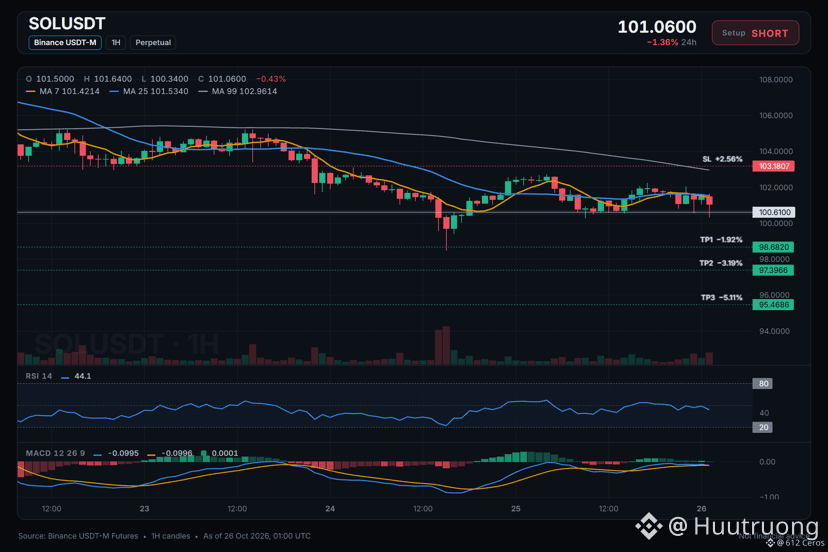
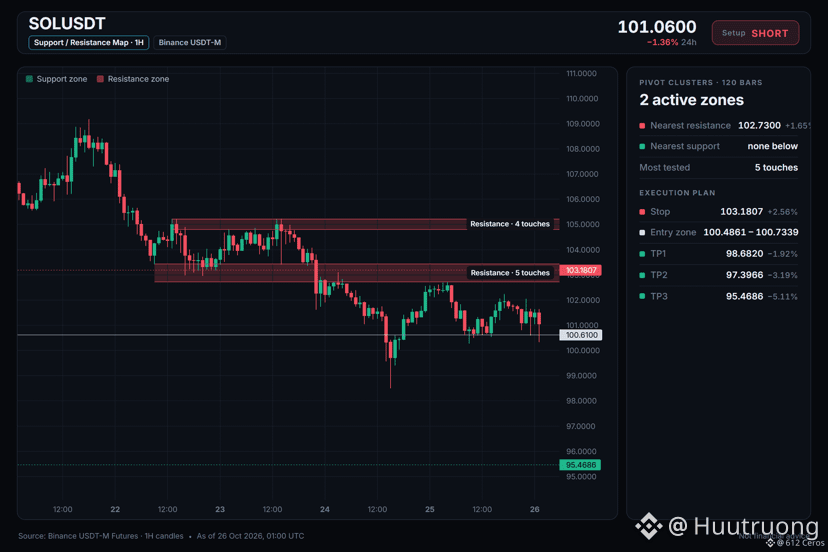
🔴 SHORT $SOL /USDT: expecting price to go DOWN
Bias: SHORT · Strong
Entry: 100.4861 – 100.7339
TP1: 98.6820 (-1.9%)
TP2: 97.3966 (-3.2%)
TP3: 95.4686 (-5.1%)
SL: 103.1807 (+2.6%)
Plan: enter only inside the zone, close 50% at TP1, 25% at TP2, 25% at TP3, and move the stop to entry after TP1.
Why SHORT? 7/12 signals agree, 1 against.
• 4h trend down (below EMA50 & EMA200)
• 1h trend down (below EMA50 & EMA200)
• Sellers are driving the move (15m ADX 24.6)
Risk: Range bottom, buyers often step in (RSI z −2.04)
The short version:
1. The daily trend is range bound but the 4h trend is a clear bearish stack.
2. The 1h trend is also bearish with price below EMA50 and EMA200.
3. A bounce back to the 1h EMA50 would make this idea wrong.
What level would make you take the other side?
{spot}(SOLUSDT)
Range breaks often flip into fast moves lower.
🔴 SHORT $SOL /USDT: expecting price to go DOWN
Bias: SHORT · Strong
Entry: 100.4861 – 100.7339
TP1: 98.6820 (-1.9%)
TP2: 97.3966 (-3.2%)
TP3: 95.4686 (-5.1%)
SL: 103.1807 (+2.6%)
Plan: enter only inside the zone, close 50% at TP1, 25% at TP2, 25% at TP3, and move the stop to entry after TP1.
Why SHORT? 7/12 signals agree, 1 against.
• 4h trend down (below EMA50 & EMA200)
• 1h trend down (below EMA50 & EMA200)
• Sellers are driving the move (15m ADX 24.6)
Risk: Range bottom, buyers often step in (RSI z −2.04)
The short version:
1. The daily trend is range bound but the 4h trend is a clear bearish stack.
2. The 1h trend is also bearish with price below EMA50 and EMA200.
3. A bounce back to the 1h EMA50 would make this idea wrong.
What level would make you take the other side?
58
·
--
Em Baixa
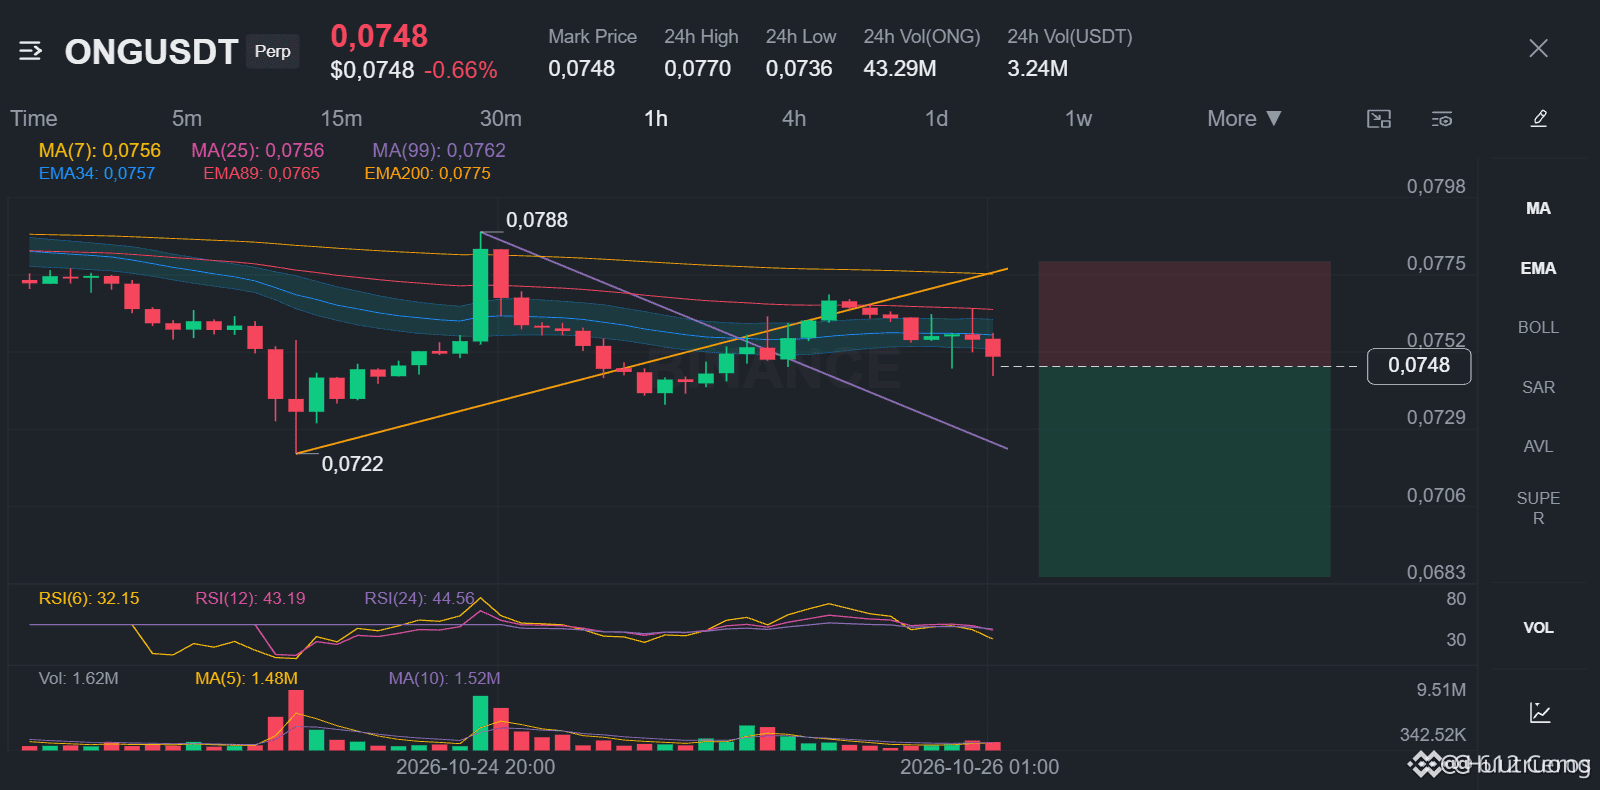
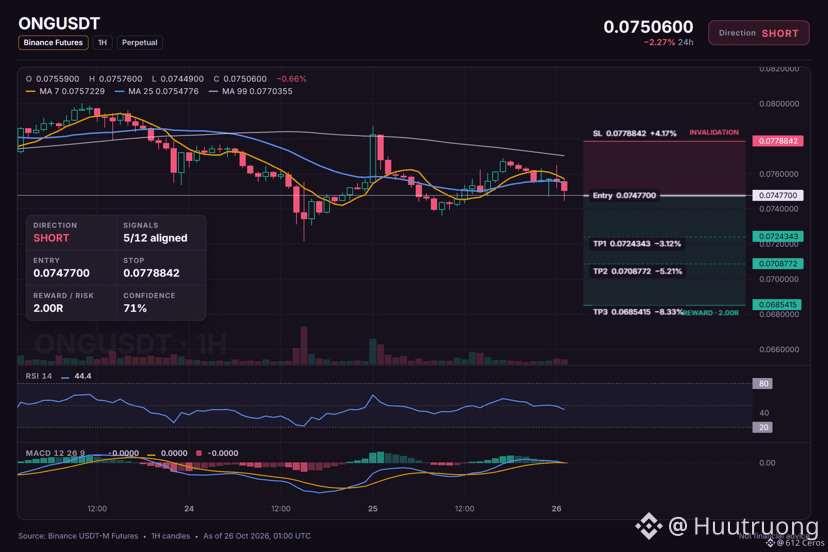
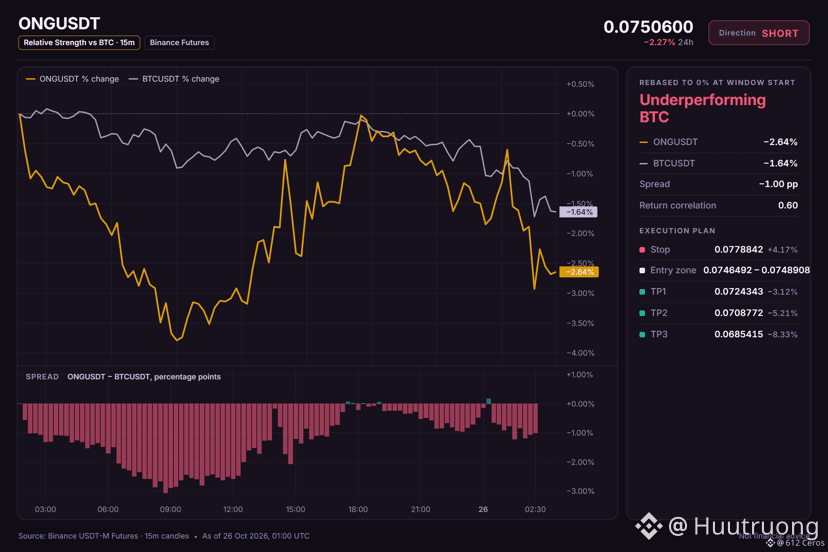
ONG parece propensa a uma queda, mas a convicção é moderada.
🔴 SHORT $ONG /USDT: esperando que o preço vá PARA BAIXO
Viés: SHORT · Tendendo
Entrada: 0.0746492 – 0.0748908
TP1: 0.0724343 (-3.1%)
TP2: 0.0708772 (-5.2%)
TP3: 0.0685415 (-8.3%)
SL: 0.0778842 (+4.2%)
Plano: entrar apenas dentro da zona, fechar 50% no TP1, 25% no TP2, 25% no TP3, e mover o stop para a entrada após o TP1.
Nota: convicção apenas moderada, mantenha tamanho leve.
Por que SHORT? 5/12 sinais concordam, 0 contra.
• tendência de 4h em queda (abaixo da EMA50 & EMA200)
• tendência de 1h em queda (abaixo da EMA50 & EMA200)
• Vendedores estão conduzindo o movimento (15m ADX 22.2)
Em palavras simples:
ONG está deslizando em uma estrutura de baixa nos timeframes de 1h e 4h, com a tendência de 4h apontando para baixo. O RSI de 1h está abaixo de 45, mostrando que os vendedores ainda têm o impulso, e o ADX mostra DI- bem acima de DI+, o que significa que os vendedores estão no controle.
Onde você colocaria seu stop para este short?
{spot}(ONGUSDT)
ONG parece propensa a uma queda, mas a convicção é moderada.
🔴 SHORT $ONG /USDT: esperando que o preço vá PARA BAIXO
Viés: SHORT · Tendendo
Entrada: 0.0746492 – 0.0748908
TP1: 0.0724343 (-3.1%)
TP2: 0.0708772 (-5.2%)
TP3: 0.0685415 (-8.3%)
SL: 0.0778842 (+4.2%)
Plano: entrar apenas dentro da zona, fechar 50% no TP1, 25% no TP2, 25% no TP3, e mover o stop para a entrada após o TP1.
Nota: convicção apenas moderada, mantenha tamanho leve.
Por que SHORT? 5/12 sinais concordam, 0 contra.
• tendência de 4h em queda (abaixo da EMA50 & EMA200)
• tendência de 1h em queda (abaixo da EMA50 & EMA200)
• Vendedores estão conduzindo o movimento (15m ADX 22.2)
Em palavras simples:
ONG está deslizando em uma estrutura de baixa nos timeframes de 1h e 4h, com a tendência de 4h apontando para baixo. O RSI de 1h está abaixo de 45, mostrando que os vendedores ainda têm o impulso, e o ADX mostra DI- bem acima de DI+, o que significa que os vendedores estão no controle.
Onde você colocaria seu stop para este short?
81
Inicia sessão para explorar mais conteúdos
Junta-te a utilizadores de criptomoedas de todo o mundo na Binance Square
⚡️ Obtém informações úteis e recentes sobre criptomoedas.
💬 Com a confiança da maior exchange de criptomoedas do mundo.
👍 Descobre perspetivas reais de criadores verificados.
E-mail/Número de telefone
Tópicos em Tendência
BinancePick
2.6M visualizações
139,074 a discutir
Participe da #TemporadaDeResultados: preveja resultados no Binance Pick e compartilhe sua opinião no Binance Square!
Binance Square Official
·400 gostos
·337.5k visualizações
EarningsSeason
5M visualizações
24,053 a discutir
StrategyMSTRSurpassesNasdaqInMarketCap
0 visualizações
0 a discutir