
📉 Altcoins Lose ~$200B as Long-Term Trend Breadth Deteriorates 🪙
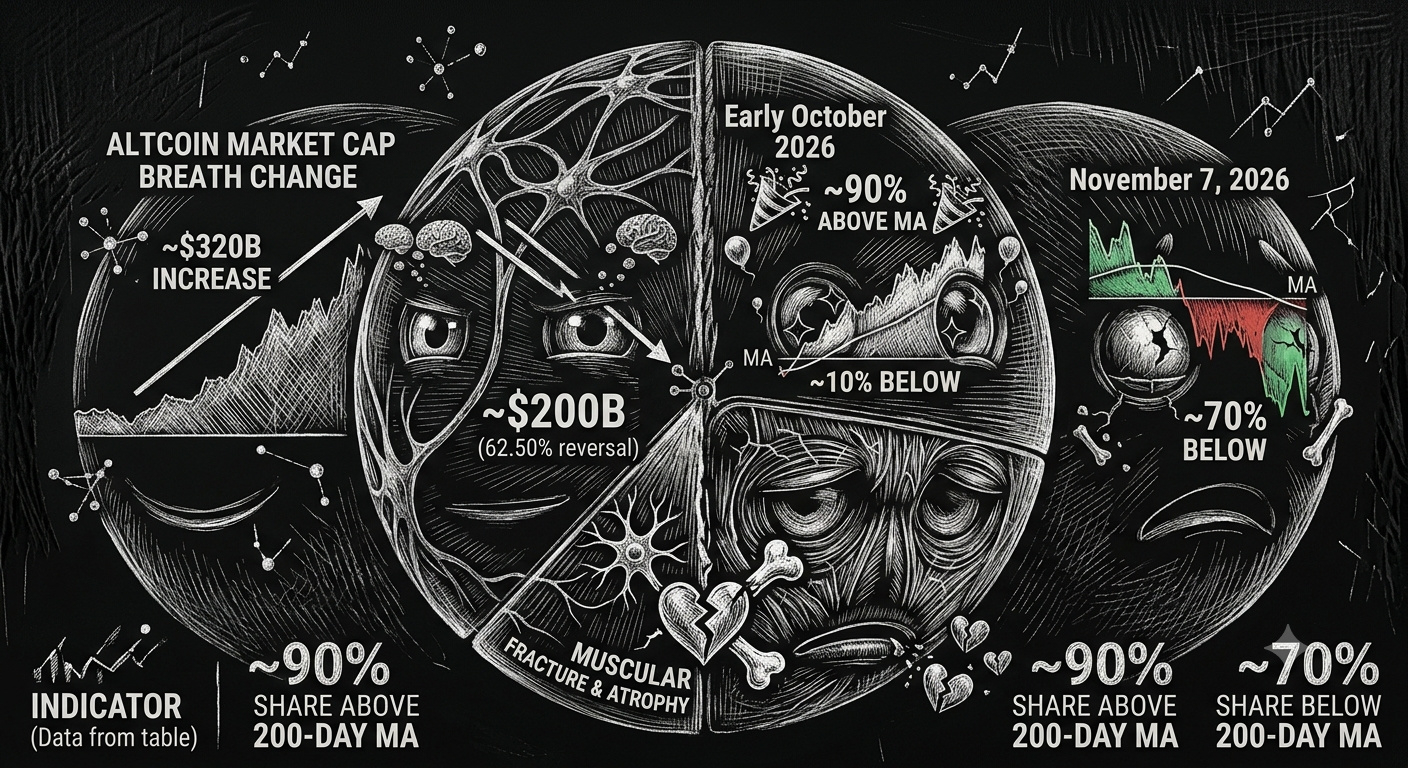
📉 Altcoin market capitalization excluding Bitcoin and stablecoins has reportedly declined by roughly $200B, reversing around 62.50% of the preceding ~$320B increase from mid-August to late September 2026. 🔍 CryptoQuant contributor Darkfost reported on 2026-11-07 that approximately 70% of Binance-listed altcoins were trading below their 200-day moving average, compared with only about 10% in early October.
📊 This is primarily a market-breadth signal: weakness is no longer limited to a small group of tokens, but has spread across much of the Binance-listed altcoin universe.
📋 Breadth: from broad participation to broad weakness 📉
Between mid-August and late September 2026, the altcoin market-cap (excluding Bitcoin and stablecoins) grew by approximately $320 billion. By November 7, 2026, the market experienced a downturn, shedding about $200 billion from its peak.
This shift is reflected in long-term trend participation relative to the 200-day moving average (MA) for Binance-listed altcoins. In early October 2026, roughly 90% of these assets traded above their 200-day moving average, while only about 10% remained below it. By November 7, 2026, market conditions deteriorated significantly: the share of altcoins above the 200-day moving average dropped to ~30%, while the share below it surged to ~70%.
This swing represents a 60-percentage-point decrease in long-term trend participation, meaning the number of assets falling below this long-term trend measure increased by roughly 7 times between early October and November 7.
💡 Why the 200-day moving average matters
📌 The 200-day moving average is widely used to assess an asset’s longer-term trend condition: 🟢 Above the 200-day average: price is generally trading above its long-term reference level. 🔴 Below the 200-day average: price is generally trading below that long-term reference level, which can reflect sustained selling pressure or weak demand. ⚠️ At 70% below: market leadership is narrow, and broad altcoin momentum is materially weaker than it was a month earlier.
🔮 The data does not establish a guaranteed future direction. ⚖️ It does show that a price rebound in a few large-cap tokens would not, by itself, mean a broad altcoin recovery unless participation improves across a wider share of assets.
💸 Capital-flow and risk-appetite interpretation
🌊 The approximate $200B drawdown may reflect a combination of deleveraging, lower liquidity in higher-beta assets, and a rotation toward more defensive or more liquid parts of the crypto market. 🌪️ In risk-off conditions, smaller-cap altcoins often experience larger percentage moves because order books can be thinner and sentiment can change quickly.
🔬 A key distinction is important: the reported market-cap change measures valuation loss across the sector; it is not a direct measure of net capital physically leaving crypto. ⚓ Price declines, supply structure, liquidity conditions, and derivative positioning can all affect aggregate market capitalization.
🚀 What could shift the breadth picture
🌱 A healthier technical backdrop would typically involve several conditions occurring together: 🔄 A sustained increase in the share of altcoins regaining their 200-day averages; 📊 Spot-market volume expanding alongside the recovery rather than relying mainly on leveraged derivatives; 🌐 Improvement across multiple sectors and market-cap tiers, rather than strength concentrated in only a few large tokens; 🛡️ Stabilization in broader risk assets and macro conditions affecting crypto liquidity.
⛈️ Conversely, if the percentage of tokens below the 200-day average remains elevated while spot participation stays weak, the market may continue to show fragile breadth even during short-term rallies.
📝 CryptoQuant’s figures are reported tracker-based market aggregates and should be treated as analytical estimates rather than independently audited totals. 🕰️ Historical breadth patterns can provide context, but they do not guarantee future performance.