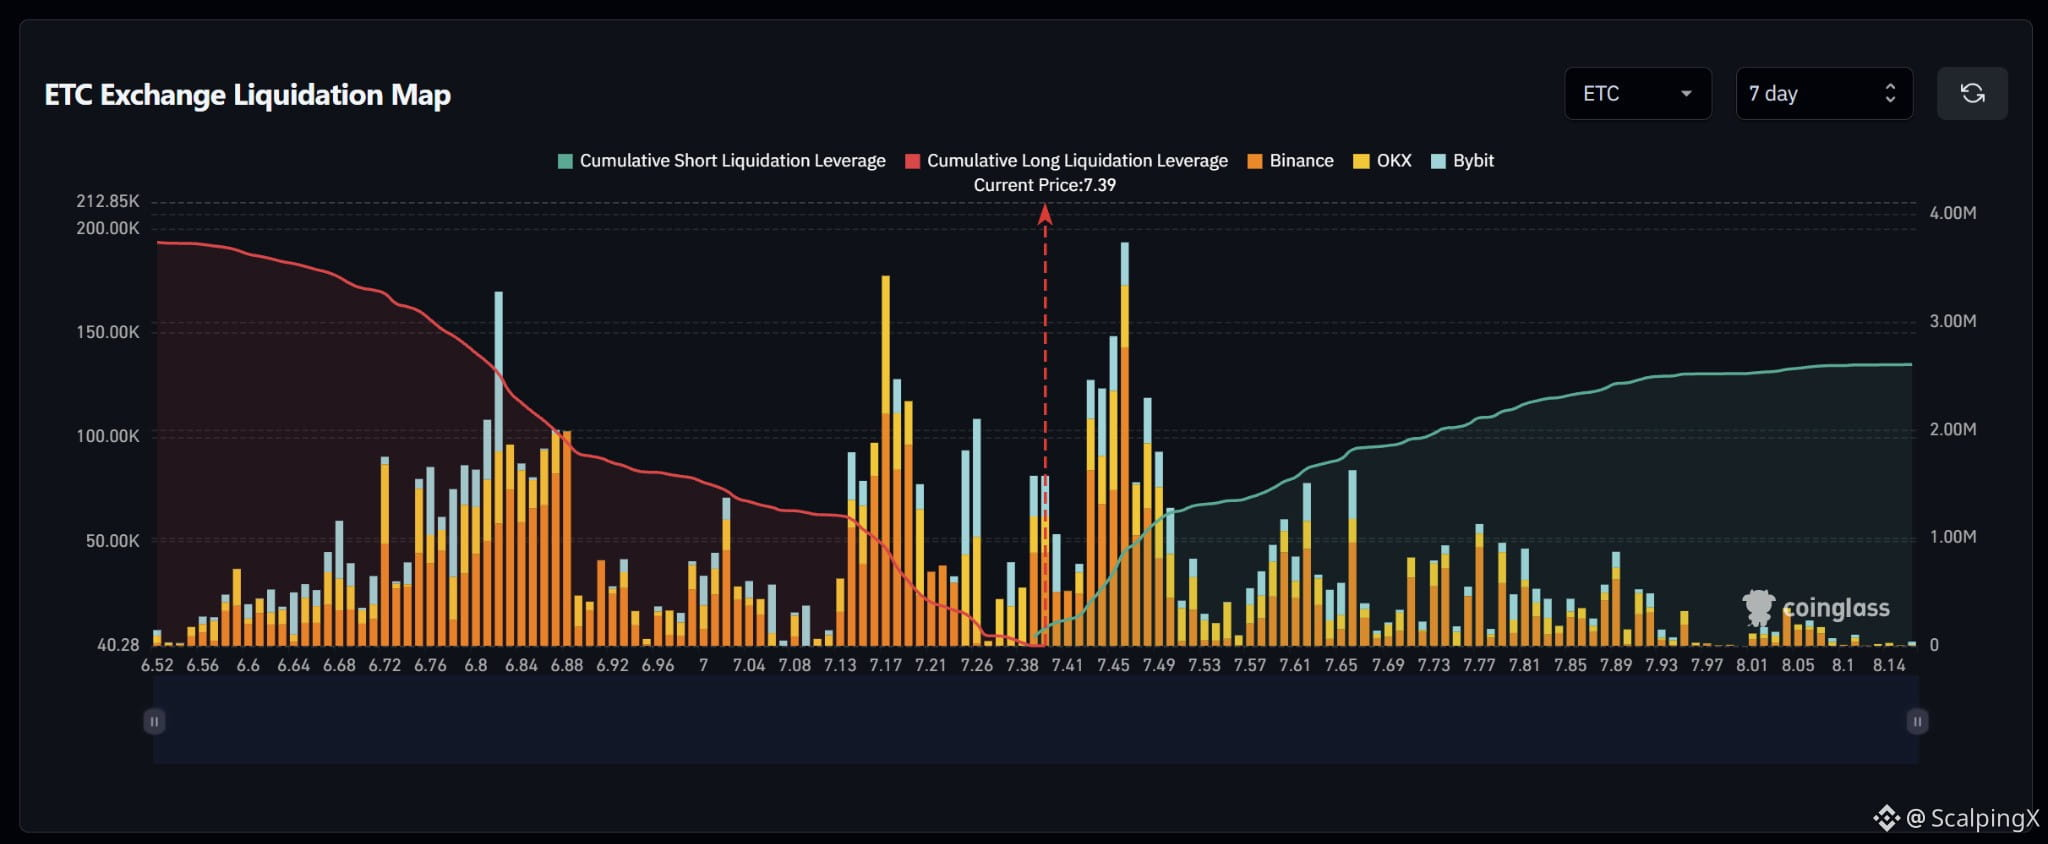
$ETC – Liquidation Map (7 days) – Index ~7.39
🧭 The preferred scenario is a short-liquidation sweep at 7.43–7.49, where bars are densely clustered close to price. Estimated cumulative long exposure exceeds the short side, but the stronger long clusters sit further below.
🔺 Clearing and holding above 7.42 shifts attention to 7.43–7.49, with the largest spike near 7.46. Short liquidations could amplify volatility here; holding the area after the sweep would support continuation.
🎯 Holding above 7.49 brings 7.58–7.66 into focus. Bars around 7.51–7.56 are relatively small and sparse. Further out, scattered clusters sit at 7.72–7.81, while additional liquidation exposure above 8.00 is limited.
⚖️ Losing 7.37 without reclaiming it weakens the upside scenario, shifting attention to 7.25–7.28, then 7.14–7.20, with a large bar near 7.17. A sweep of 7.43–7.49 followed by a quick drop below 7.42 would increase the risk of a failed upside move.
#LiquidationMap
🧭 The preferred scenario is a short-liquidation sweep at 7.43–7.49, where bars are densely clustered close to price. Estimated cumulative long exposure exceeds the short side, but the stronger long clusters sit further below.
🔺 Clearing and holding above 7.42 shifts attention to 7.43–7.49, with the largest spike near 7.46. Short liquidations could amplify volatility here; holding the area after the sweep would support continuation.
🎯 Holding above 7.49 brings 7.58–7.66 into focus. Bars around 7.51–7.56 are relatively small and sparse. Further out, scattered clusters sit at 7.72–7.81, while additional liquidation exposure above 8.00 is limited.
⚖️ Losing 7.37 without reclaiming it weakens the upside scenario, shifting attention to 7.25–7.28, then 7.14–7.20, with a large bar near 7.17. A sweep of 7.43–7.49 followed by a quick drop below 7.42 would increase the risk of a failed upside move.
#LiquidationMap