IRYS Bounces 12% and Battles the Moving Averages: Is a Breakout Coming?
Irys (IRYS) is trading around $0.021513, up 11.96% on the day, and the 4H chart shows price consolidating right at a key decision zone.
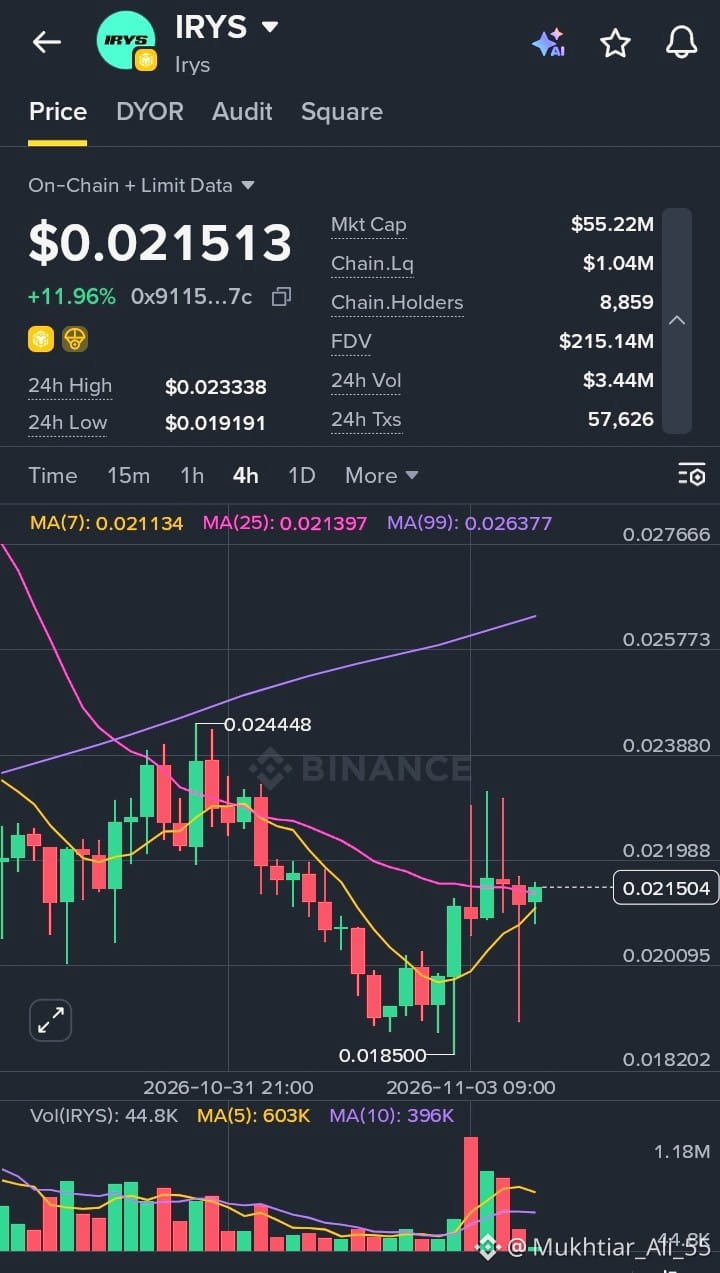
After the pullback from the $0.024448 area, IRYS slid to a low of $0.018500 and then recovered with a solid run of green candles. A sharp volume spike pushed price back up to the moving averages, and it has been moving sideways around them since.
What the chart is showing:
24h range: $0.019191 to $0.023338
24h volume: about $3.44M, with 57.6K transactions
Market cap: $55.22M, FDV: $215.14M
On-chain liquidity: about $1.04M, with roughly 8.9K holders
MA(7): 0.021134 and MA(25): 0.021397, now flat and tangled around price, which points to indecision
MA(99): 0.026377, still well overhead and acting as major resistance
Volume: a big spike during the bounce, with the MA(5) above the MA(10), though the latest bars are cooling off
My take: The recovery is real, but price is now stuck between the short-term averages and the long wick on the recent candles shows sellers are active near $0.0233. A clean 4H close above $0.0233 would be the first sign that bulls are taking control, with the $0.0244 high and then the MA(99) near $0.0264 as the next targets. On the downside, the $0.0200 zone is the first support to watch, and a loss of it could bring the $0.0185 low back into play.
Also worth noting, the FDV is nearly four times the current market cap and on-chain liquidity is fairly thin, so sharp moves can happen in either direction. I’m waiting for a clear break of this range before getting interested.
#Irys #IRYS #CryptoAnalysis #TechnicalAnalysis #Altcoins
$IRYS
Irys (IRYS) is trading around $0.021513, up 11.96% on the day, and the 4H chart shows price consolidating right at a key decision zone.
After the pullback from the $0.024448 area, IRYS slid to a low of $0.018500 and then recovered with a solid run of green candles. A sharp volume spike pushed price back up to the moving averages, and it has been moving sideways around them since.
What the chart is showing:
24h range: $0.019191 to $0.023338
24h volume: about $3.44M, with 57.6K transactions
Market cap: $55.22M, FDV: $215.14M
On-chain liquidity: about $1.04M, with roughly 8.9K holders
MA(7): 0.021134 and MA(25): 0.021397, now flat and tangled around price, which points to indecision
MA(99): 0.026377, still well overhead and acting as major resistance
Volume: a big spike during the bounce, with the MA(5) above the MA(10), though the latest bars are cooling off
My take: The recovery is real, but price is now stuck between the short-term averages and the long wick on the recent candles shows sellers are active near $0.0233. A clean 4H close above $0.0233 would be the first sign that bulls are taking control, with the $0.0244 high and then the MA(99) near $0.0264 as the next targets. On the downside, the $0.0200 zone is the first support to watch, and a loss of it could bring the $0.0185 low back into play.
Also worth noting, the FDV is nearly four times the current market cap and on-chain liquidity is fairly thin, so sharp moves can happen in either direction. I’m waiting for a clear break of this range before getting interested.
#Irys #IRYS #CryptoAnalysis #TechnicalAnalysis #Altcoins
$IRYS