
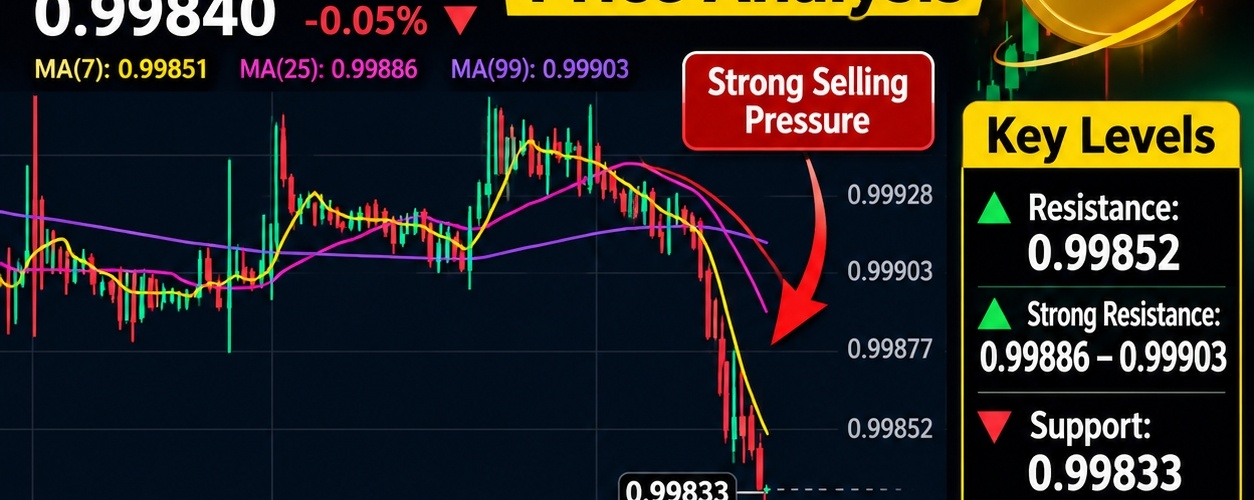

$$USD1 /USDT is currently trading around $0.99840, showing a slight decline of approximately 0.05%.
Market Overview
The 15-minute chart shows strong selling pressure. The price has dropped below all three moving averages:
- MA(7): 0.99851
- MA(25): 0.99886
- MA(99): 0.99903
This indicates short-term bearish momentum.
RSI Analysis
The RSI(6) is around 26.46, suggesting that the market is in an oversold condition. A recovery may occur, but traders should wait for confirmation before entering a position.
Important Price Levels
- Support: 0.99833
- Resistance: 0.99852
- Stronger resistance: 0.99886–0.99903
Trading Strategy

Traders should avoid rushing into buying during strong selling pressure. Watch for a stable price recovery, increased buying volume, and a break above short-term resistance before considering an entry.
Final Thoughts
USD1/USDT is showing short-term bearish signals, while its low RSI suggests possible selling exhaustion. Risk management and confirmation are essential before making any trading decision.
Trade Smart. Stay Patient. Protect Your Capital.
#BinanceRestores28FiatWithdrawals Binance #USD1 #USDT #CryptoAnalysis #TechnicalAnalysis #FATFLaunchesReviewOfCryptoHubsMoneyLaunderingControls TradingStrategy