JCT Breaks Down Hard: Is Janction Close to Finding a Floor?
Opened the JCT (Janction) 4H chart, and it’s been a rough session for holders.
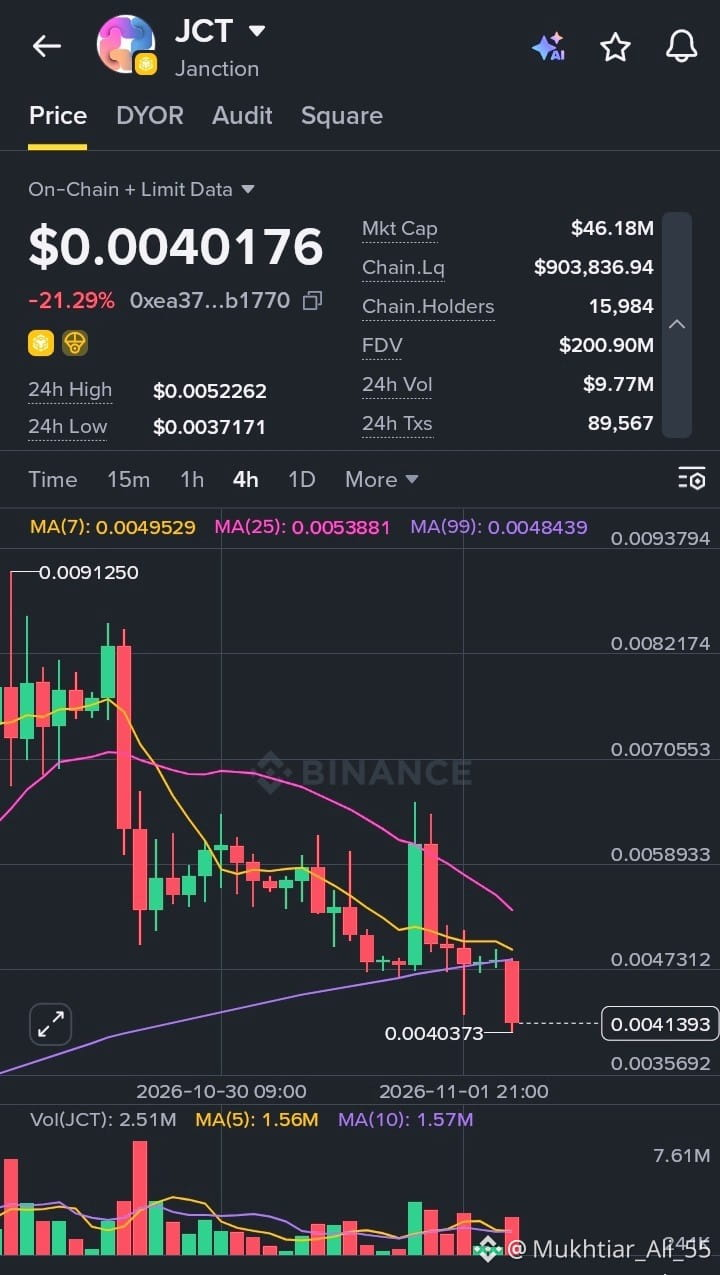
Price is trading around $0.0040176, down 21.29% on the day. The 24h range runs from $0.0037171 to $0.0052262, so price is sitting near the bottom of that range. Market cap is about $46.18M with an FDV of $200.90M, and 24h volume came in at roughly $9.77M across 89,567 transactions. On-chain liquidity is only around $903K, with 15,984 holders, so this is a thin market where moves can get sharp.
What the chart is showing:
A long, steady downtrend. JCT has been sliding since the $0.0091 high, with lower highs forming along the way and only brief bounces that failed to hold.
A failed recovery attempt. The large green candle earlier pushed price toward the $0.0060 area, but sellers took it back quickly. That rejection kept the bearish structure intact.
A fresh breakdown. The latest heavy red candle dropped price below the MA(99) at 0.0048439, a level that had been acting as support. The MA(7) at 0.0049529 and MA(25) at 0.0053881 are both above price and sloping down.
Selling volume is picking up. The most recent red bar has noticeably higher volume than the recent average, which suggests the breakdown has real selling pressure behind it rather than being a quiet drift.
What I’m watching:
The $0.0037 to $0.0040 zone is the immediate support, where the 24h low and the recent wick sit. If it holds and price reclaims the MA(99) near $0.0048, that would be the first sign sellers are losing control. If it breaks, there isn’t much structure below on this chart, so the downside could extend quickly.
After a 20%+ drop, I’d rather wait for price to stabilize and show a higher low than try to catch the falling knife.
#Janction #JCT #CryptoAnalysis #TechnicalAnalysis #AltcoinWatch
$JCT
Opened the JCT (Janction) 4H chart, and it’s been a rough session for holders.
Price is trading around $0.0040176, down 21.29% on the day. The 24h range runs from $0.0037171 to $0.0052262, so price is sitting near the bottom of that range. Market cap is about $46.18M with an FDV of $200.90M, and 24h volume came in at roughly $9.77M across 89,567 transactions. On-chain liquidity is only around $903K, with 15,984 holders, so this is a thin market where moves can get sharp.
What the chart is showing:
A long, steady downtrend. JCT has been sliding since the $0.0091 high, with lower highs forming along the way and only brief bounces that failed to hold.
A failed recovery attempt. The large green candle earlier pushed price toward the $0.0060 area, but sellers took it back quickly. That rejection kept the bearish structure intact.
A fresh breakdown. The latest heavy red candle dropped price below the MA(99) at 0.0048439, a level that had been acting as support. The MA(7) at 0.0049529 and MA(25) at 0.0053881 are both above price and sloping down.
Selling volume is picking up. The most recent red bar has noticeably higher volume than the recent average, which suggests the breakdown has real selling pressure behind it rather than being a quiet drift.
What I’m watching:
The $0.0037 to $0.0040 zone is the immediate support, where the 24h low and the recent wick sit. If it holds and price reclaims the MA(99) near $0.0048, that would be the first sign sellers are losing control. If it breaks, there isn’t much structure below on this chart, so the downside could extend quickly.
After a 20%+ drop, I’d rather wait for price to stabilize and show a higher low than try to catch the falling knife.
#Janction #JCT #CryptoAnalysis #TechnicalAnalysis #AltcoinWatch
$JCT