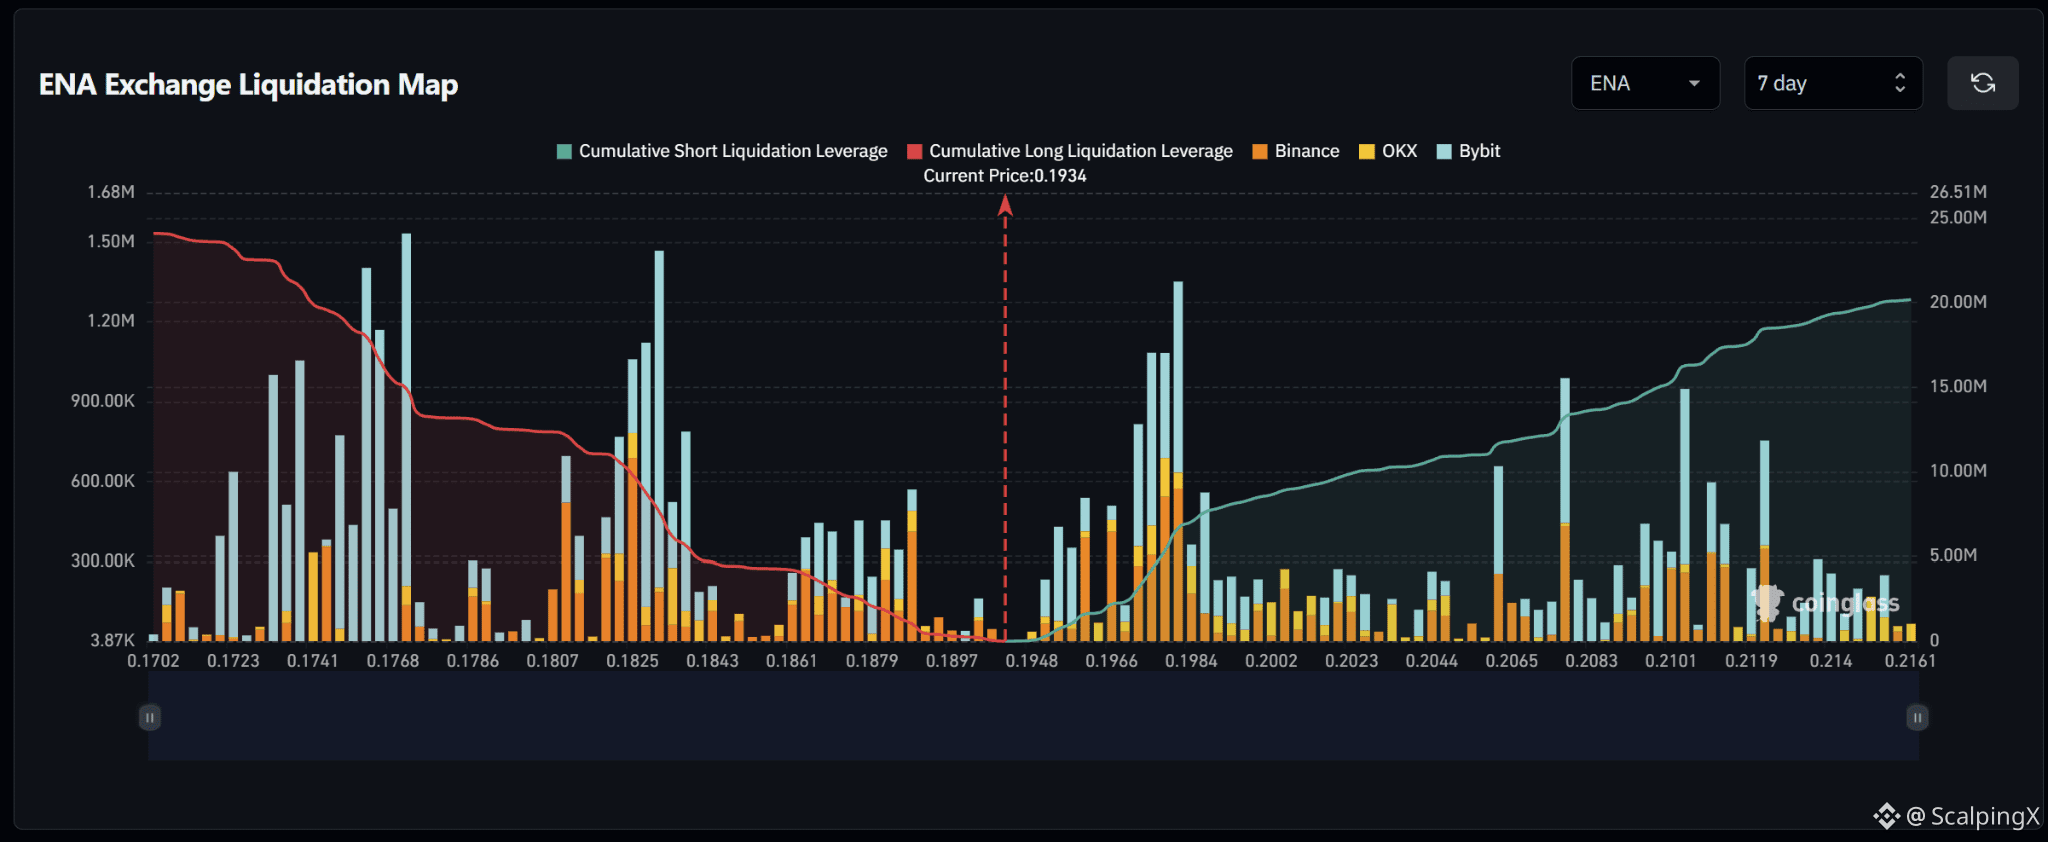
$ENA – Liquidation Map (7 days) – Index ~0.1934
🧭 The preferred scenario is an upside short sweep first. Nearby clusters sit at 0.1945–0.1983, while the major long cluster lies farther away around 0.182–0.184. Cumulative long exposure is larger across the displayed range, but nearby positioning favors an initial move higher.
🔺 The first target is 0.1945–0.1967. A break and hold above 0.1967 shifts attention to the prominent short cluster at 0.1973–0.1983. Liquidations there could amplify the advance.
🎯 Holding above 0.1984 after a sweep brings 0.206–0.208, then 0.210–0.2125, into focus as farther targets. Density through 0.199–0.205 is relatively thin, requiring additional buying pressure to sustain the advance.
⚖️ Losing 0.192 without a reclaim weakens the upside bias and shifts attention to 0.1865–0.1888, then 0.182–0.184 if the decline continues. Avoid chasing a sweep of 0.1973–0.1983 that quickly falls back below 0.1973.
#LiquidationMap
🧭 The preferred scenario is an upside short sweep first. Nearby clusters sit at 0.1945–0.1983, while the major long cluster lies farther away around 0.182–0.184. Cumulative long exposure is larger across the displayed range, but nearby positioning favors an initial move higher.
🔺 The first target is 0.1945–0.1967. A break and hold above 0.1967 shifts attention to the prominent short cluster at 0.1973–0.1983. Liquidations there could amplify the advance.
🎯 Holding above 0.1984 after a sweep brings 0.206–0.208, then 0.210–0.2125, into focus as farther targets. Density through 0.199–0.205 is relatively thin, requiring additional buying pressure to sustain the advance.
⚖️ Losing 0.192 without a reclaim weakens the upside bias and shifts attention to 0.1865–0.1888, then 0.182–0.184 if the decline continues. Avoid chasing a sweep of 0.1973–0.1983 that quickly falls back below 0.1973.
#LiquidationMap