

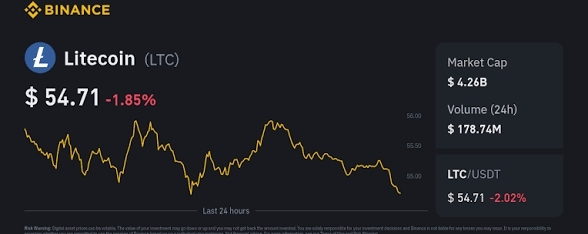

$LTC /USD Technical Analysis — October 31, 2026


### $55.06
Latest retrieved technical snapshot · October 31, 2026
Bearish
Litecoin is showing a bearish short-term trend, with the price near an important support area. The latest technical snapshot reports an RSI of 37.6 on the daily chart, indicating weak momentum, while the 4-hour and weekly outlooks are also bearish. COINOTAG
### 1\. Key support and resistance levels
Resistance 3
### $62.36
Resistance 2
### $59.23
Resistance 1
### $57.17
Current price
### $55.06
Support 1
### $55.03
Support 2
### $53.22
Support 3
### $51.44
Technical levels from the latest retrieved daily-chart analysis. COINOTAG
### 2\. Trading scenarios
Bearish scenario — preferred until resistance breaks
If LTC breaks below $55.03 and confirms the move, the next potential downside levels are $53.22 and $51.44.
Bullish scenario — requires confirmation
If LTC holds support and reclaims $57.17, a recovery toward $59.23 becomes possible. A stronger bullish reversal would require sustained buying pressure.
Sideways scenario
If price stays between $55.03 and $57.17, LTC may consolidate. Avoid assuming a breakout before a candle closes beyond this range.
### 3\. Possible trade setup
These are illustrative setups based on the retrieved levels, not guaranteed entry signals.
| Setup | Confirmation | Potential target |
| -------- | ----------------------------- | --------------------- |
| Short | Break and retest below $55.03 | $53.22 |
| Long | Break and retest above $57.17 | $59.23 |
| No trade | Price remains between levels | Wait for confirmation |
Use a stop-loss appropriate to your timeframe and position size. Crypto prices can move sharply, especially when using leverage.
### 4\. Final outlook
* 4-hour chart: Bearish.
* Daily chart: Bearish, with RSI around 37.6.
* Weekly chart: Bearish according to the latest retrieved technical snapshot.
* Important support: $55.03.
* Important resistance: $57.17.
My view: LTC/USD currently favors a cautious, bearish approach. A confirmed break below $55.03 would strengthen the downside case; a sustained move above $57.17 would weaken it. These levels are from the latest retrieved snapshot, not a verified live exchange feed. COINOTAG
For a more precise entry, tell me which timeframe you trade:
Chart timeframe
5-minute — scalping
15-minute — intraday
1-hour — short-term trading
4-hour — swing trading
Daily — longer-term trend
What do y
ou need?
Buy / Long setup
Sell / Short setup
Both Long and Short setups
Analyze my trading setup.