


Introductions
Gold remains one of the most closely watched assets in the financial markets. The XAUUSDT trading pair allows traders to follow gold's price movements against USDT. Understanding market trends, support, resistance, and risk management is essential before making any trading decision.
📊 Current Market Overview
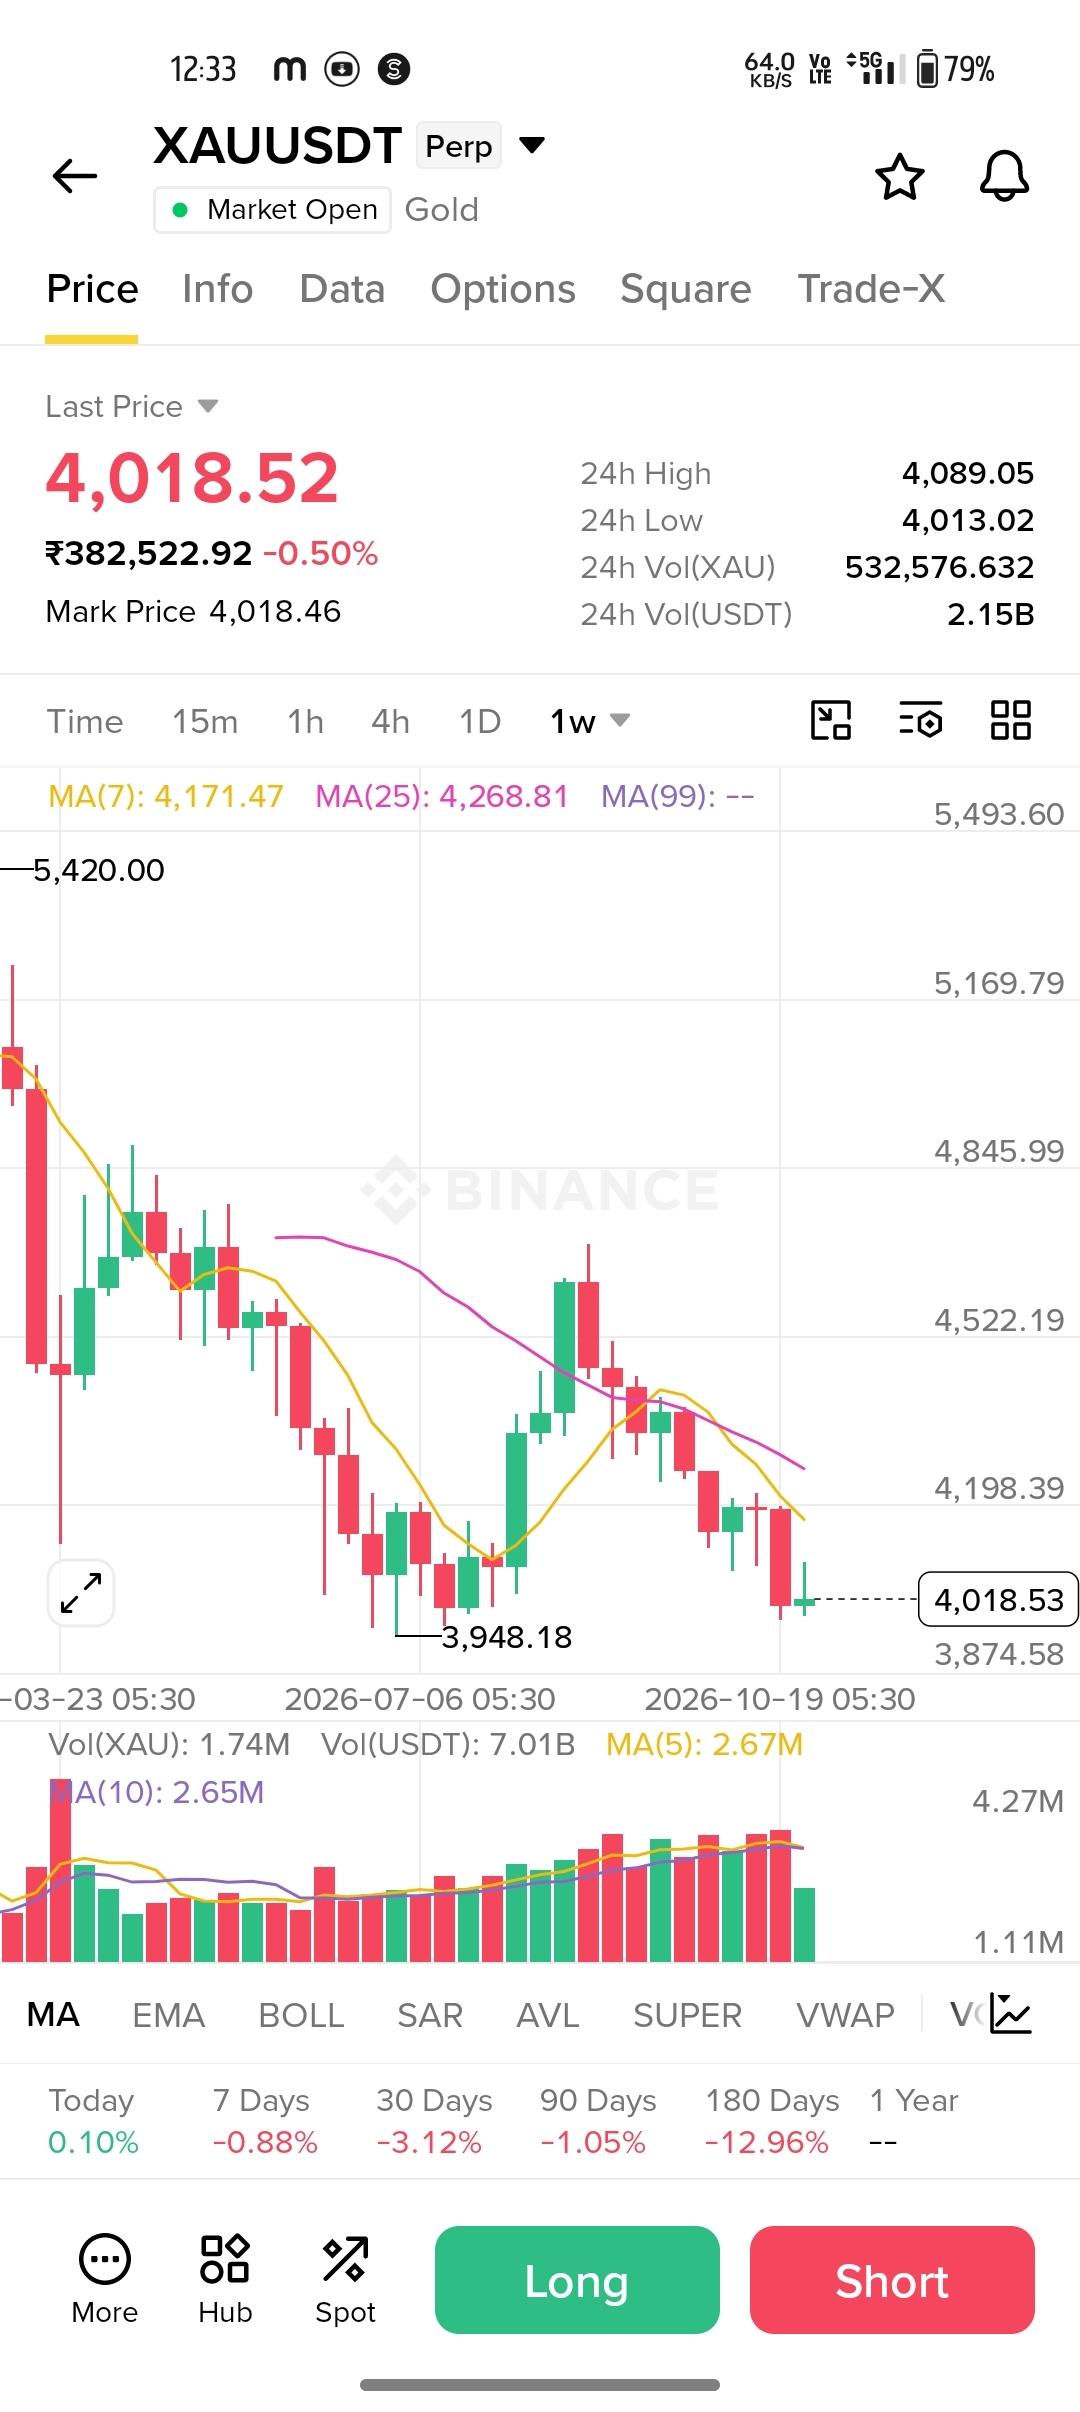
Based on the chart observed:
- Current Price: 4,018.52 USDT
- 24H High: 4,089.05
- 24H Low: 4,013.02
- MA(7): 4,171.47
- MA(25): 4,268.81
The weekly chart shows bearish pressure, with the current price trading below both the 7-period and 25-period moving averages.
🔴 Important Resistance Zone
The 4,170–4,270 region is an important area to watch. If the price moves back above this zone and holds there, it could indicate a potential recovery. However, confirmation is necessary before drawing conclusions.
🟢 Key Support Level
The 3,948 level is a notable previous low on the chart. If the price breaks below this level, further downside may be possible. If support holds, buyers could attempt a rebound.
📈 Bullish or 📉 Bearish?
At the moment, the weekly chart looks bearish. However, market conditions can change quickly. Traders should watch price action, trading volume, and confirmation around key levels instead of predicting the next move with certainty.
🛡️ Risk Management Matters
Successful trading is not only about predicting direction. It is also about protecting capital, avoiding excessive leverage, and having a clear risk-management plan.
Never risk money you cannot afford to lose.
💬 Join the Discussion
What is your view on XAUUSDT?
🐂 BULLISH: Gold could recover.
🐻 BEARISH: Gold could continue lower.
Share your thoughts in the comments!
#xauusdt #GOLD #TechnicalAnalysiss #BinanceSquare #cryptotrading 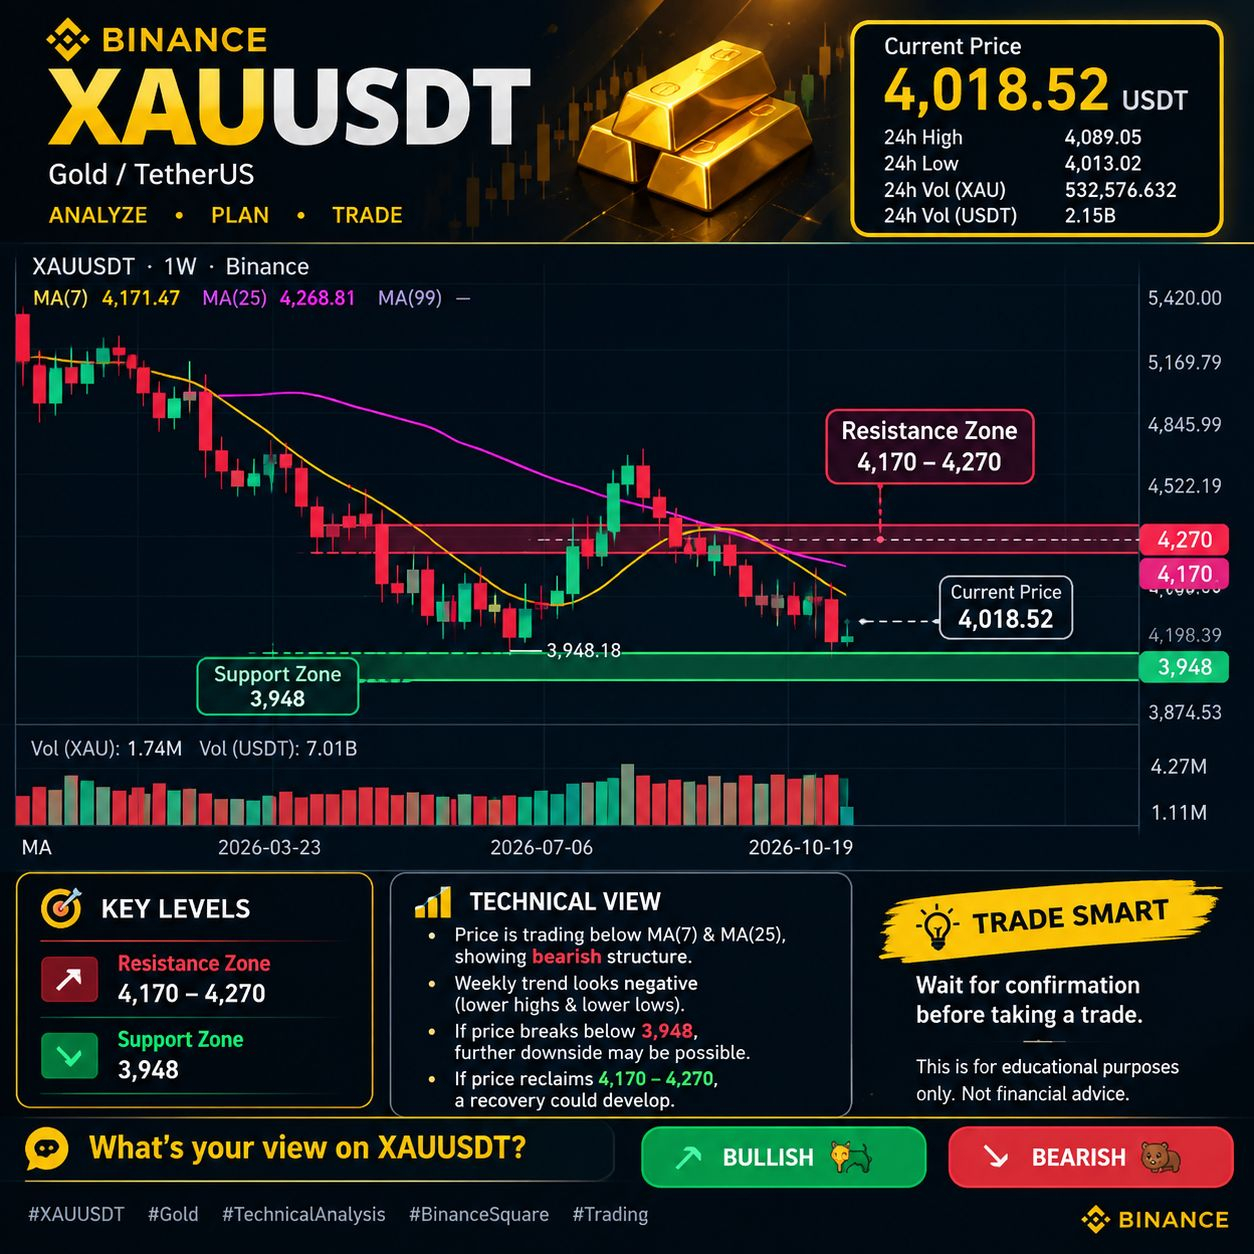
Disclaimer: This article is for educational purposes only and is not financial advice. The analysis is based on the chart snapshot provided and may not reflect current market conditions.