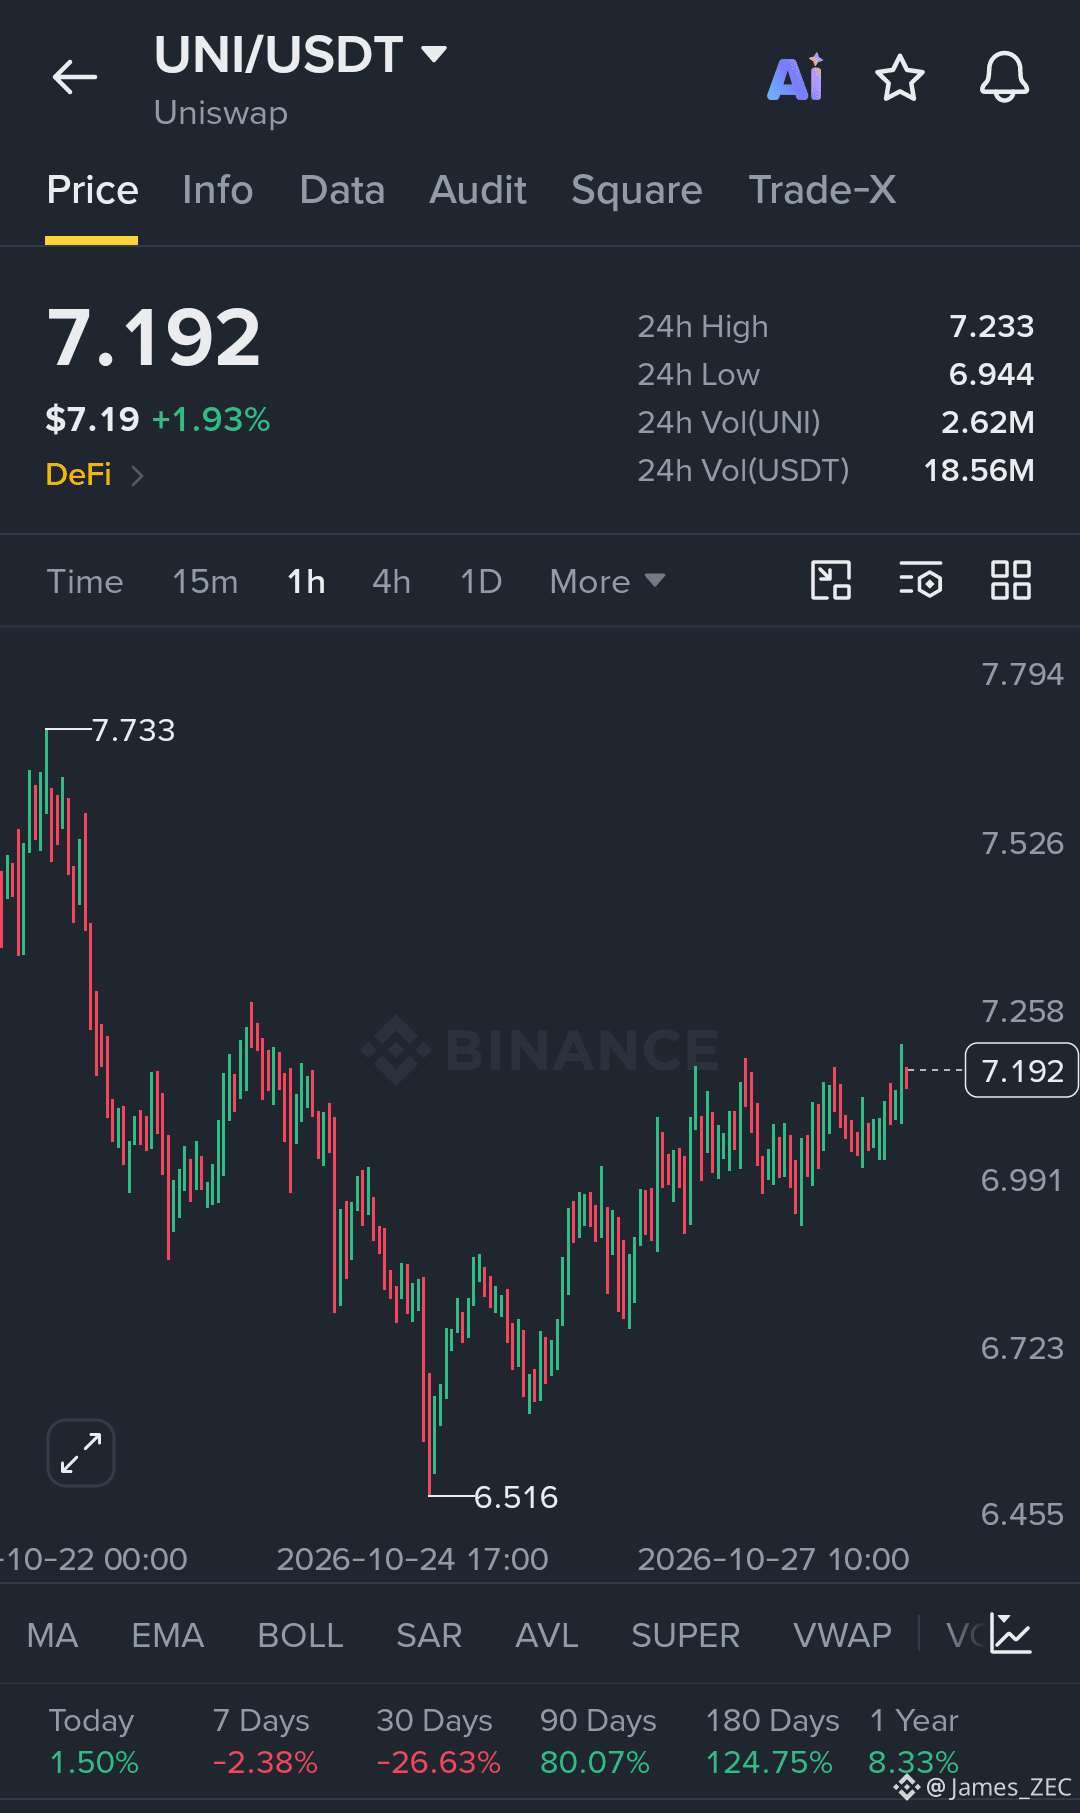
$UNI Recovery Momentum Long Setup
Long Setup
Entry Zone: 7.08 – 7.16
Stop Loss: 6.92
TP1: 7.26
TP2: 7.40
TP3: 7.55
Chart Analysis
UNIUSDT is showing improving bullish momentum on the 1-hour chart after recovering from the 6.516 swing low. Price has formed a series of higher lows during the recent rebound and is now trading near 7.192, approaching short-term resistance.
The 7.23–7.26 area is the immediate hurdle. A confirmed breakout above this zone could open the way toward 7.40 and 7.55. If price retraces, the 7.08–7.16 zone may provide a potential support retest, provided buyers defend it.
Entry Strategy: Prefer a pullback with bullish confirmation or a confirmed breakout and retest above 7.26. Avoid entering blindly near resistance.
Invalidation: A sustained move below 6.92 weakens the bullish setup.
Manage risk carefully and limit risk to 1–3% of your deposit per trade. Targets are potential levels, not guaranteed outcomes.
$EVAA
$AIN