Squeeze Alert on $ZEC: What the Last 10 Squeezes Did 📜
TL;DR: Volatility is coiling; top traders more bullish than the crowd. History leans up (6/10). Price 1,298.28, daily RSI 50.
🧩 The setup in 3 points
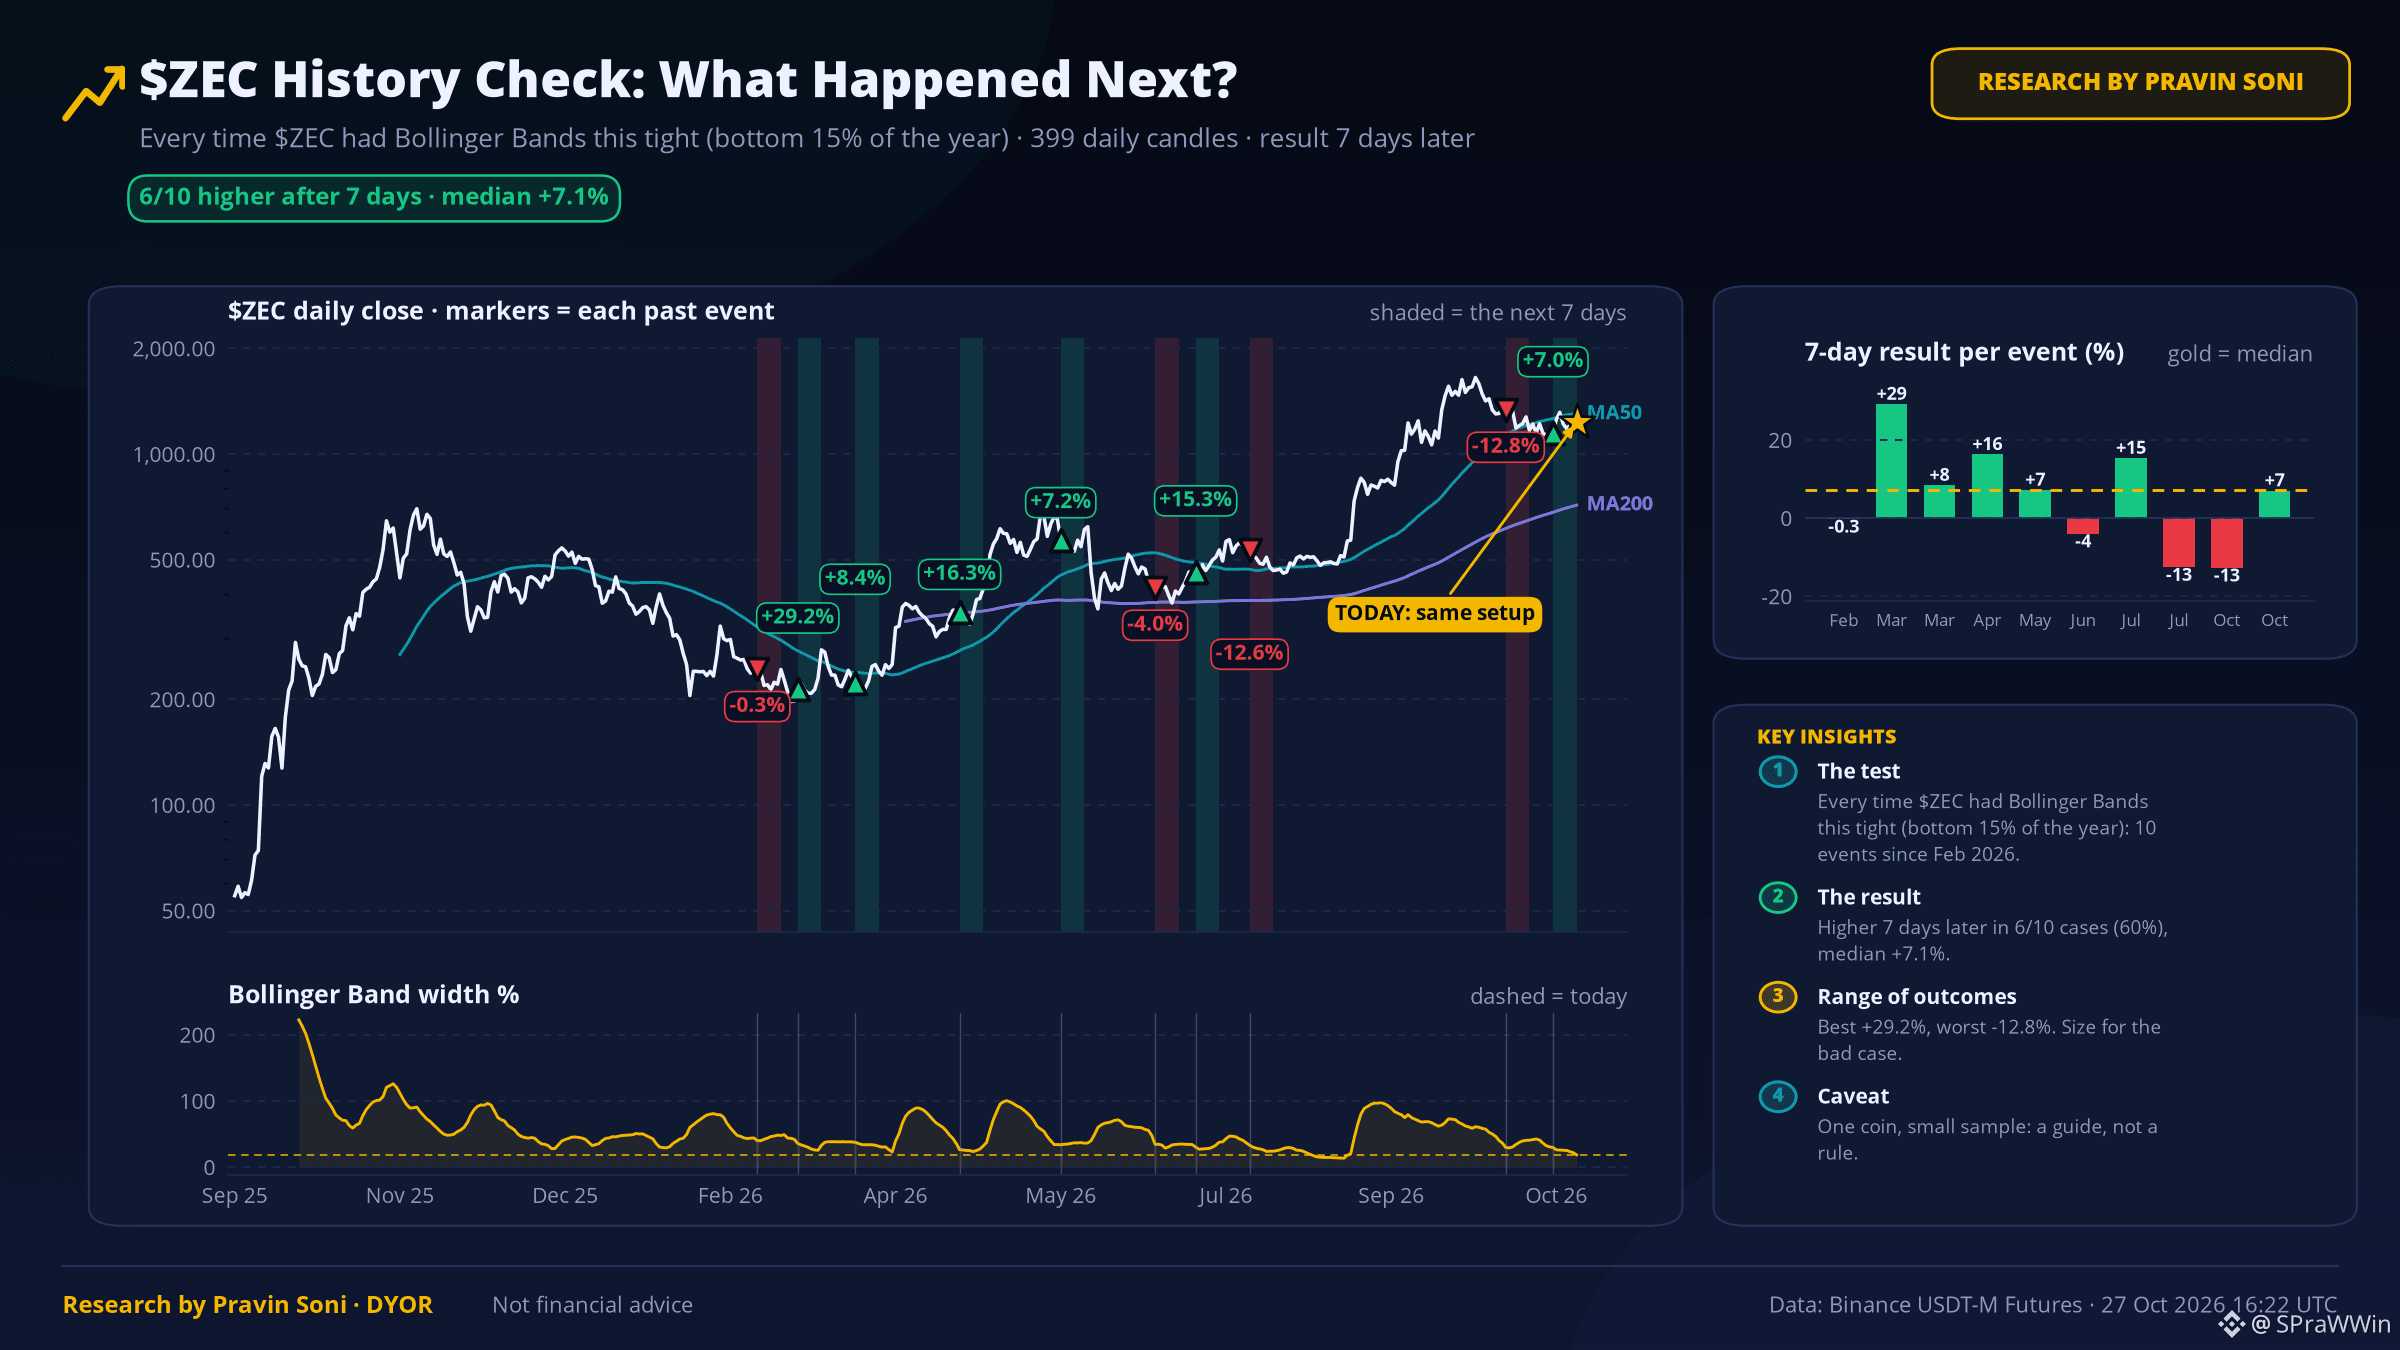
1️⃣ Bollinger Bands are the tightest in months (bottom 3% of the past year). Tight ranges usually end with a big move — direction not given.
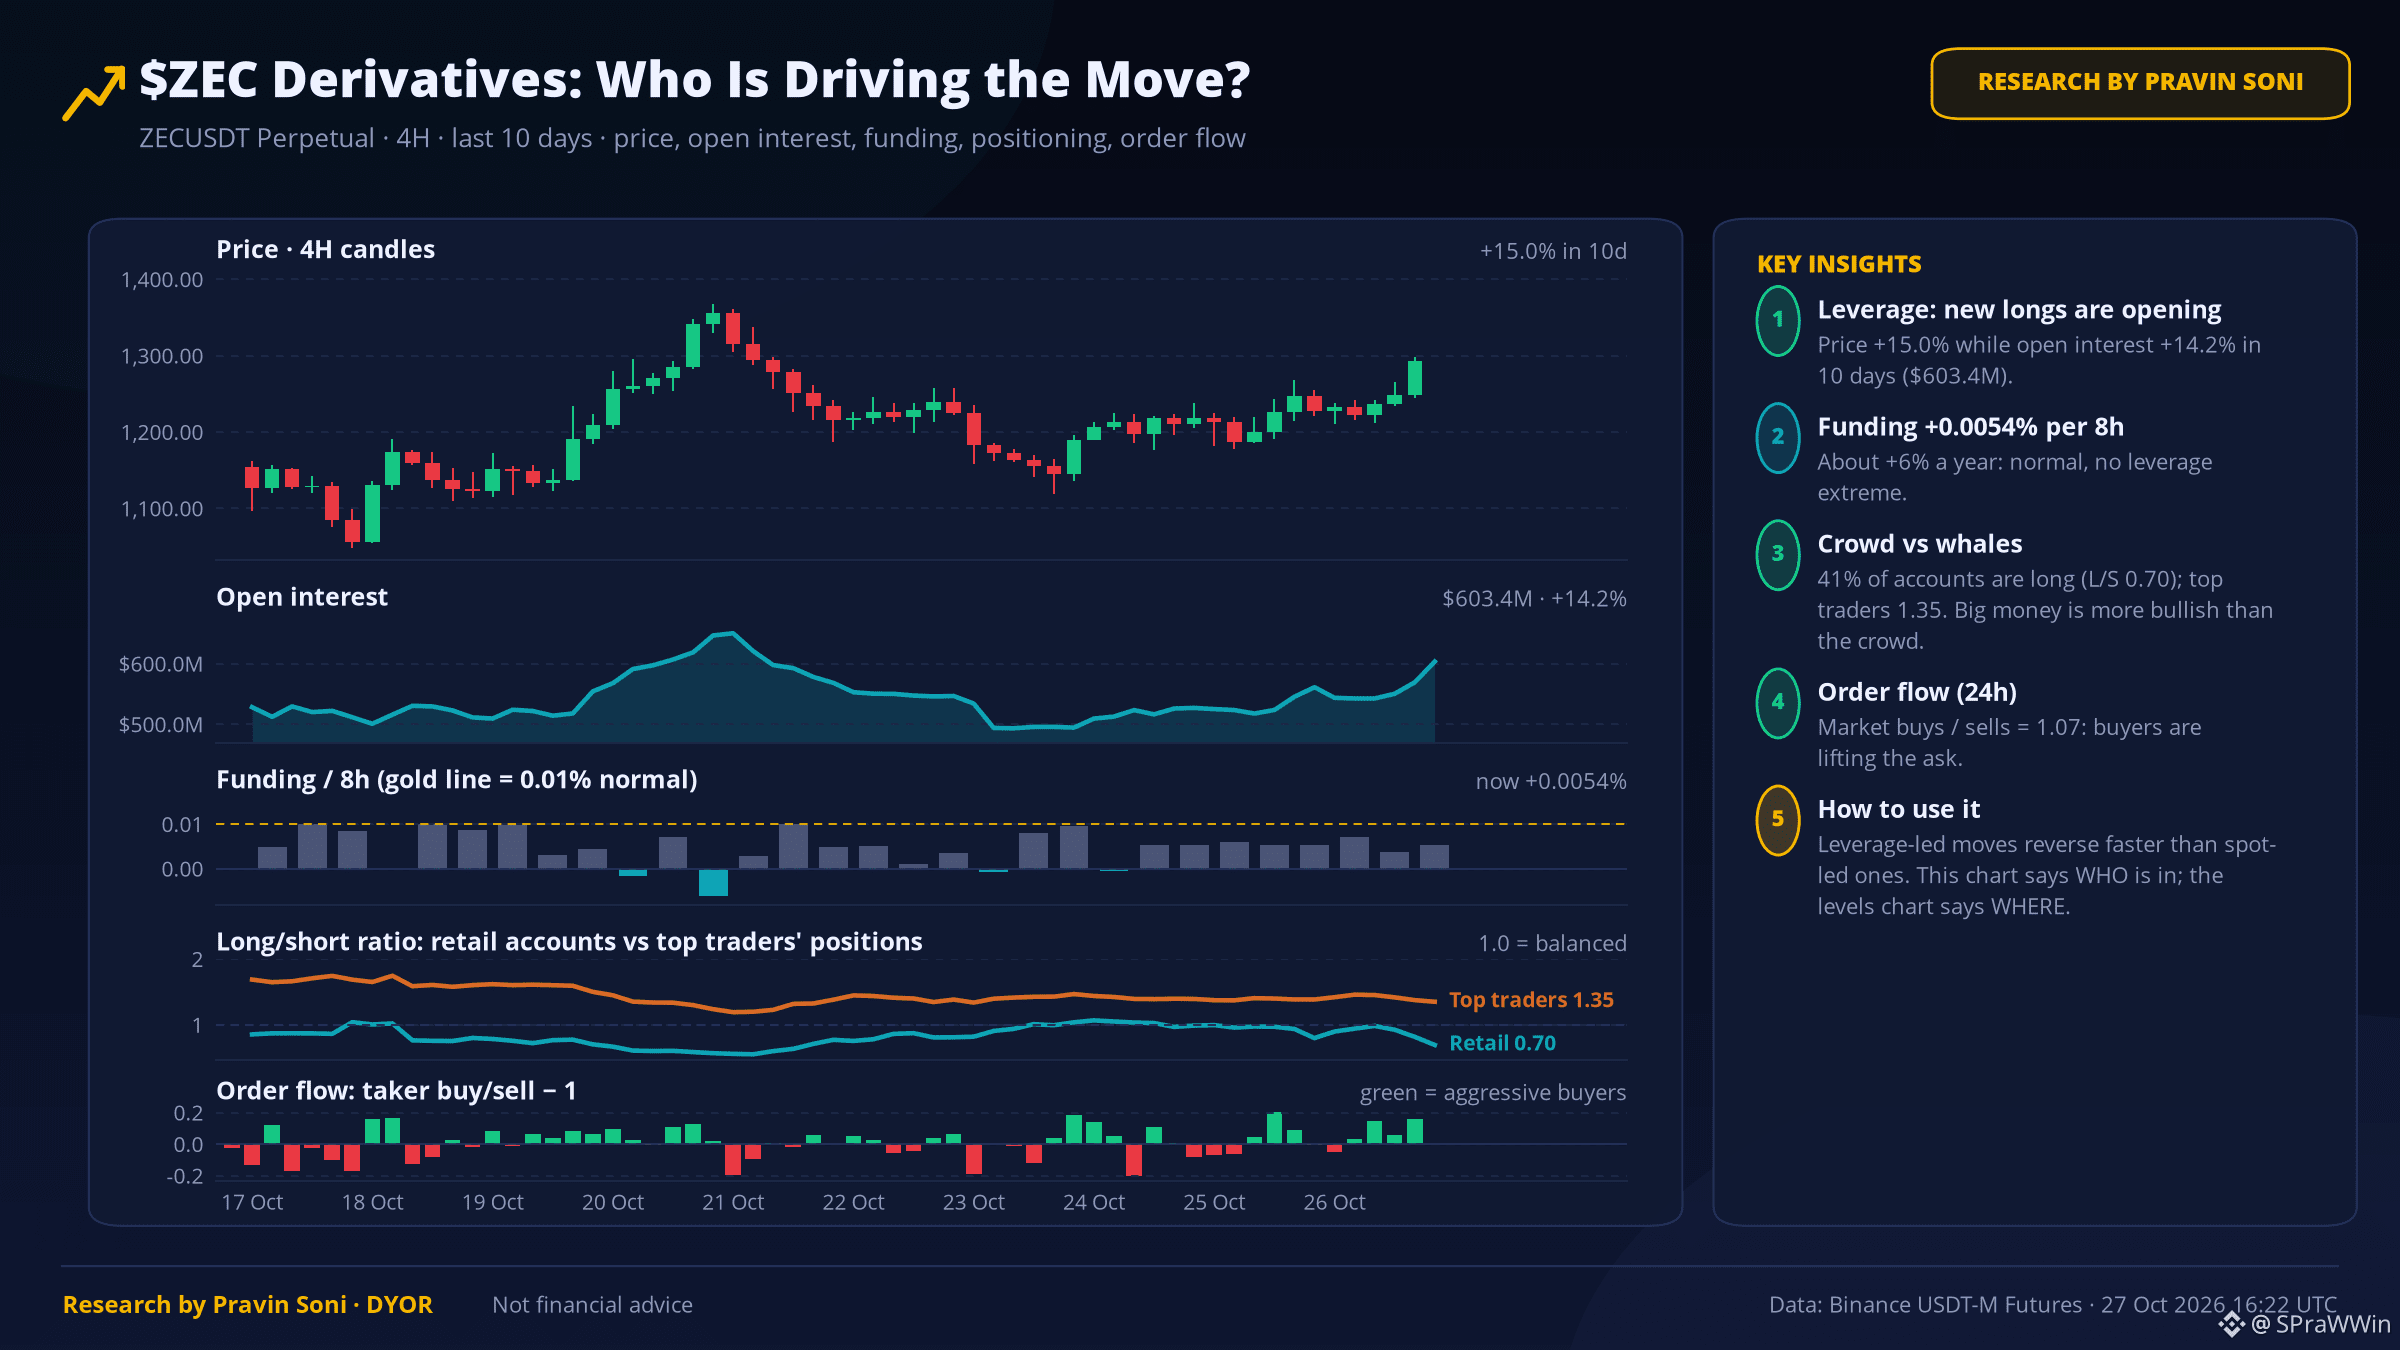
2️⃣ Top traders' position ratio is 1.35 vs their account ratio 0.65 — big money is leaning long.
3️⃣ Over 30 days it is trailing $BTC by 16.9 points (7D: +14.4).
📜 What history says
The last 10 times $ZEC had Bollinger Bands this tight (bottom 15% of the year), it was higher 7 days later in 6 of 10 cases (median +7.1%). Small sample, so a guide, not a rule.
📐 How far could it move?
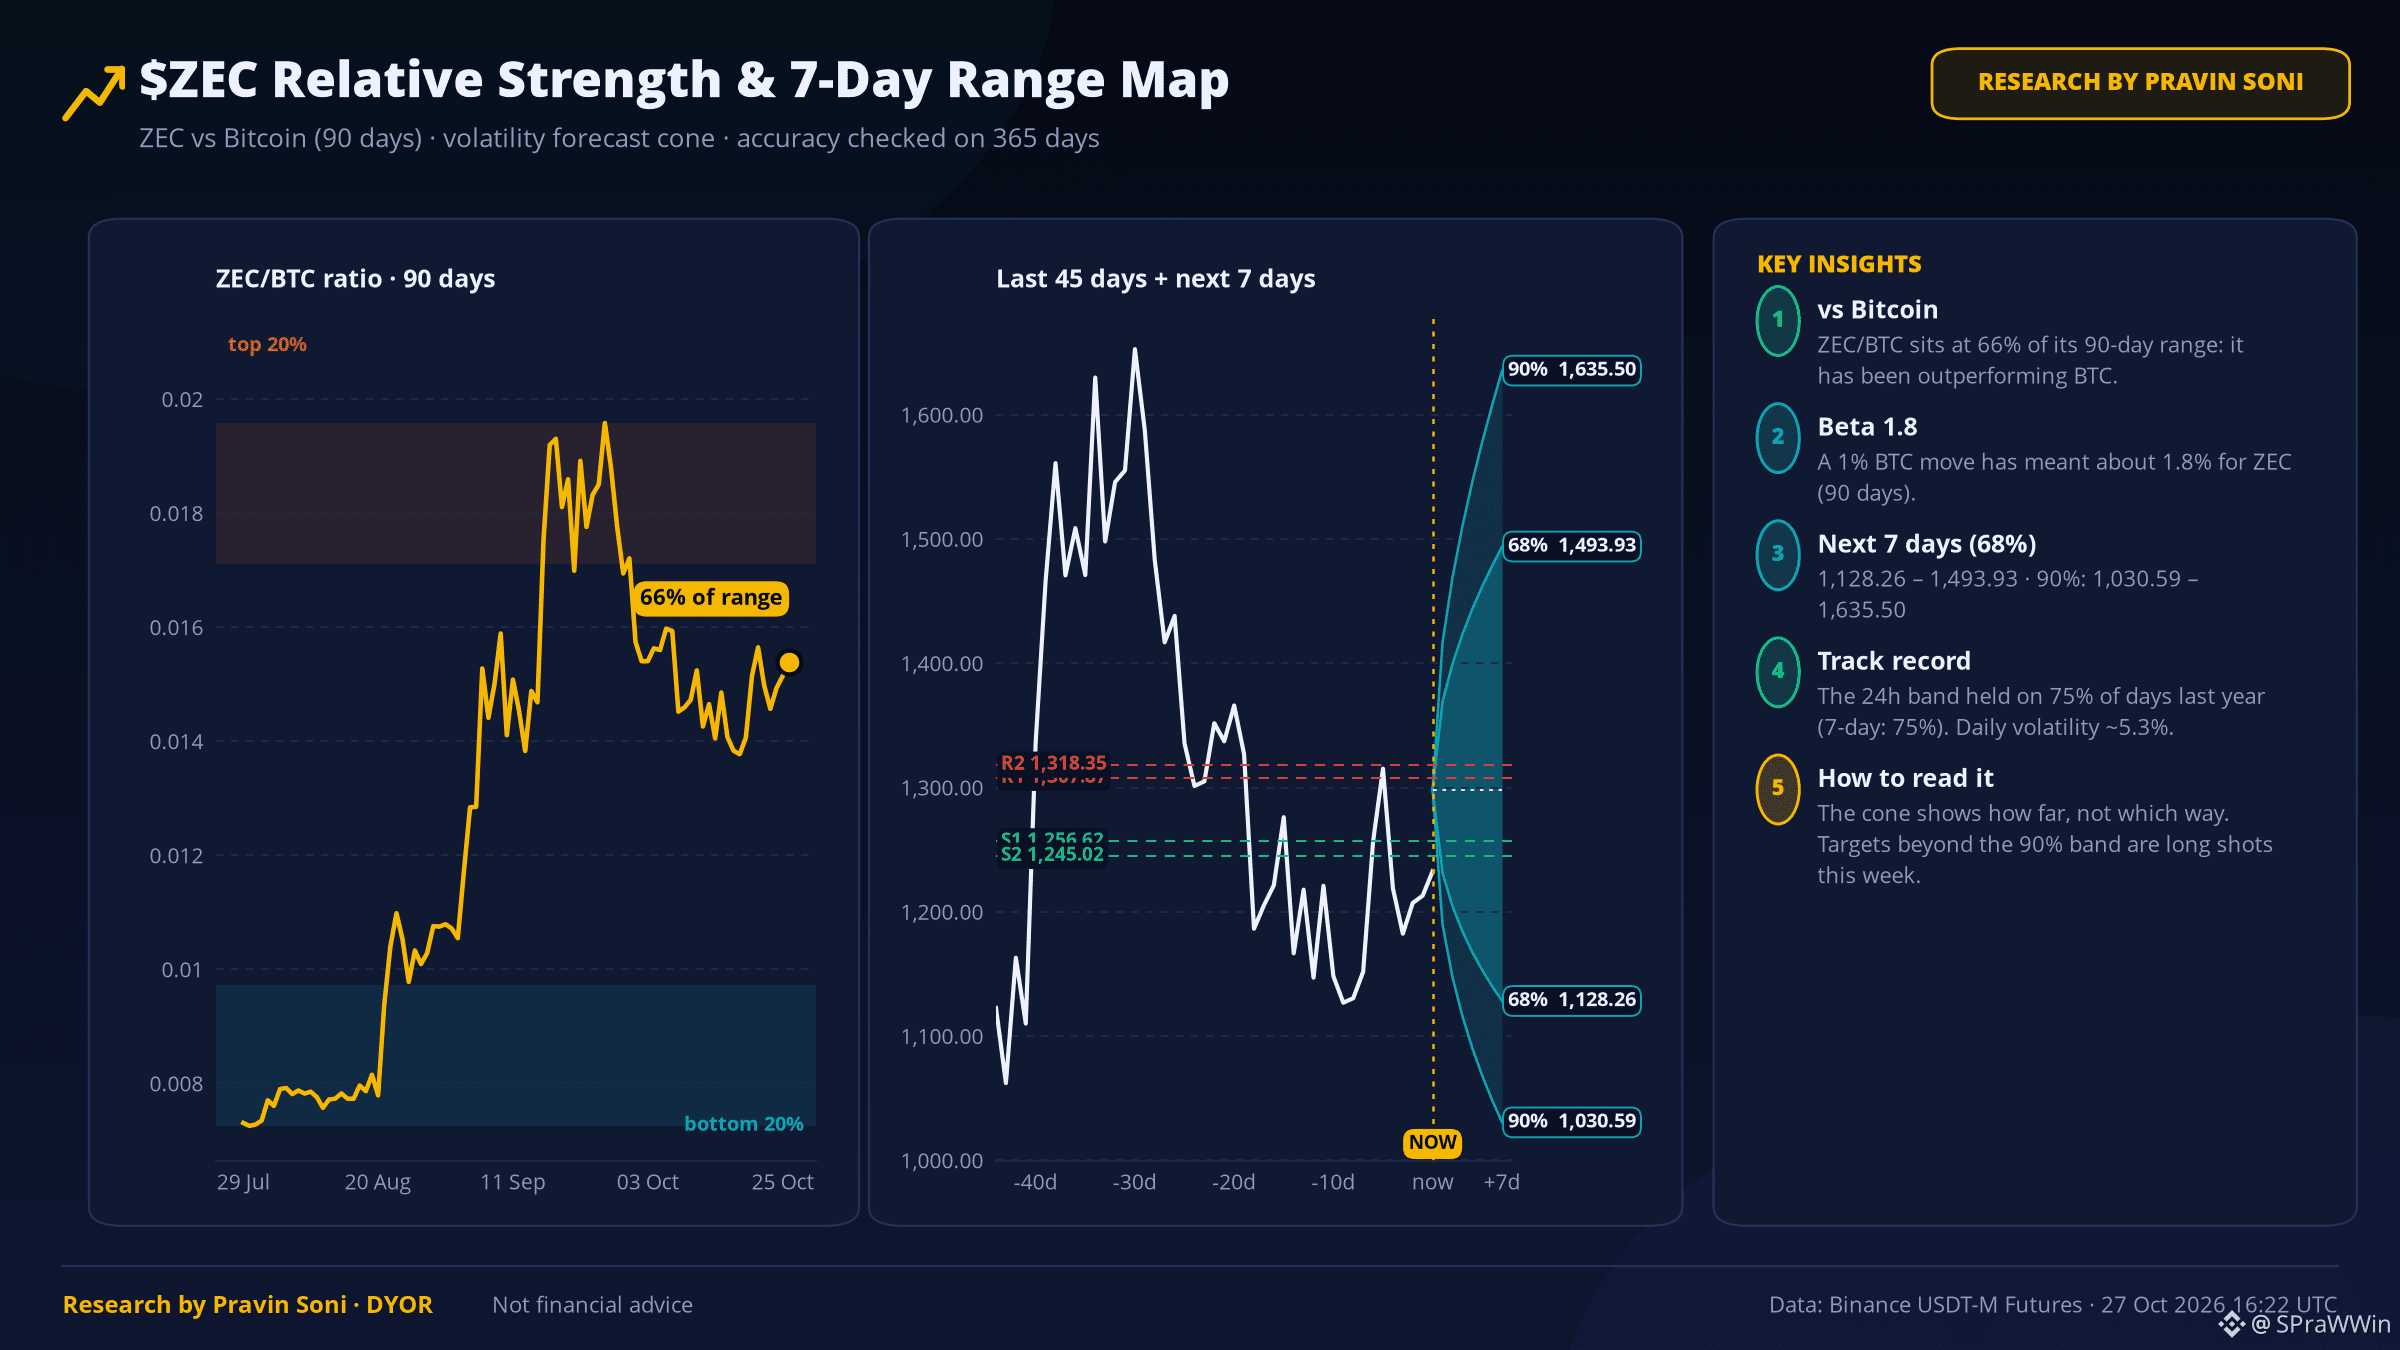
68% band: 1,128.26 – 1,493.93 · 90% band: 1,030.59 – 1,635.50
This band held on 75% of days last year. It shows how far, not which way.
vs $BTC: ZEC/BTC sits at 66% of its 90-day range, beta 1.8.
🚦 The lines in the sand
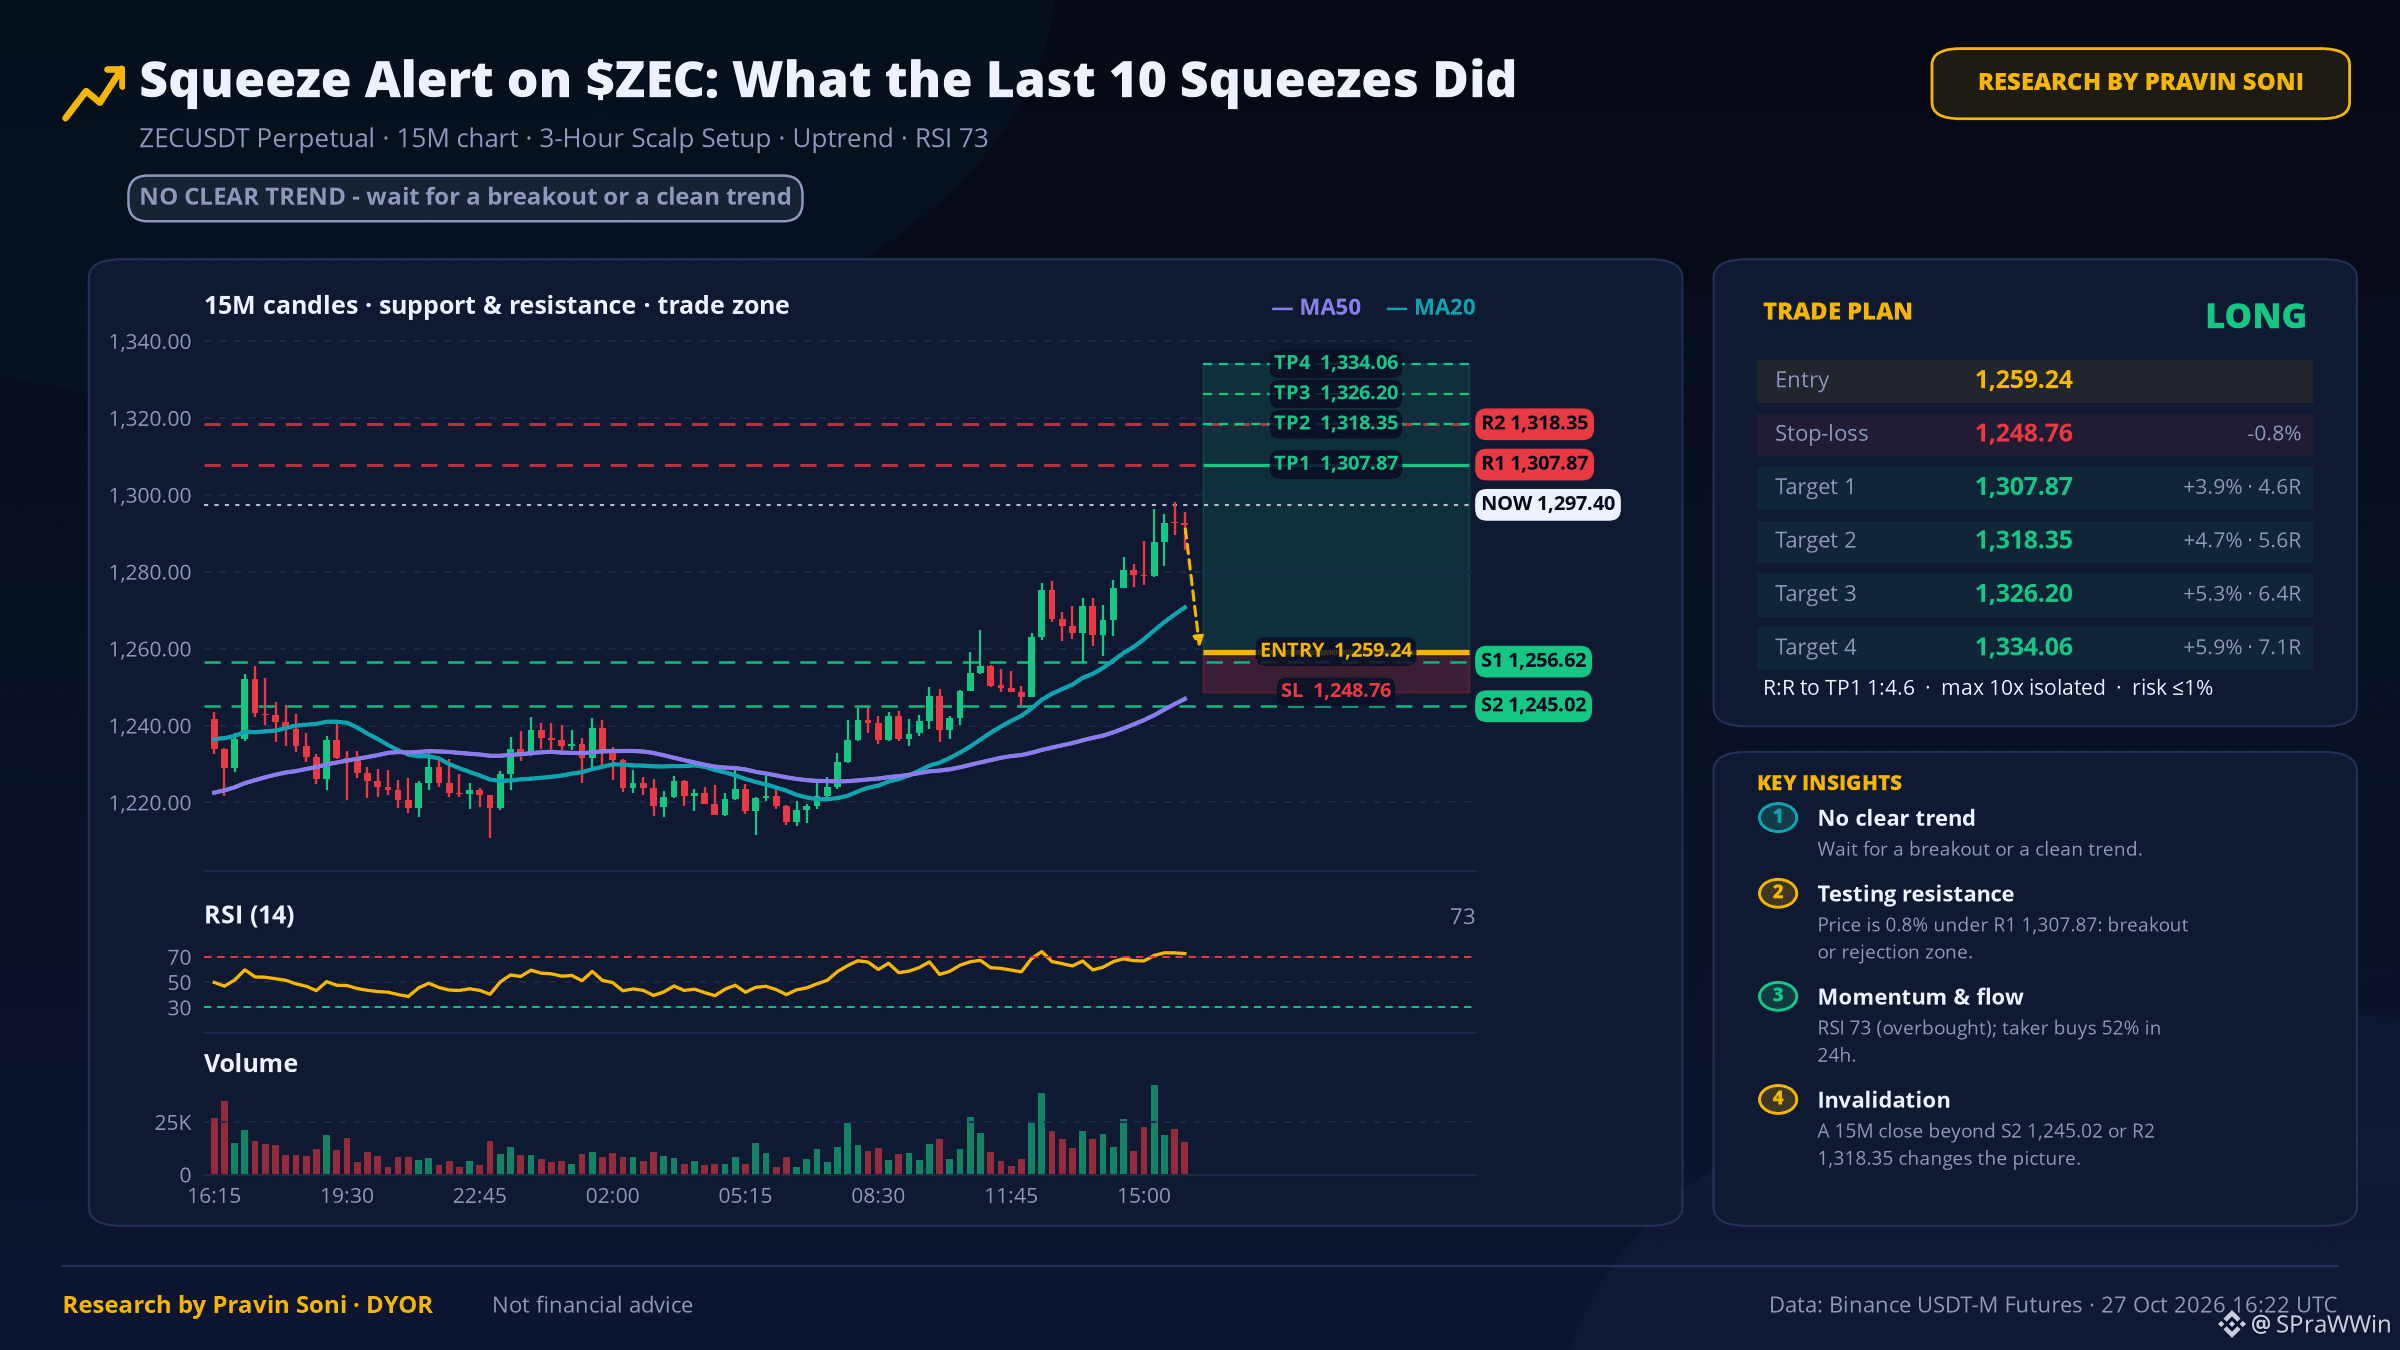
🟢 Bull case: daily close above 1,307.87 → 1,318.35
🔴 Bear case: daily close below 1,256.62 → 1,245.02
✍️ Bottom line: This is a range until proven otherwise: 1,256.62 below, 1,307.87 above. I trade the break, not the middle.
📰 Wu Blockchain, 13h ago: Zcash Co-Founder Proposes Redirecting 8% of Block Subsidies to Network Sustainability Mechanism Zcash co-founder and protocol developer Sean Bowe has …
💬 Which level breaks first? Tell me below.
Not financial advice · Data: Binance Futures
$ZEC #ZEC #Volatility #CryptoAnalysis
⚠️ Research by Pravin Soni - DYOR