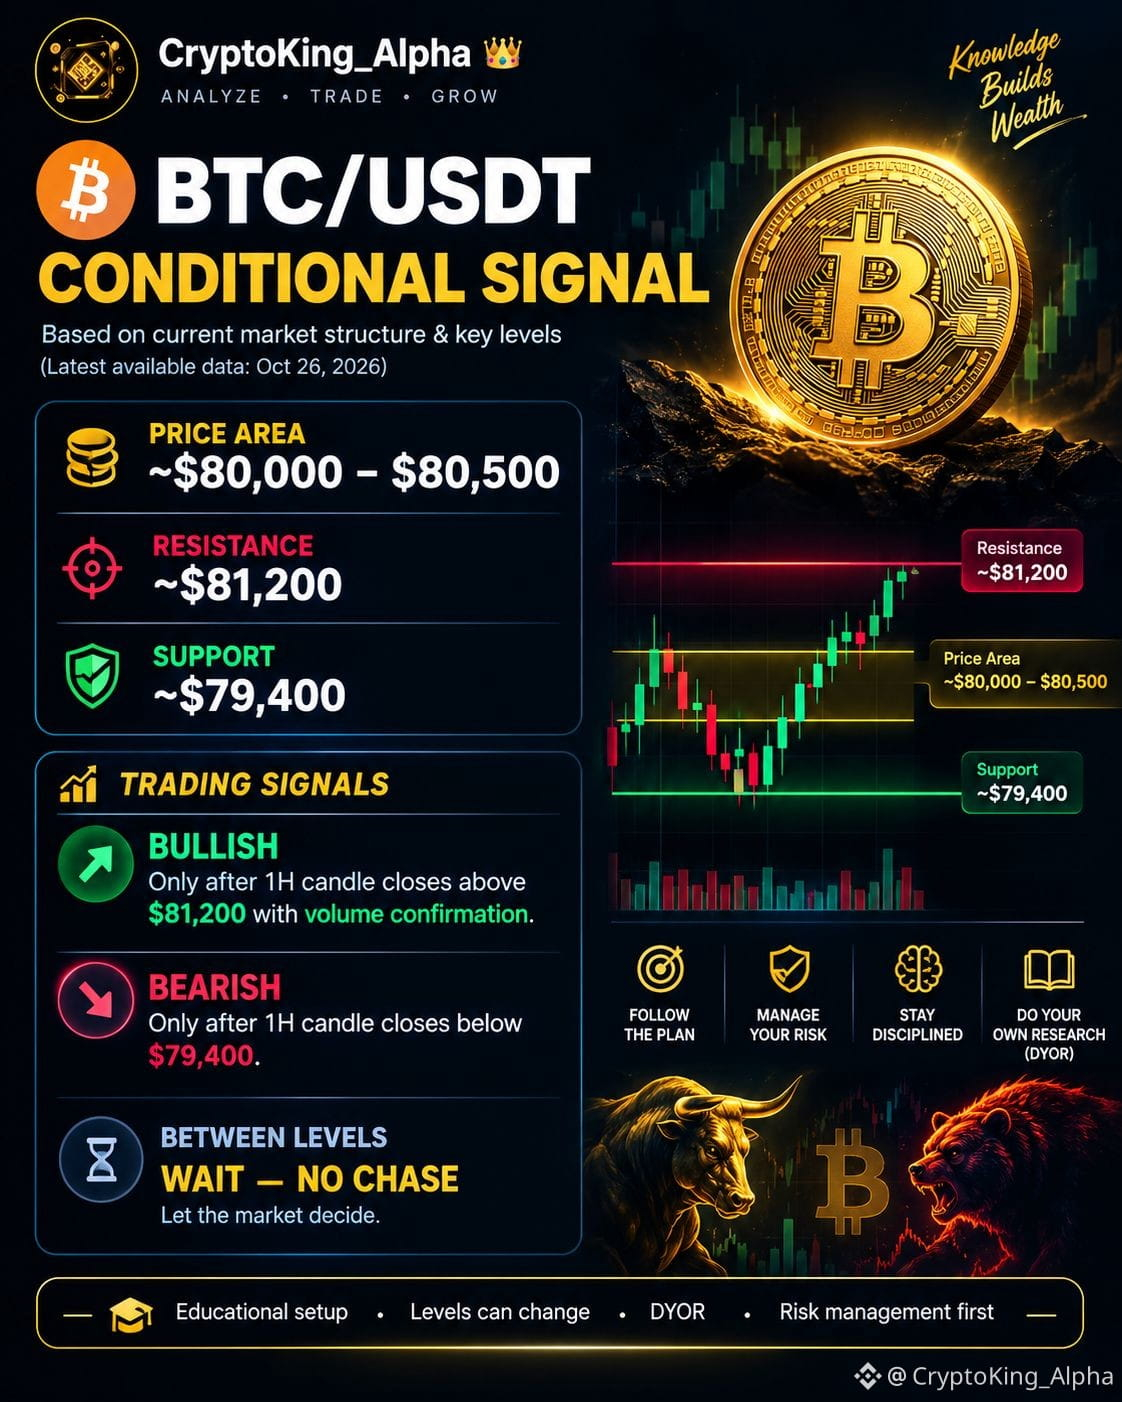
$BTC 📊 BTC/USDT Market Signal Plan | CryptoKing_Alpha 👑
Bitcoin is approaching an important technical zone where the next move could help traders identify a potential short-term direction. Rather than entering a trade based on price movement alone, it's important to wait for confirmation from the 1-hour chart and trading volume.
🔴 Key Resistance: Around $81,200
The $81,200 level is an important resistance area to watch. If Bitcoin approaches this zone but struggles to break above it, sellers may step in and push the price lower. However, if BTC breaks above this level and a 1-hour candle closes firmly above it, supported by strong trading volume, it could indicate increasing buying pressure and a possible bullish continuation. Traders should watch for a successful retest of the breakout level before considering an entry, as false breakouts can occur.
🟢 Key Support: Around $79,400
The $79,400 level is an important support area where buyers may attempt to defend the price. If BTC holds above this zone and buying pressure increases, the market could attempt another move toward resistance. On the other hand, if Bitcoin breaks below $79,400 and a 1-hour candle closes beneath it with strong selling volume, it could signal weakening momentum and the possibility of further downside. A retest of the broken support as resistance may provide additional confirmation.
📈 Bullish Scenario
- Wait for a 1-hour candle to close above $81,200.
- Look for strong volume to confirm the breakout.
- Watch whether BTC successfully retests the breakout area.
- Avoid entering immediately if the price quickly falls back below resistance.
📉 Bearish Scenario
- Wait for a 1-hour candle to close below $79,400.
- Look for increased selling volume and continued downward momentum.
- Watch for a retest of $79,400 from below.
- Be cautious of false breakdowns that quickly recover above support.
⏳ If BTC Remains Between $79,400 and $81,200
#BTC #bitcoin #BinanceSquare #BTCUSDT #CryptoAnalysis $BTC