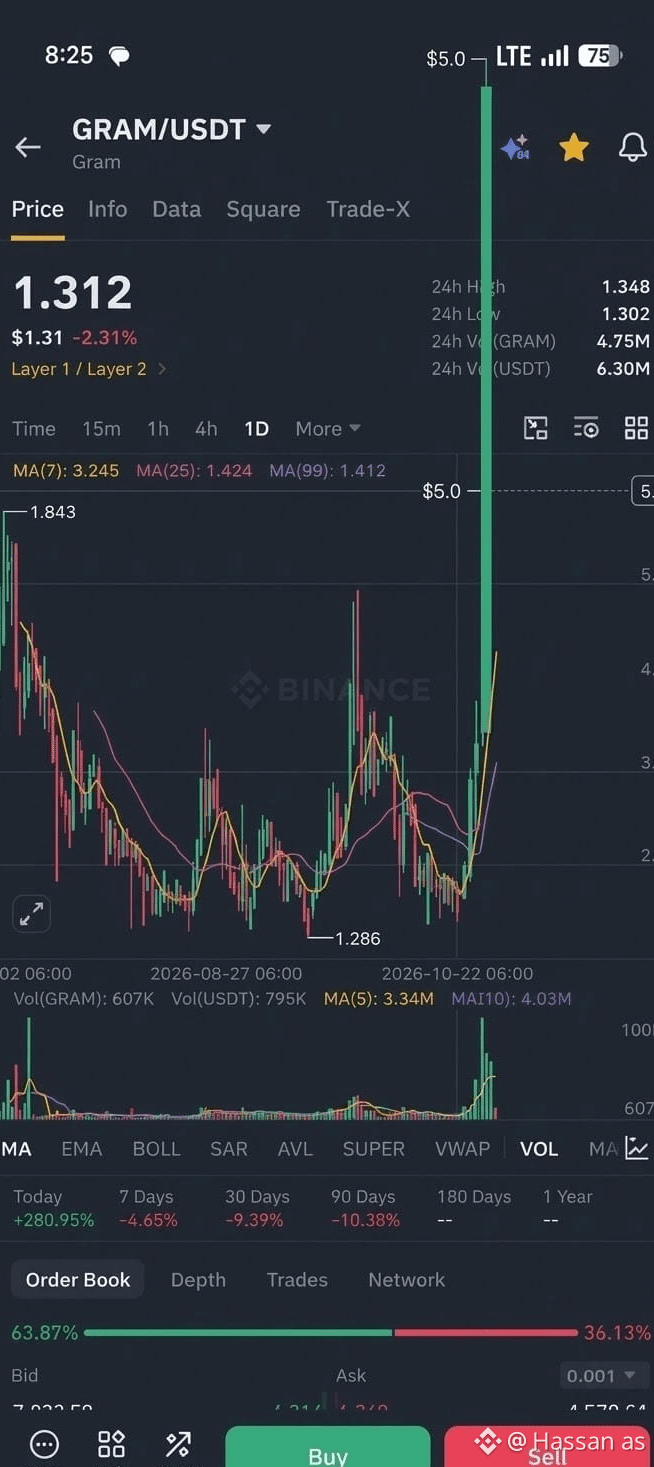
$GRAM GRAM/USDT coin mein bullish move ka chance hai, lekin abhi confirmation ke baghair buy karna risky hai. Screenshot ke mutabiq coin mein bohat tez pump hua hai aur ab price pullback kar rahi hai.
Current price
### $1.312
24h change
### -2.31%
Analysis based on your screenshot, 1D chart. Live market data independently verified nahi hai.
### Key levels
| Level | Price | Importance |
| ------------ | ---------- | ------------------------------------- |
| Resistance 1 | $1.348 | 24h high; breakout level |
| Resistance 2 | $1.41–1.42 | Moving-average resistance |
| Support 1 | $1.302 | 24h low |
| Support 2 | $1.25–1.28 | Potential support zone, not confirmed |
### Agle 2–7 din ka plan
Bullish scenario
Agar price $1.348 ke upar strong volume ke saath 1D candle close kare, to $1.41–1.42 next test ho sakta hai. Is resistance ke upar sustain karna further upside ke liye positive hoga.
Safer entry
Abhi chase karne ke bajaye $1.348 breakout aur successful retest ka wait karo. Alternative entry support ke paas bullish reversal confirmation par consider ki ja sakti hai.
Bearish scenario
Agar $1.302 support toot jaye, to price aur neeche ja sakti hai. Is surat mein buy karne ki jaldi na karo.
Meri rai: Filhal confirmation ka wait karna behtar hai. Screenshot mein unusual vertical green candle bhi nazar aa rahi hai, is liye chart ko normal pump samajhne se pehle price aur volume verify karna zaroori hai.
Ek sawal: Aap GRAM mein kis tarah trade karna chahte ho?
1\. Aapki position?
Abhi buy nahi kiya
Already buy kiya hua hai
2\. Kitne din hold karna hai?
Aaj hi sell (short-term)
2–7 din
2–4 haftay
Detailed trade plan
#EarningsSeason #EarningsSeason #ElectrumFixesHighRiskExploitInVersionsBefore4.8.3 #MarketsPriceJust10%ChanceOfFedHikeNextWeek