



Tesla & Meta earnings recap
Tesla ($TSLA): Earnings Beat, but Core Auto and GAAP Profitability Kept Investors Cautious
Tesla reported Q3 2026 results after the U.S. market close on 2026-10-21. The company exceeded the LSEG estimates cited by CNBC for adjusted earnings and revenue, but the market response was cautious because the improvement was not broad-based across Tesla’s core operating metrics. CNBC reported that TSLA fell more than 3.2% in extended trading following the release.
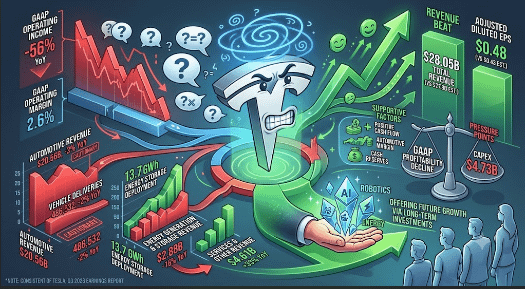
📊 Headline financial results
| Metric | Q3 2026 | Comparison / context |
| Total revenue | $28.05B | Versus $27.9B LSEG estimate; roughly flat versus $28.24B a year earlier |
| Adjusted diluted EPS | $0.48 | Versus $0.43 LSEG estimate |
| GAAP operating income | $718M | -56% YoY |
| GAAP operating margin | 2.6% | Down from 5.8% a year earlier |
| GAAP net income attributable to common shareholders | $787M | -43% YoY |
| Free cash flow | $1.53B | Recovered from negative free cash flow in Q2 |
| Cash,cash equivalents and short-term investments | $45.45B | Up from previous quarter |
| Quartly capex | $4.73B |Reflects continued spending onAI,robotics,manufacturing & energy |
Tesla’s adjusted earnings beat should therefore be read alongside a much weaker GAAP profit profile. The gap matters because adjusted EPS excludes certain items, while GAAP operating income captures the full operating-cost burden of running and investing in the business.
🚗 Core automotive business: revenue pressure remained
Automotive revenue: $20.56B, down 3% YoY.
Vehicle deliveries: 486,532, down about 2% YoY.
Vehicle production: 464,391.
Automotive gross margin excluding regulatory credits: 18.1%, improving from 16.3% in Q2.
The mixed signal is clear: Tesla improved unit economics sequentially, but its principal revenue segment still contracted year over year(YoY). Tesla cited lower average selling prices and battery-supply constraints that limited its ability to fulfill vehicle backlog as factors affecting automotive revenue and profitability.
⚡ Energy and services: growth quality was uneven
Tesla deployed 13.7 GWh of energy storage products in Q3, and management said its storage order rate and backlog were at record levels. However, reported energy generation and storage revenue was $2.88B, down 16% YoY. This means strong deployment volume did not translate into year-over-year segment-revenue growth in the quarter.
Services and other revenue was a relative bright spot, rising 33% YoY to $4.61B. That segment helped offset weaker automotive and energy revenue, but it remains smaller than the auto business and does not fully change the core revenue picture.
📉 Why the headline beat did not convince the market
The results contained two opposing narratives:
Supportive factors
Adjusted EPS exceeded consensus.
Automotive margin excluding credits improved quarter over quarter.
Free cash flow returned to positive territory at $1.53B.
Cash and short-term investments reached about $45.45B.
Storage deployments remained high, with management highlighting strong demand and backlog.
Pressure points
Total revenue was largely unchanged year over year.
Automotive revenue and deliveries both declined from the prior year.
GAAP operating income fell 56%, reducing the operating margin to 2.6%.
Energy revenue fell despite high storage deployment volume.
High capex & investment in AI, robotics, manufacturing & energy may support longer-term initiatives, but also keep near-term profitability sensitive to execution and spending discipline.
Market interpretation
The earnings release suggests that investors were not disputing the adjusted beat; instead, they appeared to be weighing whether margin improvement and free-cash-flow recovery can be sustained while Tesla’s automotive revenue remains under pressure and operating expenses remain elevated.
The main variables to monitor in subsequent reports are automotive revenue growth, average selling prices, delivery growth, automotive-margin durability, battery availability, energy-segment revenue conversion, capital expenditure and the pace at which AI, robotics and energy investments contribute to financial results. Historical performance and company guidance do not guarantee future results.

Meta ($META): Ad Strength and AI Momentum Offset a Major Legal Charge
Meta reported a stronger-than-expected third quarter on October 21, 2026, with revenue of $64.60 billion, up +26% year over year and above the approximately $63.34 billion consensus estimate. The earnings release was dominated by a $9.89 billion litigation charge, but investors initially focused on advertising resilience, AI product progress, and above-consensus fourth-quarter revenue guidance. Meta guided Q4 revenue to $73 billion–$76 billion, with a midpoint of $74.5 billion. Meta’s third-quarter results cover the period ended September 30, 2026.
📊 Financial performance
| Metric | Q3 2026 | YoY change | Statistical takeaway |
| Revenue | $64.60B | +26% | Beat consensus by about $1.26B, or roughly 2.0% |
| Operating income | $12.99B | -37% | Legal charge materially distorted reported profitability |
| Operating income excluding charge | $22.88B | ~+11% | Indicates core operating growth remained positive |
| GAAP diluted EPS | $3.83 | +265% | The comparison benefited from an unusually high prior-year tax expense |
| EPS excluding litigation charge | $7.40 | — | A better measure of quarter-specific operating performance |
| Operating margin | 20% | from 40% | Would have been about 35% excluding the charge |
| Net income | $9.86B | +264% | Also affected by the prior-year tax comparison |
| Capex | $34.91B | — | Reflects the scale of AI infrastructure investment |
| Free cash flow | -$2.12B | — | Heavy capital spending exceeded quarterly cash generation |
Meta’s reported numbers should therefore be read in two layers: GAAP results capture the legal cost, while the adjusted figures show that the ad business and underlying operations remained strong. Meta stated that the $9.89B charge lowered operating income by the same amount and reduced diluted EPS from $7.40 to $3.83.
📣 Advertising business and user engagement
Meta’s advertising engine remained the primary source of strength:
Family daily active people: 3.64 billion in September 2026, up +3% YoY.
Ad impressions: up +10% YoY.
Average price per ad: up +14% YoY.
The combination of higher ad impressions and stronger pricing supports the +26% revenue growth rate.
The statistical significance is that ad-price growth outpaced ad-impression growth by around 4 percentage points, suggesting that monetization—not merely audience expansion—made a substantial contribution to revenue acceleration. User growth remains modest relative to the company’s scale, so future advertising growth increasingly depends on engagement depth, AI-led targeting improvements, conversion performance, and advertiser demand.
⚖️ Legal charge: the key correction
The $9.89B amount was the accounting charge recorded during Q3 2026. It should not be described as the full legal settlement amount.
Meta stated that its agreement announced in August 2026 with 52 U.S. state attorneys general, relating to teen mental health and social-media litigation, provides for payments of up to approximately $18.59B. This means the Q3 charge represented a major recognized expense, while the agreement’s stated maximum payment amount was larger.
🤖 AI strategy: Muse adoption versus infrastructure costs
Management highlighted the launch of Muse and Muse Wonder as key milestones in its personal-AI strategy. Independent reporting said Muse accounts exceeded 10 million, but claims around shopping behavior and average purchase value should be presented carefully unless directly confirmed in Meta’s official earnings materials.
The more concrete financial signal is the investment profile:
Q3 capex: $34.91B
Full-year 2026 capex guidance: $135B–$145B
Quarterly free cash flow: -$2.12B
At the midpoint, the capex outlook is $140B. That is about four times Q3 capex annualized at the reported quarterly run rate, illustrating that investment remains exceptionally high even before accounting for potential further infrastructure expansion. The investment case therefore depends heavily on whether AI improves advertising returns, engagement, business messaging, consumer products, and other monetization channels quickly enough to support returns on that capital base.
🧾 Capital structure update
Meta announced a new non-voting Class C common stock. Reports describe the transaction as a two-for-one distribution structure in which Class A holders receive a non-voting Class C share, while voting control remains unchanged. The structure provides greater flexibility for future capital raising, employee compensation, and acquisitions without proportionately diluting voting control.
📈 Market reaction and interpretation
META closed at $697.52 on October 21, 2026, according to MarketBeat’s reported data, then traded around $712.47 in extended hours—an increase of approximately +2.1% at that timestamp. Other real-time reports showed the after-hours move fluctuating around the +2% to +4% range, so the reaction should be timestamped rather than treated as a fixed number.
The market’s reaction appears to reflect three factors:
Revenue quality: The revenue beat came from a resilient ad business, supported by both pricing and impression growth.
Forward visibility: Q4 guidance midpoint of $74.5B exceeded the approximately $73.73B consensus cited by CNBC.
AI optionality: Muse and related AI initiatives create a potential new monetization path, but the financial evidence remains early relative to the size of the capex commitment.
Key risks to monitor
Capex efficiency: The $135B–$145B spending plan may pressure free cash flow if revenue gains do not scale at a similar pace.
Legal-payment execution: The agreement provides for payments up to $18.59B, beyond the $9.89B Q3 charge already recorded.
AI monetization evidence: User adoption alone does not establish recurring, high-margin revenue.
Ad-market sensitivity: Advertising remains Meta’s primary earnings driver, leaving results exposed to macroeconomic conditions and changes in advertiser budgets.
Margin normalization: The adjusted operating margin of about 35% is stronger than the reported 20%, but still below the prior-year 40% reported margin.
Bottom line: Meta’s Q3 2026 report showed strong core advertising momentum and a meaningful revenue beat, while the litigation charge sharply reduced reported operating profit. The next phase of the story is less about whether Meta can grow revenue and more about whether its AI infrastructure spending can produce scalable revenue, durable margins, and renewed free-cash-flow expansion.


The above is market analysis and does not constitute investment advice.

#EthereumSurpasses$2500 #BitcoinDropsBelow$84K #FirstUNIBlockTradeViaRegulatedTradFiChannelCompleted #ZcashDevelopersConfirmNovemberDateForNU7Upgrade