

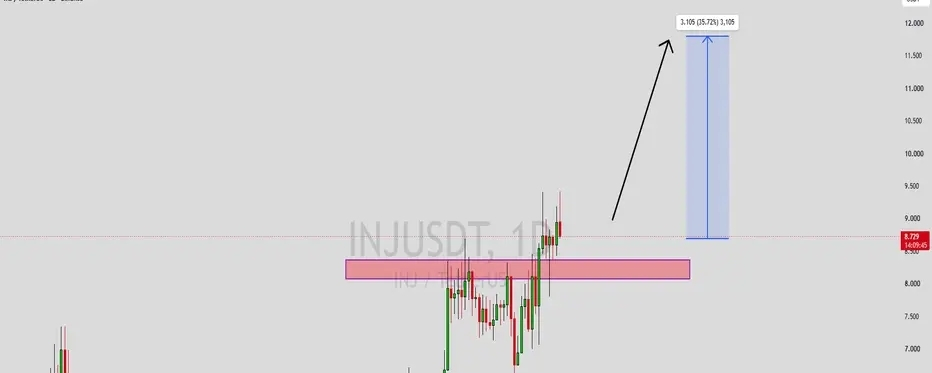

INJUSDT Setting up Bullish Continuation
INJUSDT has successfully broken above a major daily resistance zone and is now setting up a clean bullish continuation pattern. After weeks of building momentum and putting in consistent higher lows, buyers finally forced the price clean through the stubborn horizontal ceiling. Instead of falling back down, the market is holding tight right above this newly flipped support block, showing that buyers are firmly defending the breakout level. With downside pressure drying up, the measured target points toward an upside push of around 35% to 36% (+3.105 USDT) toward the next major resistance level near $11.70.
1
8
H1 Demand Holding Under Bearish Pressure
Fundamental Analysis Gold remains under pressure as rising energy prices are keeping inflation concerns alive. Brent crude is trading above $110, while markets continue to expect the Fed to hold rates at the October meeting but maintain a meaningful probability of another 25bp hike in December. Hot September CPI and PPI have reinforced the higher-for-longer rate narrative. At the same time, the dollar remains firm around the 101–102 area, limiting Gold’s recovery potential. The market is now in
by XAU_Macro_Pulse
5 minutes ago
0
INJUSDT Setting up Bullish Continuation
INJUSDT has successfully broken above a major daily resistance zone and is now setting up a clean bullish continuation pattern. After weeks of building momentum and putting in consistent higher lows, buyers finally forced the price clean through the stubborn horizontal ceiling. Instead of falling back down, the market is holding tight right above this newly flipped support block, showing that buyers are firmly defending the breakout level. With downside pressure drying up, the measured target po
by Alpha-GoldFX
7 minutes ago
0
Sellers Retain the Advantage as BTCUSDT Approaches a Key Support
Hello traders! Here’s my technical outlook based on the current BTCUSDT (3H) chart structure. BTCUSDT previously started to decline under the Resistance Line after breaking from higher levels and formed a descending structure. Price then tested the Seller Zone with breakouts and was rejected. Currently, BTCUSDT is trading below the 83,200 Seller Zone while holding above the 79,300 Buyer Zone. The recent rejection and descending structure suggest a possible continuation lower toward support. As l
by LegionQ8
Updated 8 minutes ago
3
0
KOSPI Composite Index – Bearish Breakdown
📉 General Trend The South Korean KOSPI remains bearish following a sharp decline from its June highs. Despite today's 3.29% rebound, the index continues trading below both major moving averages. It's a crazy target and I doubt it will play but the charts have told us the possibility and it's important to keep intuition away from what is in front of us. 📊 Technical Analysis Moving Averages: Price < 20 & 200MA – Bearish Bias (Only look for SHORTS). Breakout Pattern: Inverted Cup and Han
by Timonrosso
12 minutes ago
0
Scalping - Gold price consolidating – trendline at 4130
1. Market Structure — Bearish Gold has broken down from the previous ascending channel and shifted into a bearish structure, forming Lower Highs and Lower Lows. Price is currently consolidating around 4,120–4,125, below the descending trendline and longer-term EMA. Selling pressure remains dominant, while recent rebounds appear corrective rather than a confirmed bullish reversal. 2. Trendline Analysis - The previous ascending channel has been invalidated by a strong bearish breakout. - A ne
by Moon-ForexAcademy
14 minutes ago
1
Bitcoin: What Does the Weekly Gaussian Channel tell us
Looking at the rallies marked on this chart: 2012/13, 2016/17, 2020/21 and 2023/24. The strongest, accelerating phases developed after Bitcoin cleared the upper boundary of the weekly Gaussian Channel. Here is how I read it: above the channel shows strong bullish momentum. The middle line separates the bullish and bearish sides, while trading below the lower boundary represents a deeper bearish phase. During strong rallies, the upper boundary often acts as support, similar to the 50-week EMA
by DrVic_MarketX
16 minutes ago
1
GER40 TRADE OUTLOOK
Here's the outlook on GER40 trade setup. Potential shorts , please watch, comment, and let me know what you think
by LIRUNEX
19 minutes ago
1
USDJPY 21/10: Bullish bias intact
IndiShark is here! 🌊 The previously outlined medium-term bullish scenario remains relevant. USDJPY continues to consolidate beneath resistance just below 159, with shallow pullbacks keeping a potential upside breakout in focus. My plan: 🔼 BUY: ~ 158.545 ❌ SL: 157.315 | ✅ TP: 160.215 Key points 👇 ➡️ Price remains compressed beneath the 158.200–158.600 resistance area. Repeated tests and limited downside follow-through suggest sellers are struggling to push the pair away from the zone,
by IndiShark
19 minutes ago
1
GBPUSD 16/10/26: Rejection near 1.34
IndiShark is here! 🌊 GBPUSD is approaching 1.34000 resistance with strong bullish momentum. The main short scenario depends on rejection around this area, where the aggressive advance could pause or develop into consolidation. My plan: 🔽 SELL: ~ 1.33840 ❌ SL: 1.34530 | ✅ TP: 1.31980 Key points 👇 ➡️ The marked resistance area previously acted as a base before the sharp September decline. A failed attempt to hold above it, followed by a close back below, would provide stronger evidence
by IndiShark
Updated 19 minutes ago
8
Gold remains idle however Targets #10.000 per ounce Long-term
As discussed throughout my Monday’s session commentary: ‘Fundamental analysis: The Long-term Fundamental trend has assumed control from the Technicals as Gold seems undervalued relative to the circumstances of global developments. Gold should test my Target. DX is still unable to fill a Gap from last week's High impact news announcements as well as the Stock markets which should be Sell option any times soon. The reason Gold is pulling back more, delivering firm rejection due being too close to
by goldenBear88
19 minutes ago
0
USOIL 30Min Engaged ( Bullish Reversal Detected )
HANZO MARKET LIQUIDITY REPORT USOIL Timeframe: 30min (Volume Basis) Scale: Higher Timeframe Context / Deep Volume analysis ━━━━━━━━━━━━━━━━━━━━━━ Market Observation This analysis is focusing on structural behavior, liquidity zones, Volume analysis and key areas of interest within the current range. ━━━━━━━━━━━━━━━━━━━━━━ Market Bias Full liquidity Map ━━━━━━━━━━━━━━━━━━━━━━ 🔥Bullish Reversal Key Volume Zone : 95.95 Area ━━━━━━━━━━━━━━━━━━━━━━ Structure Factors: • Higher timeframe Volume reactio
by Path_Of_Hanzo
Updated 20 minutes ago
1
6
ETHUSD 1H: Trendline Breakout Opens Path Toward Resistance
ETHUSD 1H: Trendline Breakout Opens Path Toward Resistance Ethereum is showing a recovery after breaking above the descending trendline, with price holding near the 2,430–2,450 support area. If buyers maintain this zone and bullish momentum continues, ETH could advance toward the marked resistance levels. 📈 Bullish Recovery Route 🎯 Resistance 1: 2,500–2,510 🎯 Resistance 2: 2,575–2,590 🛡️ Support Zone The 2,430–2,450 area is the key demand region. Holding above this zone could support further
by Alpha_Liquidity
Updated 20 minutes ago
2
Bullish Trend
The chart shows a market currently resting on a support "floor." The short-term trend is up, so buyers are favored if they can defend this level. Watch the candlestick close at the current price (1.1218). If it forms a bullish reversal pattern here, the setup for a move back toward 1.1250 is valid.
by ShadabShah
21 minutes ago
1
Gold remains idle however Targets #10.000 per ounce Long-term
As discussed throughout my Monday’s session commentary: ‘Fundamental analysis: The Long-term Fundamental trend has assumed control from the Technicals as Gold seems undervalued relative to the circumstances of global developments. Gold should test my Target. DX is still unable to fill a Gap from last week's High impact news announcements as well as the Stock markets which should be Sell option any times soon. The reason Gold is pulling back more, delivering firm rejection due being too close to
by goldenBear88
21 minutes ago
1
Understanding SpaceX and Long Dated Options
NASDAQ:SPCX LEAPS and the IV problem NASDAQ:SPCX ’s longest-dated options are interesting because they give us long-duration exposure while the IV history is almost nonexistent . This will be the beginning of my analysis on SpaceX and their operations. Understanding long-dated options LEAPS stands for Long-Term Equity Anticipation Securities. They are long-dated options, generally issued with more than one year until expiry . They are commonly used for: Long-term directional po
by alex-dunstan
21 minutes ago
0
SOL Forecast
BINANCE:SOLUSDT A breakout above the resistance of the local consolidation range could signal the end of the correction within the broader bullish cycle. After retesting the range support, Solana is attempting to resume its bullish trend. This could support the broader market and further confirm the end of the correction. Key zone: 103.5–105.5 Consolidation above this support zone would strengthen the bullish scenario and confirm the potential end of the correction. Price may then enter an up
by Daragolbon
21 minutes ago
0
INJ/USDC, Uptrend Structure with Strong Volume Support
INJ/USDC is setting up for a momentum continuation on Coinbase Advanced Spot, and the technical structure here reflects a healthy, established uptrend. Price is trading comfortably above key moving averages, specifically the 1-hour EMA at 8.329 and the 15-minute EMA at 8.667, showing that buyers remain in control on both intraday and broader timeframes. What stands out is the volume profile. We are seeing a clear volume spike running at 1.61x the average, accompanied by confirmed buy imbalances
by CryptoSignalsChannel
23 minutes ago
0
Spike pro
XAUUSD Spike Detector PRO - Mobile Gold Scalper This indicator detects real spikes on Gold (XAUUSD) using wick rejection + ATR volatility + RSI filter. Features: ✅ BUY/SELL signals with big triangles ✅ Early SPIKE warnings ✅ Auto TP/SL lines ✅ Mobile push notifications + sound alerts ✅ Works on M1, M5, M15 - best for M5 ✅ Non-repaint on closed candle How to use: - BUY when BIG GREEN triangle appears + RSI <40 - SELL when BIG RED triangle appears + RSI >60 - Set alert to get phone notification
by ketetsomokgalaka382
25 minutes ago
1
NQ Range (10-21-26)
More churn with O/N being used to redirect the drops, it may work and if so look at Top CZ as Long target. Most likely near Friday with F-M Long play. We are still inside the yellow arrow range and waiting for any breakout, looking for some head fakes near either top/bottom. 30M charts show a lower DZ and same arrow from a few days ago. Today, stalled lift should see sideways to the next O/N for another lift attempt. Any BO below this range should move with some force. Watch the Tweets and block
by MAZing
26 minutes ago
0
Show more publications
English
Select market data provided by ICE Data Services.
Select reference data provided by FactSet. Copyright © 2026 FactSet Research Systems Inc.
Copyright © 2026, American Bankers Association. CUSIP Database provided by FactSet Research Systems Inc. All rights reserved.
SEC filings and other documents provided by Quartr.
© 2026 TradingView, Inc.
SOC 2 Compliant
GDPR Compliant
More than a product
Supercharts
Screeners
Stocks
ETFs
Bonds
Crypto coins
CEX pairs
DEX pairs
Pine
Heatmaps
Stocks
ETFs
Crypto coins
Calendars
Economic
Earnings
Dividends
IPOs
More products
News Flow
Portfolios
Yield Curves
Options
Macro Maps
Pine Script®
MCP Server
Apps
Mobile
Desktop
Community
Social network
Wall of Love
Refer a friend
Creator program
House Rules
Moderators
Ideas
Trading
Education
Editors' picks
Pine Script
Indicators & strategies
Wizards
Freelancers
Marketplace
Tools & subscriptions
Features
Pricing
Market data
Gift plans
Trading
Overview
Brokers
Brokers comparison
The Leap
Special offers
CME Group futures
Eurex futures
US stocks bundle
About company
Who we are
Space mission
Blog
Help Center
Careers
Media kit
Merch
TradingView store
Tarot cards for traders
The C63 TradeTime
Policies & security
Terms of Use
Disclaimer
Privacy Policy
Cookies Policy
Accessibility Statement
Trust Center
Security tips
Bug Bounty program
Status page
Business solutions
Widgets
Charting libraries
Lightweight Charts™
Advanced Charts
Trading Platform
Growth opportunities
Advertising
Brokerage integration
Partner program
Education program
Close
INJ / TetherUS
6 minutes ago
INJUSDT Setting up Bullish Continuation
INJUSDT has successfully broken above a major daily resistance zone and is now setting up a clean bullish continuation pattern. After weeks of building momentum and putting in consistent higher lows, buyers finally forced the price clean through the stubborn horizontal ceiling. Instead of falling back down, the market is holding tight right above this newly flipped support block, showing that buyers are firmly defending the breakout level. With downside pressure drying up, the measured target points toward an upside push of around 35% to 36% (+3.105 USDT) toward the next major resistance level near $11.70.
What makes this structure stand out is how cleanly former resistance has flipped into reliable daily support. Every minor dip back toward this highlighted band is being absorbed quickly, which is a classic sign of steady accumulation rather than profit-taking. Holding this base gives the trend a solid foundation to reset overextended short-term indicators while keeping the overall bullish structure intact. It also gives traders a well-defined level to manage risk, with strong structural support below and open room for expansion above.
The strong defense at these levels shows genuine buyer confidence in INJ's medium-term strength. As consolidation wraps up and buying volume begins to step back in, we could see momentum accelerate quickly into the next impulsive rally. This is definitely a high-probability continuation setup worth keeping on your radar as the trend prepares for its next leg up.
Hit the like button if you found this chart breakdown helpful, and leave a comment below! (Do you think INJ pushes straight to $11.70 from here, or does it need a few more days of consolidation first?)