



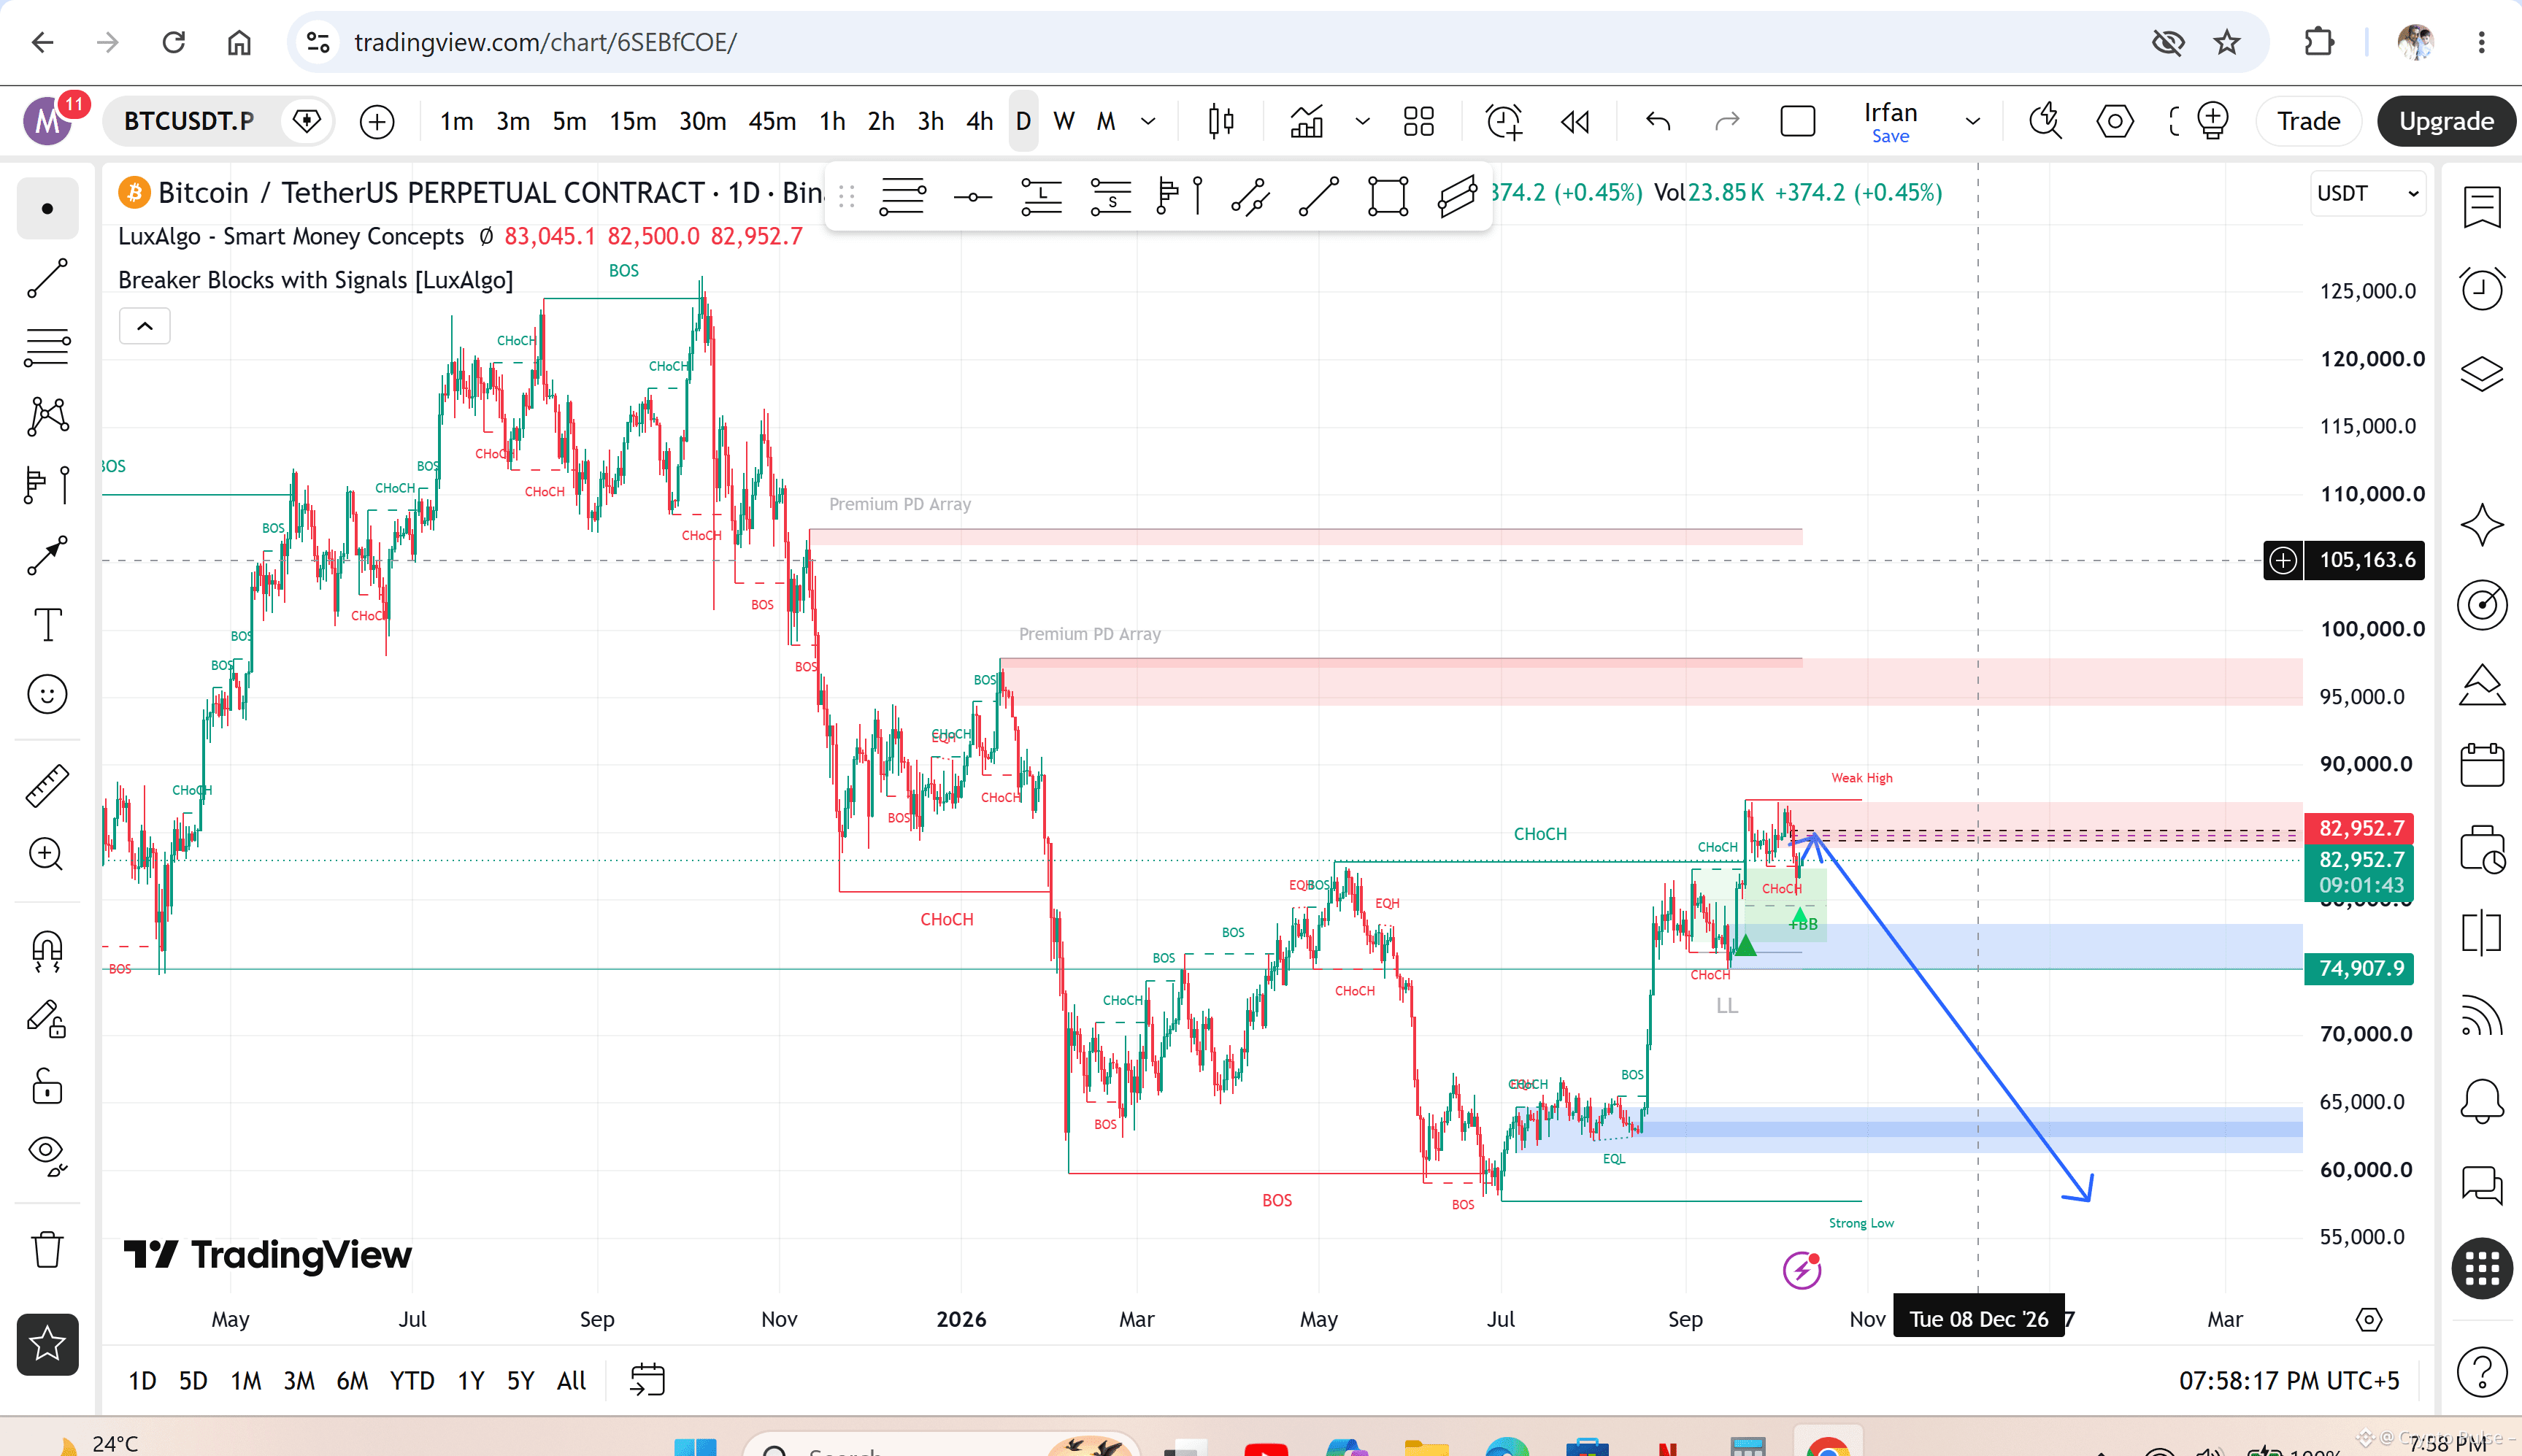
A Potential $30,000 Correction — Key Levels, Liquidity, and Market Structure
Bitcoin has been facing selling pressure, and a deeper correction could become possible if buyers fail to defend critical support zones. The bearish scenario discussed in this analysis projects a potential move from $85,000 toward $55,000, representing a decline of approximately 35.3%.
This is an aggressive downside scenario, not a confirmed forecast. The market must break several important support levels before such a move becomes technically credible.
1. The Bearish Thesis
The central idea is that Bitcoin could enter a broader corrective phase if buying momentum weakens, liquidity conditions deteriorate, and successive support levels fail.
A sustained decline below important daily and weekly swing lows could trigger stop-loss orders, liquidations of leveraged long positions, and additional selling pressure.
Recent market reporting has highlighted pressure around $83,000 and possible downside levels near $80,000 and $72,000. These levels provide a more immediate framework for evaluating a bearish scenario rather than assuming that $55,000 will be reached directly. (Source: Decrypt, October 9, 2026.)
2. Potential Downside Roadmap
The following levels are illustrative checkpoints for a bearish scenario, not verified support levels or guaranteed price targets.
$85,000–$82,000: Initial breakdown and confirmation zone.
$80,000: First major psychological checkpoint.
$77,000–$75,000: Potential continuation zone if selling pressure persists.
$72,000–$70,000: Deeper correction zone where buyers could attempt a strong recovery.
$65,000–$60,000: Extended downside scenario if broader market structure deteriorates significantly.
$55,000: Final bearish target, requiring sustained selling pressure and the breakdown of several intervening support areas.
Bitcoin may reverse, consolidate, or recover at any of these levels. A move to $55,000 should therefore be treated as a tail-risk scenario rather than the inevitable next destination.
3. What Could Drive Bitcoin Toward $55,000?
A. Breakdown of market structure
Repeated lower highs and lower lows on the daily chart would support the bearish thesis. A decisive daily close below established swing lows, followed by a failed retest, would provide stronger evidence than a temporary intraday wick.
B. Long liquidations
If BTC falls sharply while leveraged traders maintain oversized long positions, forced liquidations can accelerate the decline. However, liquidation activity alone does not establish that a long-term bear market has begun.
C. Weak spot demand
Persistent spot selling, weakening ETF demand, and reduced buying on dips could make it harder for Bitcoin to recover lost support levels.
D. Macroeconomic pressure
Rising Treasury yields, a stronger US dollar, or worsening risk sentiment could weigh on speculative assets. These factors are possible contributors, not reliable standalone predictors of Bitcoin's direction.
4. ICT and Liquidity-Based Confirmation
For ICT traders, the $55,000 thesis should be approached through confirmation rather than prediction.
Higher-timeframe bias: Look for bearish displacement and a clear break of structure on the daily or 4-hour chart.
Liquidity sweep: Watch for price to sweep a meaningful swing high and then reverse with bearish displacement. A sweep alone is not a short signal.
Change of character (CHoCH): Look for a break of a relevant internal low after the sweep, preferably with a strong candle close.
Fair Value Gap (FVG): Identify a bearish imbalance created by displacement.
Entry confirmation: Consider a retracement into the bearish FVG or order block only after the structure confirms. Place the stop beyond the invalidation point.
Target management: Use nearby opposing liquidity and confirmed support levels as staged targets instead of holding every position for $55,000.
A bearish 5-minute CHoCH may support an intraday trade, but it cannot independently confirm a multiweek decline. Higher-timeframe structure must support the larger thesis.
5. What Would Invalidate This Outlook?
The bearish scenario would weaken if Bitcoin reclaims broken support, forms higher highs and higher lows, and sustains bullish daily closes.
A recovery above significant resistance, accompanied by strong spot demand, could invalidate a developing bearish setup. Traders should reassess the thesis as price action changes rather than continue shorting simply because the $55,000 target remains unfilled.
6. Risk Management
A projected 35.3% decline does not mean a trader should open a large leveraged short immediately. Bitcoin can rally sharply during a broader correction, liquidating shorts before falling again.
Use a predefined invalidation level, size positions according to the stop distance, avoid excessive leverage, and never risk money needed for essential expenses or debt repayments.
Final Verdict
BTC/USDT at $85,000 → $55,000 is a possible bearish scenario, but it requires substantial technical confirmation. The more disciplined approach is to monitor the breakdown of $82,000–$80,000, evaluate the reaction around each subsequent support zone, and revise the outlook if buyers regain control.
The objective is not to predict every move correctly. It is to identify when the bearish thesis is supported, when it is weakening, and when it is no longer valid.
This analysis is for educational purposes only and is not financial advice. Cryptocurrency trading, especially leveraged futures, involves substantial risk.