


Bitcoin and Ethereum have recovered from yesterday’s lows, but their rebounds still face important tests. Cardano has put together 2 bullish days, which gives its recovery a different starting point. Today’s question is whether these moves can develop into stronger recoveries or lose strength near resistance.
The indicator readings offer clues, although they do not all point in the same direction. This crypto price prediction for today examines each asset’s recent movement, explains its technical readings, and maps out bullish, bearish, and neutral possibilities.
Bitcoin Price Recovery Faces Resistance Near $83,400
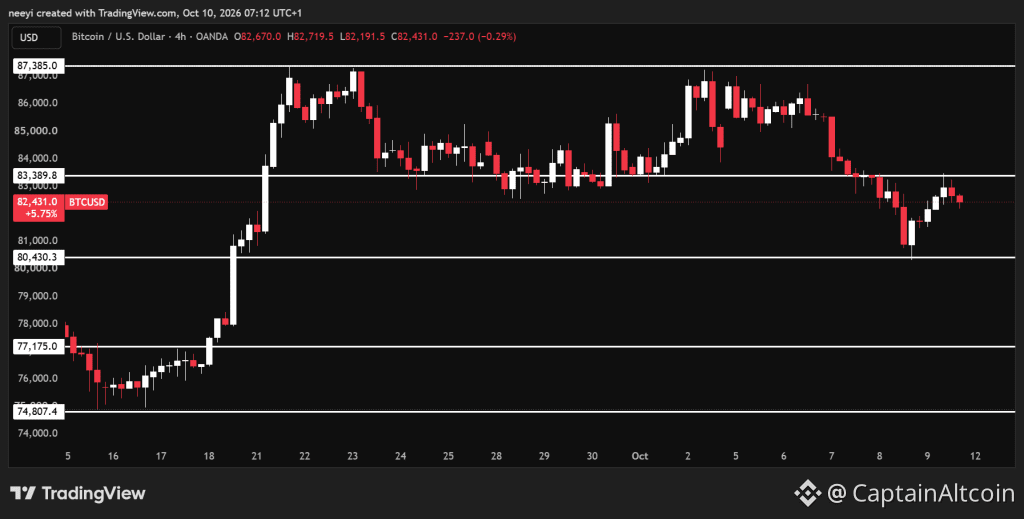
Bitcoin price fell to around $80,430 yesterday before recovering toward $82,500. That rebound has taken BTC away from its recent low, but it remains inside the expected $80,400 to $83,400 range.
 BTCUSD Price Chart / TradingView.com
The recovery therefore needs more than a higher price to establish a stronger direction. Bitcoin must clear resistance and hold above it. Otherwise, another move toward the lower boundary remains possible.
Bitcoin Indicator Readings Show Uneven Recovery Strength
Indicator Value What The Reading Means RSI (14) 44.749 Momentum remains below the midpoint, so buyers have limited control. Stochastic (9,6) 69.721 Price has recovered toward the upper portion of its recent range. Ultimate Oscillator 51.887 Buying pressure has a slight advantage across its measurement periods. Bull/Bear Power (13) -348.5892 The negative reading points to continued downward pressure.
Bitcoin’s RSI of 44.749 remains below 50. This means the rebound has not established clear bullish momentum. The reading is above the commonly used oversold threshold of 30, so it also provides no strong oversold argument for an immediate recovery.
The Stochastic reading of 69.721 gives a more positive picture. BTC has recovered toward the upper part of its recent trading range. However, this measures price position within that range and does not confirm a breakout above $83,400.
The Ultimate Oscillator at 51.887 places buying pressure slightly above its midpoint. That offers modest support for the rebound, although the reading remains too close to 50 to indicate decisive strength.
Finally, Bull/Bear Power at -348.5892 points to lingering downward pressure. Together, these readings describe a recovery that has made progress but still faces resistance from sellers.
Bitcoin Price Prediction For Today
Bullish scenario: A sustained break above $83,400 could open a path toward $87,000. That would require a stronger move than the current indicator readings confirm.
Bearish scenario: A break below $80,400 could expose $77,000 if selling pressure accelerates through the day.
Neutral scenario: Bitcoin could continue between $80,400 and $83,400 if neither side establishes control.
Ethereum Price Rebound Remains Vulnerable Below $2,570
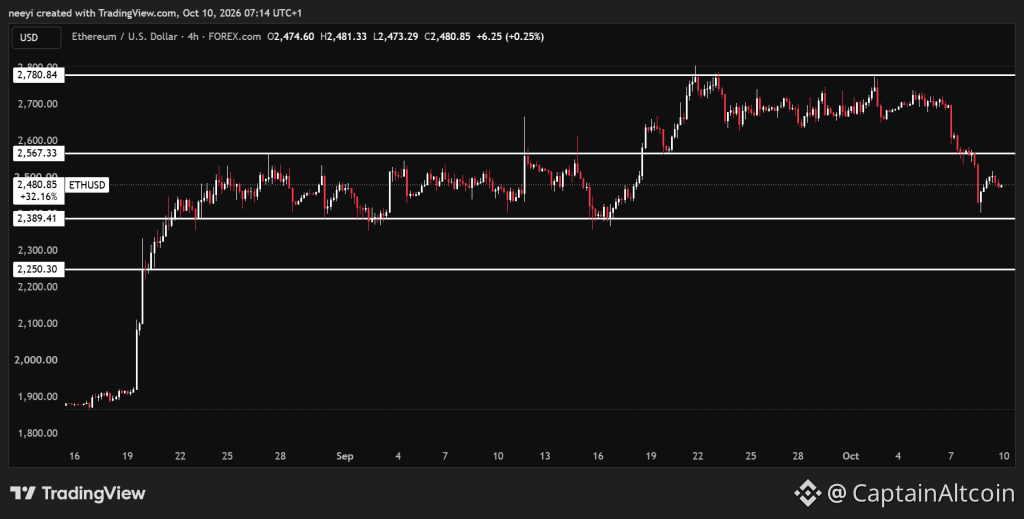
Ethereum price reached around $2,400 yesterday before recovering toward $2,480. ETH remains within a broader range between $2,380 and $2,570, so the rebound has not resolved its direction.
 ETHUSD Price Chart / TradingView.com
The lower boundary gives Ethereum some room beneath yesterday’s low. However, buyers need to reclaim the upper boundary before the recovery can support a stronger bullish outlook.
Ethereum Indicator Readings Point To Weak Momentum
Indicator Value What The Reading Means RSI (14) 35.398 Momentum remains weak and is closer to oversold territory. Stochastic (9,6) 47.409 Price is near the middle of its recent range. Ultimate Oscillator 48.562 Buying pressure remains slightly below the midpoint. Bull/Bear Power (13) -54.3471 Downward pressure continues despite the price rebound.
Ethereum’s RSI of 35.398 indicates weaker momentum than Bitcoin’s reading. Sellers retain an advantage, although ETH has not crossed below the usual oversold threshold of 30. A low RSI alone does not guarantee that the price will bounce.
The Stochastic reading of 47.409 places Ethereum near the middle of its recent range. This offers little evidence of a decisive upward move and fits the possibility of further sideways trading.
The Ultimate Oscillator at 48.562 is slightly below 50. Buying pressure has not gained a clear advantage across the periods measured by the indicator. Its proximity to the midpoint also means the bearish message is modest.
Meanwhile, Bull/Bear Power at -54.3471 supports the view that downward pressure remains present. Ethereum’s rebound could continue, but the combined readings leave it vulnerable to another support test.
Ethereum Price Prediction For Today
Bullish scenario: A sustained break above $2,570 could lead toward $2,640. Stronger follow through could bring $2,790 into view.
Bearish scenario: A loss of $2,380 support could create room for a decline toward $2,250 today.
Neutral scenario: Ethereum could remain between $2,380 and $2,570 until stronger buying or selling pressure develops.
Cardano Price Recovery Tests Resistance Near $0.26
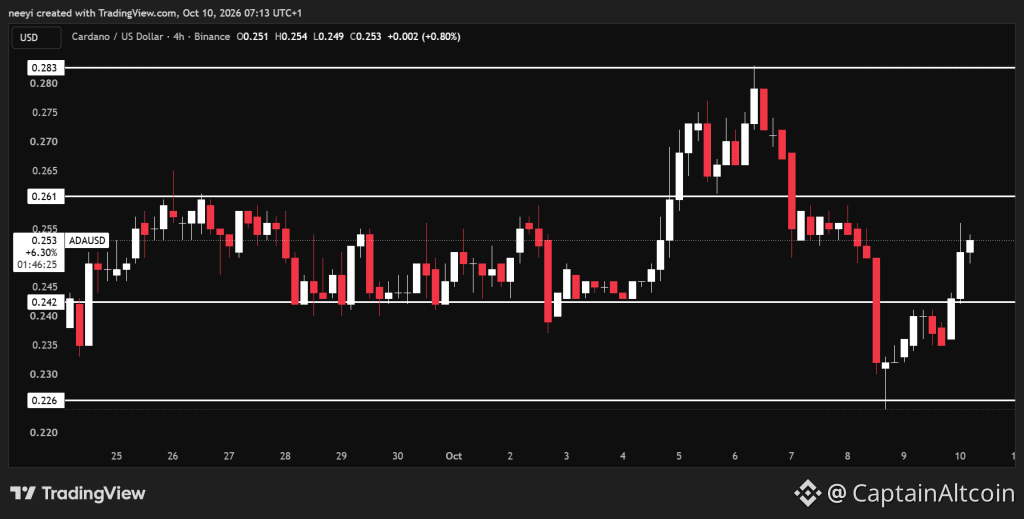
Cardano price has recorded 2 consecutive bullish days after bouncing from around $0.22. ADA now trades near $0.25, which places it close to resistance around $0.26.
 ADAUSD Price Chart / TradingView.com
This recovery has stronger technical support than the rebounds in Bitcoin and Ethereum. However, Cardano still needs to overcome resistance before higher targets become more credible.
Cardano Indicator Readings Give Buyers A Modest Advantage
Indicator Value What The Reading Means RSI (14) 53.660 Momentum is slightly positive without an overbought reading. Stochastic (9,6) 64.674 Price holds within the upper half of its recent range. Ultimate Oscillator 55.462 Buying pressure has a modest advantage. Bull/Bear Power (13) 0.0096 The positive reading supports the recent upward movement.
Cardano’s RSI of 53.660 is above 50, which gives buyers a modest momentum advantage. The reading remains well below 70, so this indicator does not place ADA in overbought territory.
The Stochastic reading of 64.674 supports the recent recovery. Cardano trades within the upper half of its recent range, although resistance near $0.26 remains an obstacle.
The Ultimate Oscillator at 55.462 also favours buyers. Its position above 50 gives the recovery additional technical support without indicating overwhelming strength.
Finally, Bull/Bear Power at 0.0096 provides a positive reading. This agrees with Cardano’s recent upward movement, but it cannot establish how far the recovery will travel.
Cardano Price Prediction For Today
Bullish scenario: A sustained break above $0.26 could allow Cardano price to test $0.28. Further upside would depend on continued buying pressure.
Bearish scenario: A break below $0.24 could put the recent recovery under pressure and expose $0.22 again.
Neutral scenario: Cardano could consolidate between $0.24 and $0.26 as its recent rebound pauses.
FAQs
Will Cardano ADA reach $10?
Cardano (ADA) trading around $0.41 to $0.70 requires a massive 2,400% to 3,800% increase to reach $10, which mainstream prediction algorithms and financial models view as highly improbable in the near or medium term.
How much is $1000 in Ethereum 5 years ago?
A $1,000 investment in Ethereum exactly 5 years ago (on October 10, 2021) would have purchased approximately 0.292 ETH, as Ethereum was trading at $3,425.85
Subscribe to our YouTube channel for daily crypto updates, market insights, and expert analysis.
The post Crypto Price Prediction for Today, October 10: Bitcoin (BTC), Ethereum (ETH), and Cardano (ADA) appeared first on CaptainAltcoin.