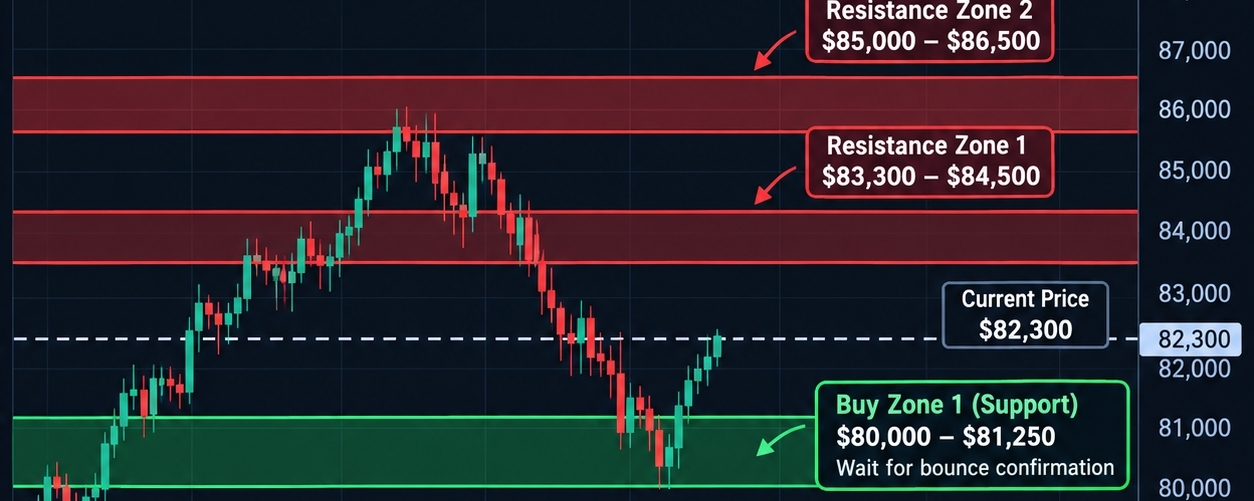

$ETH Here is your BTC Technical Analysis Chart with Support Levels and Buying Areas for 10 October 2026.
BTC/USD — Support & Buy Zones
Latest available market information: approximately $82,000–$83,000 on October 9, 2026.
CoinMarketCap
+1
Important levels to watch
Level
BTC price (USD)
Action
Buy Zone 1
$80,000–$81,250
Watch for a bullish bounce
Buy Zone 2
$76,500–$78,000
Deeper support; wait for confirmation
Resistance 1
$83,300–$84,500
Watch for breakout or rejection
Resistance 2
$85,000–$86,500
Potential selling pressure
Risk level
Below $75,000
Higher bearish risk
These are approximate technical-analysis zones, not guaranteed entry prices. Recent analysis identifies support near $81,000 and a deeper support area near $75,000–$77,000.
CoinMarketCap
+2
My trading suggestion: Avoid buying just because BTC touches support. Wait for a bullish candle or a confirmed rebound, and use a stop-loss appropriate to your risk.
You can also follow the live chart on
TradingView BTC/USDT
.