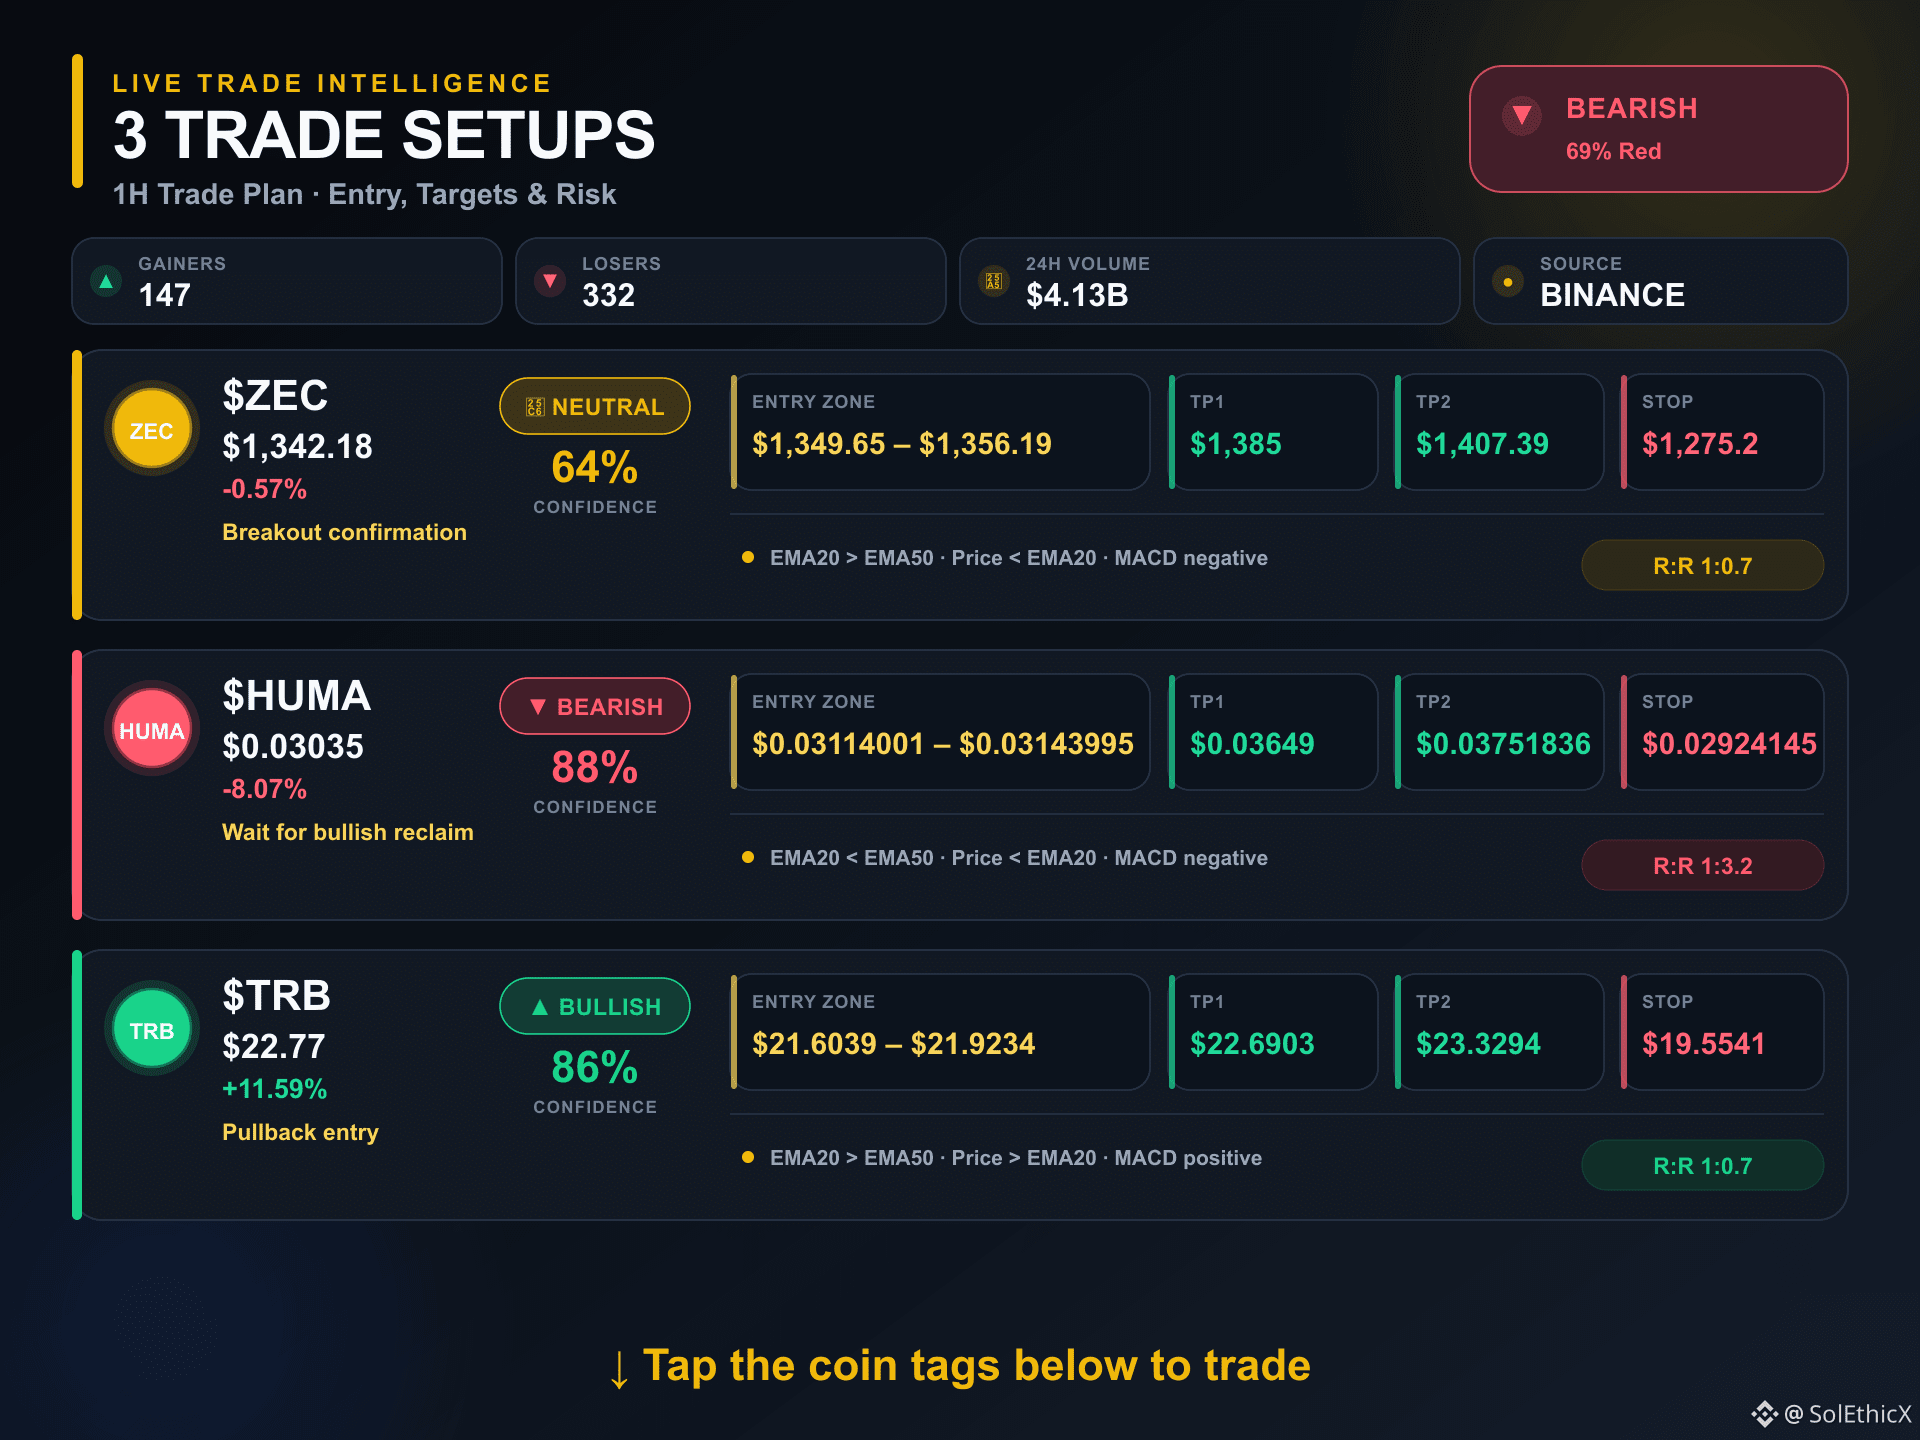

Three setups made the shortlist. None of them look exactly the same. 📊
TRB — has the cleaner moving-average structure here, with EMA20 still sitting above EMA50.
I’d be more interested after a clean reset than trying to jump into TRB while it’s already moving. If I had to keep one chart closest, this would be it.
ZEC — has the cleaner moving-average structure here, with EMA20 still sitting above EMA50.
For me, the chart is boxed between $1,278.00 support and $1,385.00 resistance until one side gives way.
HUMA — The short-term EMA picture on remains soft, so I’m not reading this as a clean trend reversal yet.
I’m mainly watching how price behaves between support around $0.02937 and resistance near $0.03649.
These are watchlist ideas for me right now; confirmation still matters. 📊
$ZEC $HUMA $TRB
TRB — has the cleaner moving-average structure here, with EMA20 still sitting above EMA50.
I’d be more interested after a clean reset than trying to jump into TRB while it’s already moving. If I had to keep one chart closest, this would be it.
ZEC — has the cleaner moving-average structure here, with EMA20 still sitting above EMA50.
For me, the chart is boxed between $1,278.00 support and $1,385.00 resistance until one side gives way.
HUMA — The short-term EMA picture on remains soft, so I’m not reading this as a clean trend reversal yet.
I’m mainly watching how price behaves between support around $0.02937 and resistance near $0.03649.
These are watchlist ideas for me right now; confirmation still matters. 📊
$ZEC $HUMA $TRB