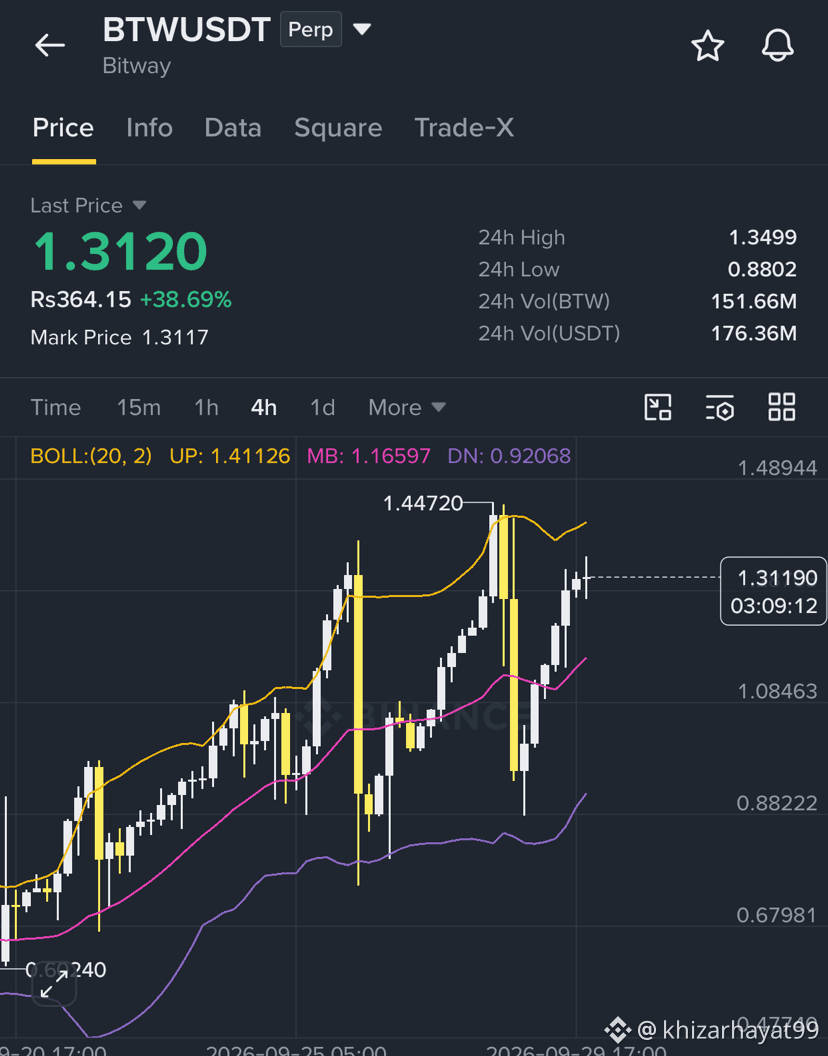
Here is the updated long trade plan and technical breakdown for $BTW USDT based on the 4-Hour bullish structure around $1.3120:
Key Technical Context
Current Pivot Zone: $1.3000 – $1.3150 (Holding key higher-low support on the 4H timeframe).
4H Market Structure: Price is consolidating above the $1.3000 psychological baseline following a recent expansion phase. Retaining this level is critical to maintain the short-term bullish continuation structure.
Trend Confirmation: Looking for 4H candle closes above the 20/50 EMA cluster to signal renewed buyer momentum toward higher liquidity pools.
Trade Plan & Execution Matrix
Parameter Value Details / Notes
Trade Direction LONG Trend continuation setup off 4H demand zone
Entry Zone $1.3000 – $1.3150 Scale in near support / retest of demand floor
Stop Loss (SL) $1.2250 Structural invalidation below key 4H swing low (~6.5% risk)
Take Profit 1 (TP1) $1.4450 Immediate resistance target (Secure partials & move SL to breakeven)
Take Profit 2 (TP2) $1.5800 1.618 Fibonacci extension target
Take Profit 3 (TP3) $1.7500 Major expansion / liquidity sweep target
Risk / Reward Ratio ~1 : 3.0 (Calculated to TP2)
Trade Execution Guidelines
Confirmation: Confirm a 4H candle close (bullish pin bar, engulfing, or strong absorption wick) above $1.3000 before sizing in fully.
Risk Control: Cap total trade exposure to 1–2% of portfolio risk to account for intraday volatility.
Invalidation: A 4H candle body close below $1.2250 breaks the higher-low sequence and invalidates the bullish setup.
Key Technical Context
Current Pivot Zone: $1.3000 – $1.3150 (Holding key higher-low support on the 4H timeframe).
4H Market Structure: Price is consolidating above the $1.3000 psychological baseline following a recent expansion phase. Retaining this level is critical to maintain the short-term bullish continuation structure.
Trend Confirmation: Looking for 4H candle closes above the 20/50 EMA cluster to signal renewed buyer momentum toward higher liquidity pools.
Trade Plan & Execution Matrix
Parameter Value Details / Notes
Trade Direction LONG Trend continuation setup off 4H demand zone
Entry Zone $1.3000 – $1.3150 Scale in near support / retest of demand floor
Stop Loss (SL) $1.2250 Structural invalidation below key 4H swing low (~6.5% risk)
Take Profit 1 (TP1) $1.4450 Immediate resistance target (Secure partials & move SL to breakeven)
Take Profit 2 (TP2) $1.5800 1.618 Fibonacci extension target
Take Profit 3 (TP3) $1.7500 Major expansion / liquidity sweep target
Risk / Reward Ratio ~1 : 3.0 (Calculated to TP2)
Trade Execution Guidelines
Confirmation: Confirm a 4H candle close (bullish pin bar, engulfing, or strong absorption wick) above $1.3000 before sizing in fully.
Risk Control: Cap total trade exposure to 1–2% of portfolio risk to account for intraday volatility.
Invalidation: A 4H candle body close below $1.2250 breaks the higher-low sequence and invalidates the bullish setup.