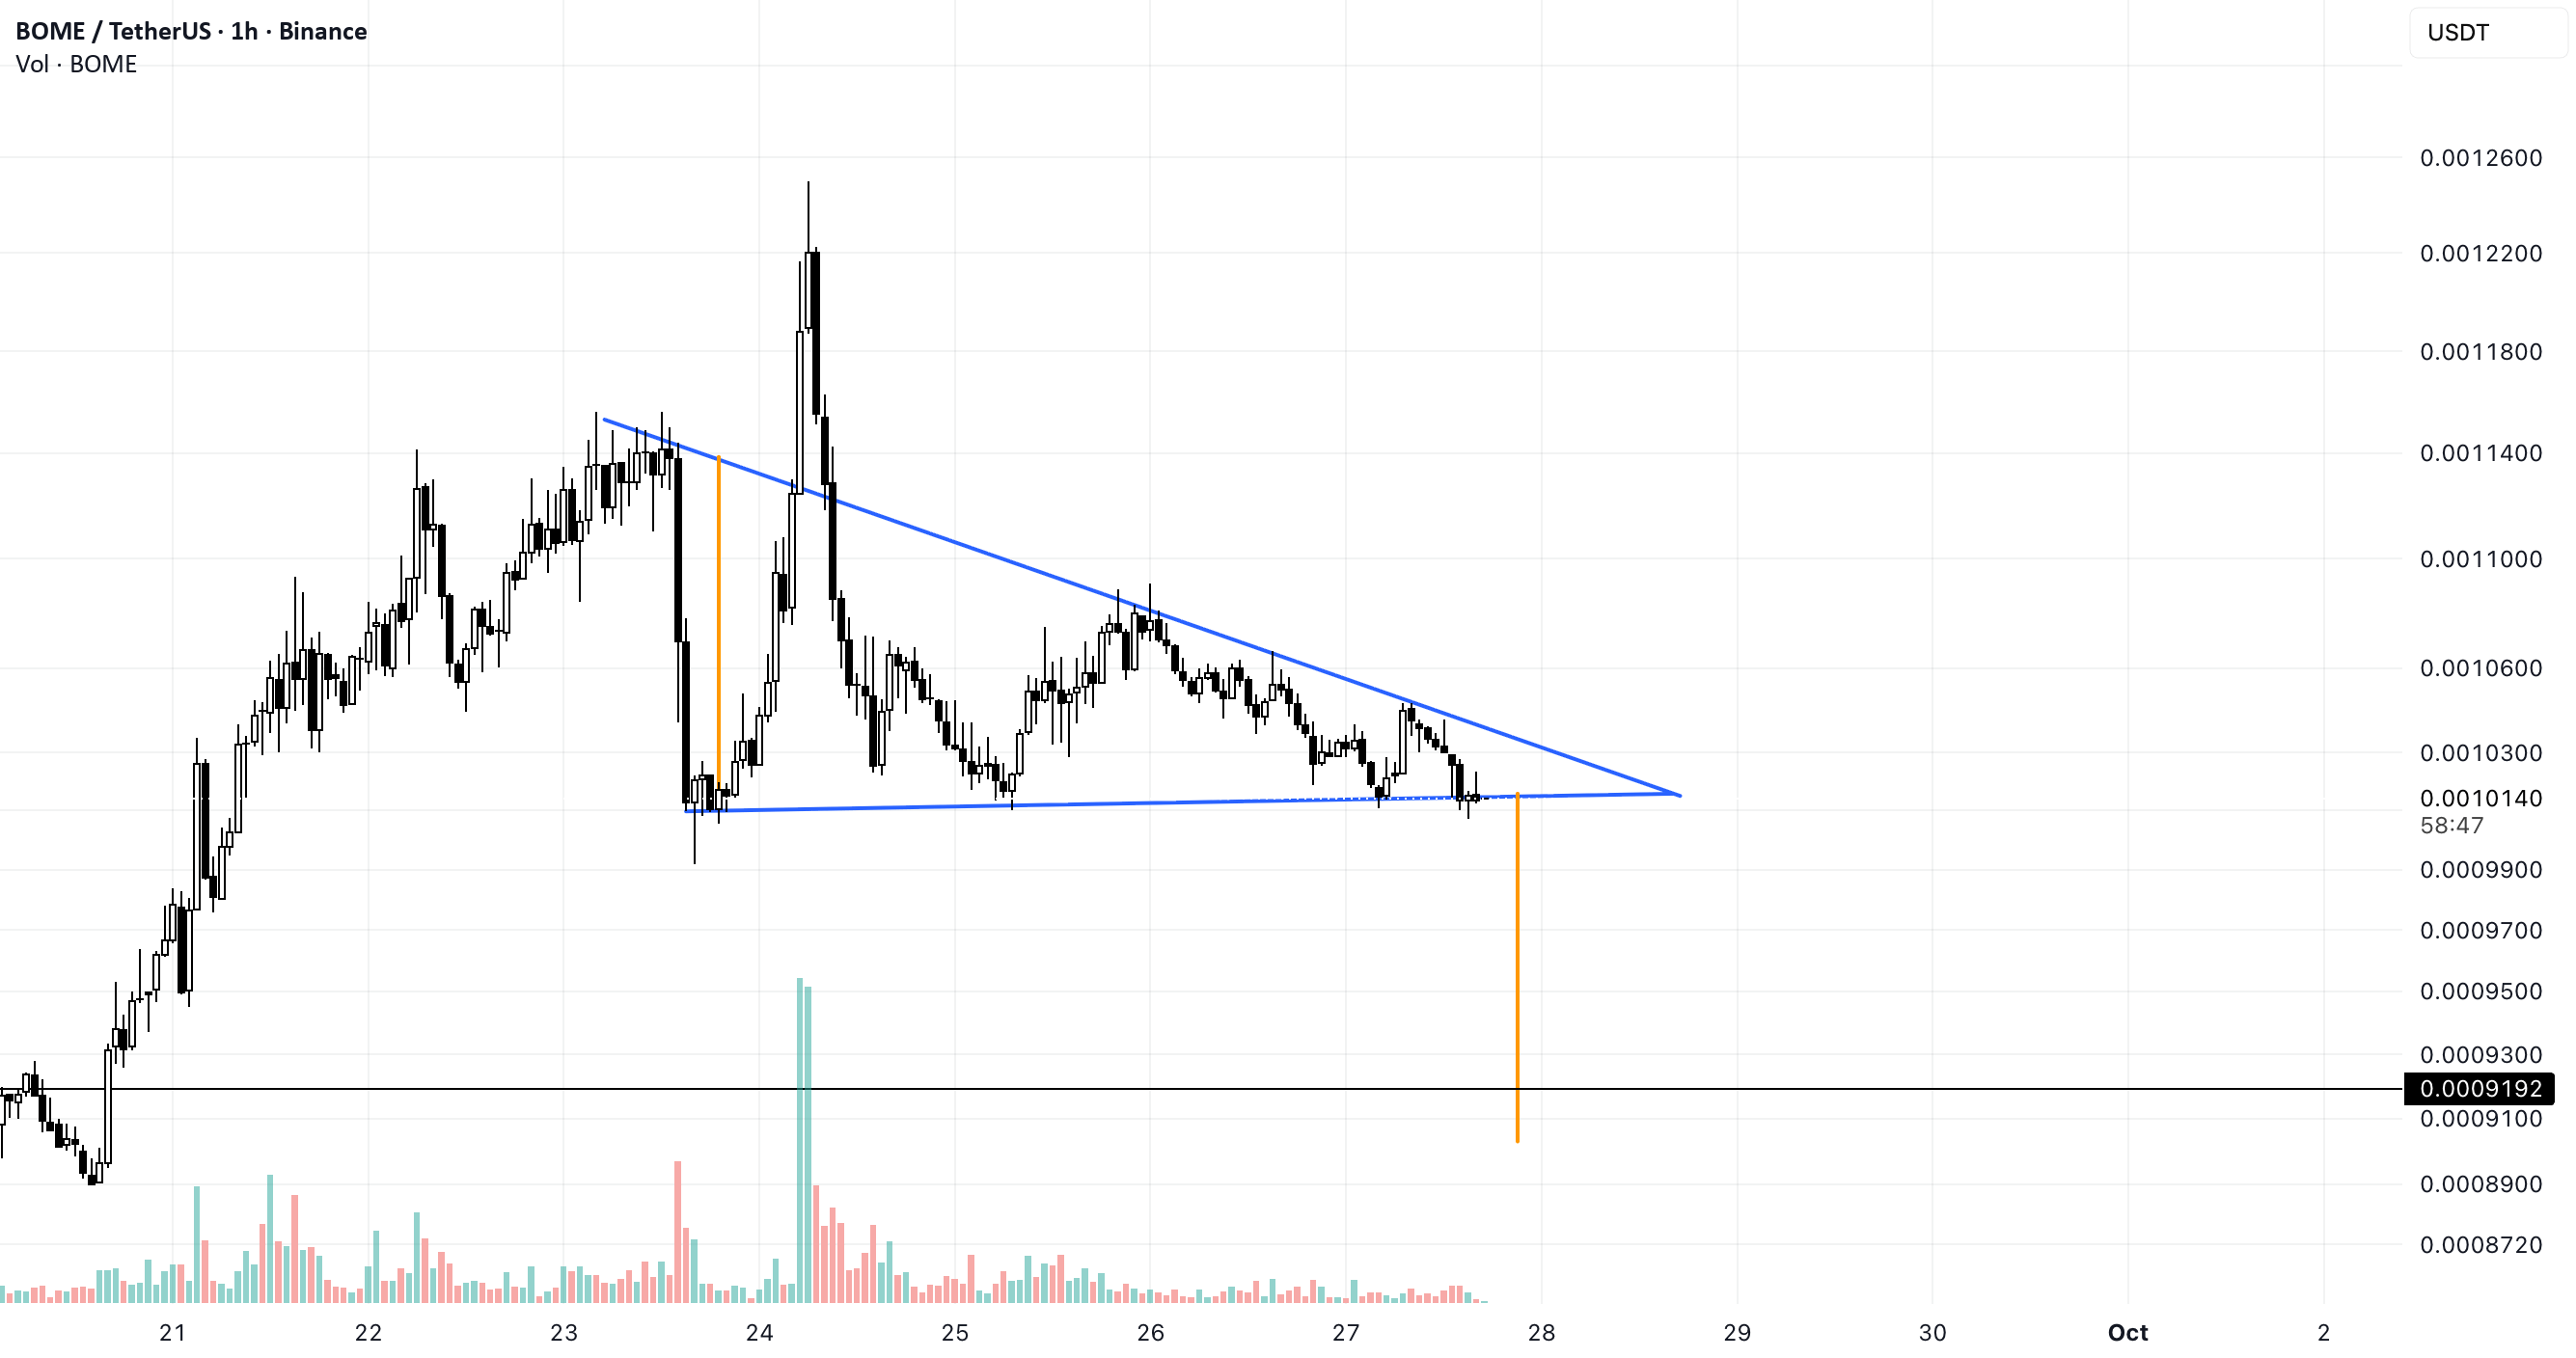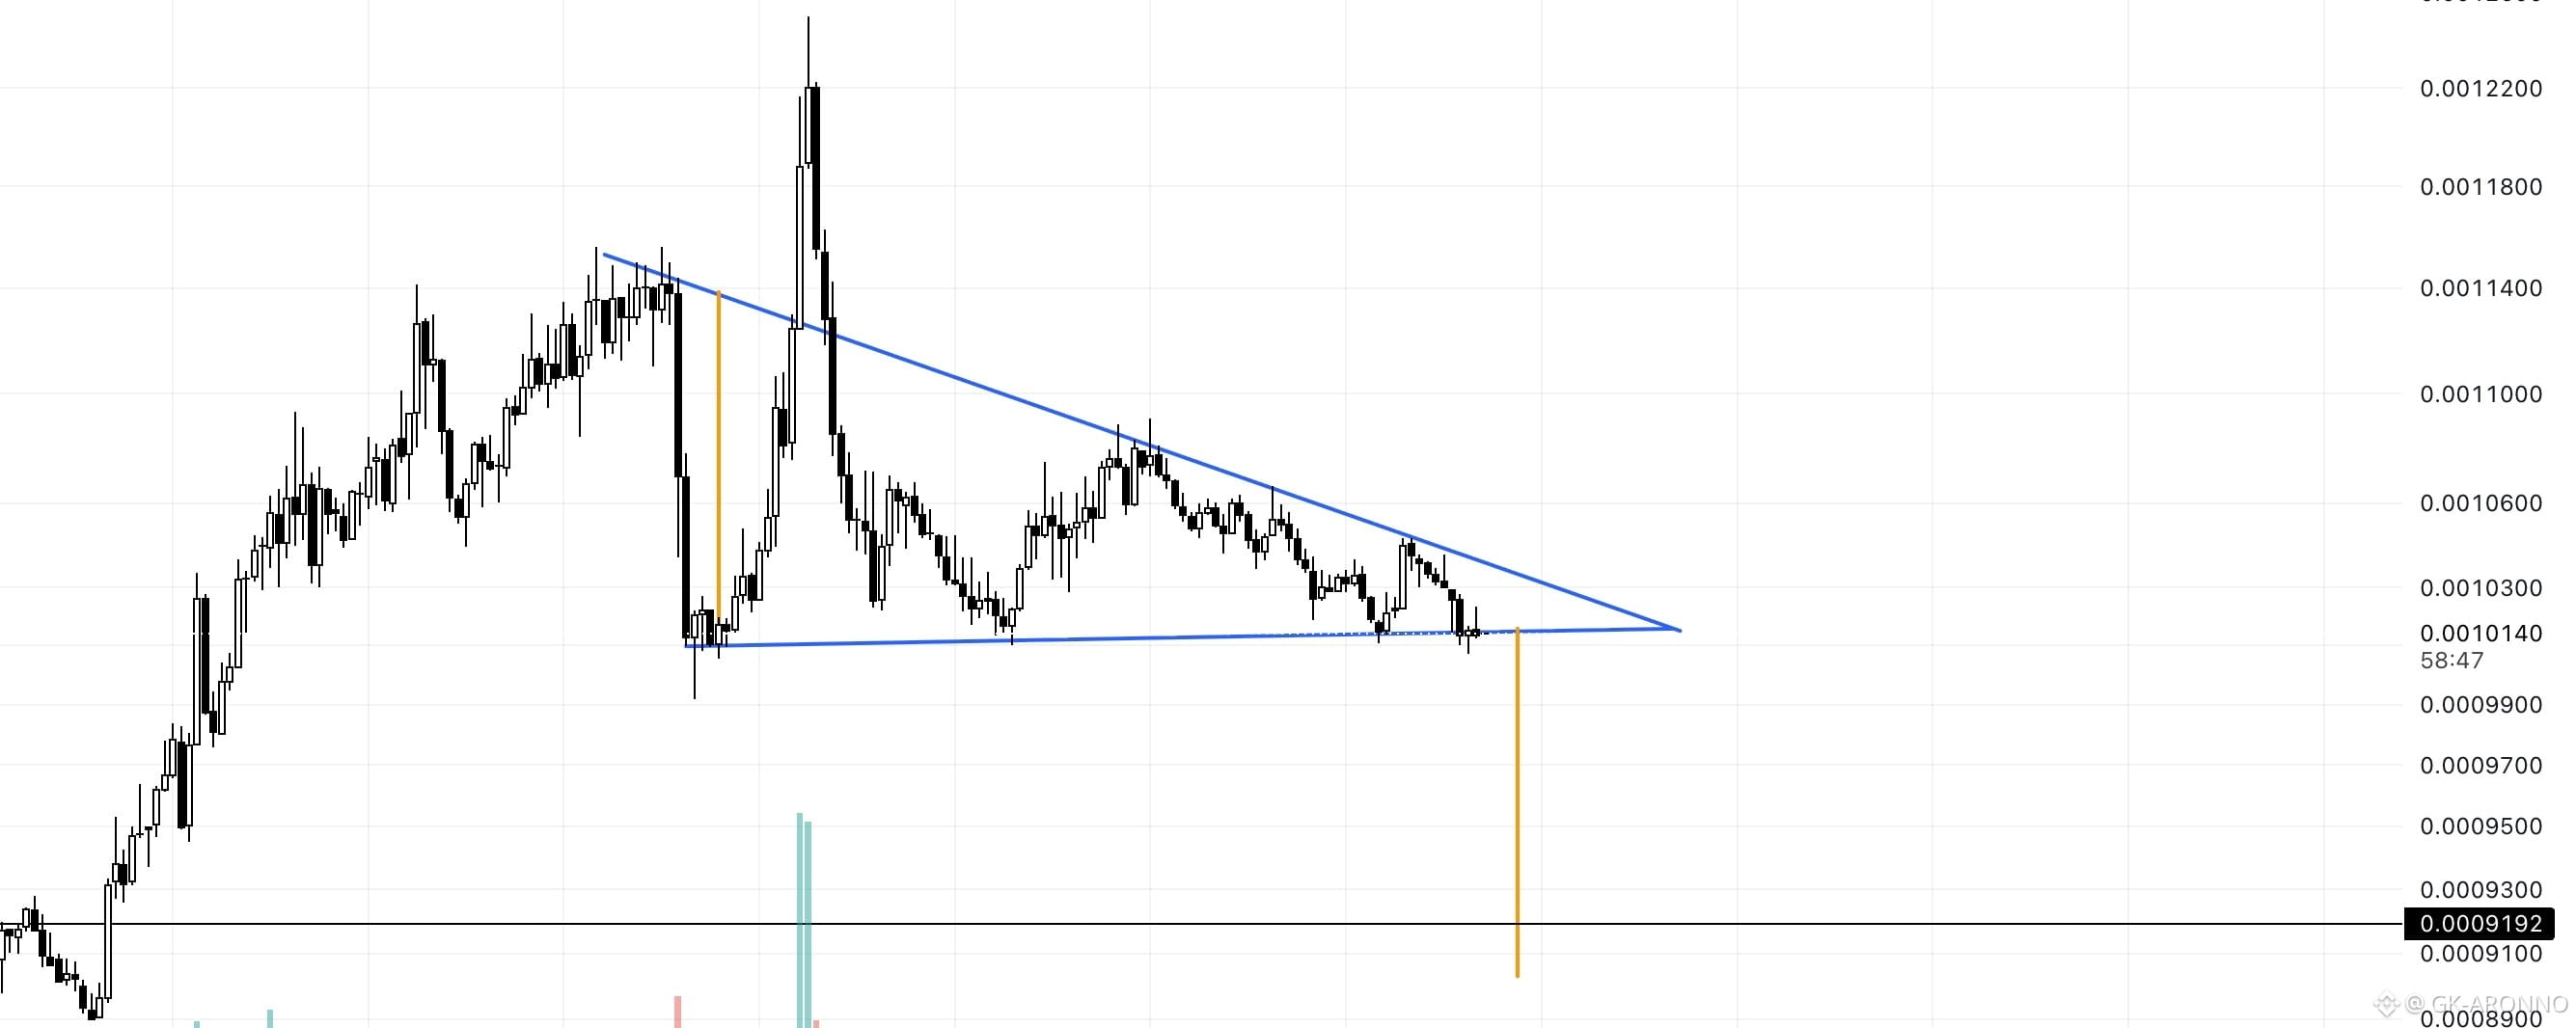

BOME/USDT is consolidating inside a descending triangle on the 1H chart, with price forming a sequence of lower highs beneath the descending resistance while repeatedly testing the horizontal support around $0.00101–$0.00102.
Price is now sitting directly on this support near the apex. The repeated touches of the lower boundary are important — each test can weaken the support, increasing the risk of a bearish breakdown.
A confirmed 1H close below $0.00101 could validate the bearish setup and open the way toward the $0.00090–$0.00092 target area.
A strong reclaim above the descending trendline would invalidate the bearish scenario and weaken the triangle setup.

BOMEUSDT
Perp.
0.0009768
-5.04%