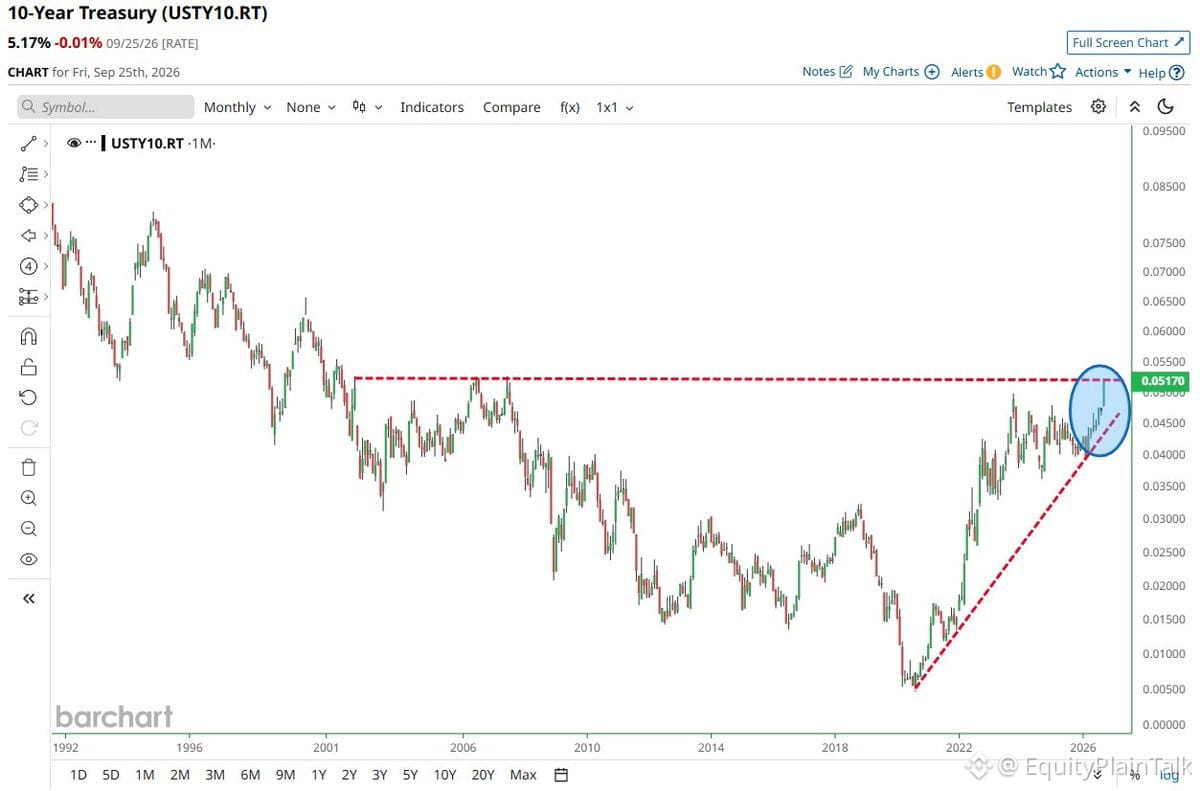
The 10-year Treasury yield is testing the upper boundary of a 25-year ascending triangle pattern. If it breaks out, we're looking at a major technical shift that could reshape portfolio positioning across equities, bonds, and risk assets.
Historically, breakouts from multi-decade chart patterns don't happen quietly. Higher yields typically pressure growth stocks, make bonds less attractive, and force a reassessment of valuations across the board.
Watch this level closely. It's not just a chart—it's a potential inflection point for the entire market structure.
Historically, breakouts from multi-decade chart patterns don't happen quietly. Higher yields typically pressure growth stocks, make bonds less attractive, and force a reassessment of valuations across the board.
Watch this level closely. It's not just a chart—it's a potential inflection point for the entire market structure.