

Jack_TheAnalyst
6 Publicações

Jack_TheAnalyst
Denunciar
Bloquear Utilizador
4 A seguir
4 Seguidores
8 Gostaram
Publicações
PINNED
·
--
Em Alta
Olá, Binance Square!
Jack_TheAnalyst está aqui
Como um criador de conteúdo profissional focado em fornecer inteligência de mercado clara e imparcial.
Estou aqui para construir uma comunidade de traders e investidores inteligentes e analíticos.
Toque no botão Seguir para se manter atualizado com comentários diários do mercado, gráficos estruturados e análises em tempo real.
$NVDAB $AAPLB $LSK
{future}(LSKUSDT)
#BinanceWillListHyperliquid(HYPE) #FedOctoberRateHikeOddsRiseTo69.7%
Olá, Binance Square!
Jack_TheAnalyst está aqui
Como um criador de conteúdo profissional focado em fornecer inteligência de mercado clara e imparcial.
Estou aqui para construir uma comunidade de traders e investidores inteligentes e analíticos.
Toque no botão Seguir para se manter atualizado com comentários diários do mercado, gráficos estruturados e análises em tempo real.
$NVDAB $AAPLB $LSK
#BinanceWillListHyperliquid(HYPE) #FedOctoberRateHikeOddsRiseTo69.7%
Jack_TheAnalyst está aqui
Como um criador de conteúdo profissional focado em fornecer inteligência de mercado clara e imparcial.
Estou aqui para construir uma comunidade de traders e investidores inteligentes e analíticos.
Toque no botão Seguir para se manter atualizado com comentários diários do mercado, gráficos estruturados e análises em tempo real.
$NVDAB $AAPLB $LSK
#BinanceWillListHyperliquid(HYPE) #FedOctoberRateHikeOddsRiseTo69.7%
2
151
Artigo
Ver tradução
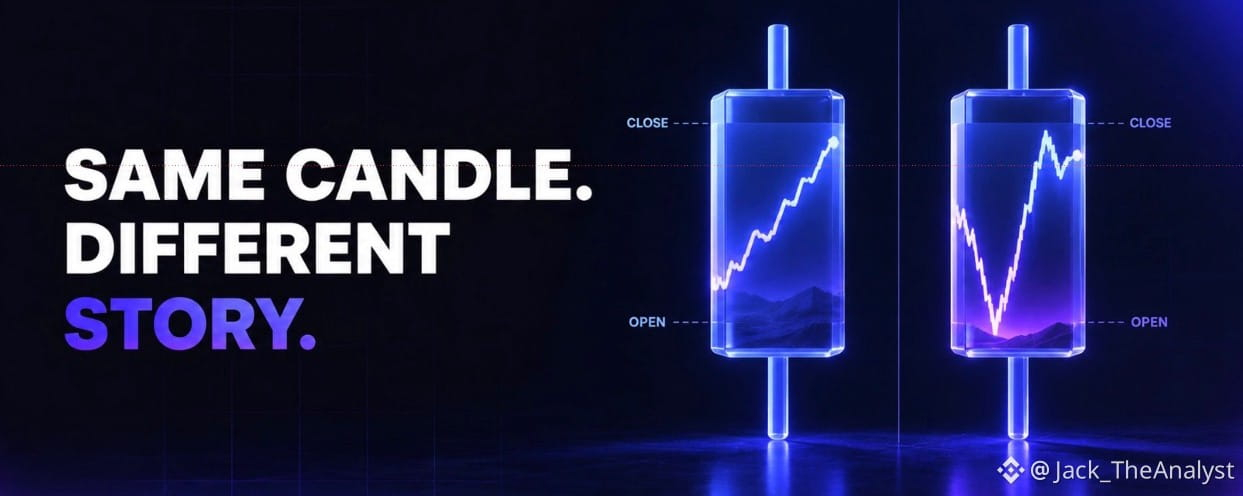
What a Candle Can Hide?Higher-timeframe candles are useful because they compress a large amount of price action into something easy to read. The problem is that two candles with almost identical opens, highs, lows and closes can be created through very different sequences of events.
That sequence can matter when evaluating what actually happened during the session.
Suppose BTC opens at $80,000 and closesat $82,000. In the first scenario, price gradually moves higher throughout the day, pullbacks remain shallow, and most of the final hours are spent near $82,000. Buyers gained ground and were able to maintain it.
Now imagine the same open and close, but BTC first drops to $77,500, aggressively recovers to $83,000 and then falls back to $82,000 before the daily close.
Both sessions finish bullish, but they tell different stories. The second contained a failed move lower, a strong recovery and then selling above the eventual closing price. None of that is fully explained by simply calling the daily candle bullish.
This becomes especially useful around important levels.
Imagine a daily candle closes slightly above resistance. Looking only at the daily chart, it may appear to be a successful breakout. But a lower timeframe might show that price broke resistance early, spent most of the session back below it and only recovered during the final hour.
Compare that with a session that breaks resistance early, retests it from above and spends the remainder of the day building higher. The daily candles could eventually look similar, but the second shows much clearer acceptance above the level.
Lower timeframes can therefore be used as a diagnostic tool rather than simply as another place to search for entries.
When a higher-timeframe candle forms at an important area, look inside it and ask a few basic questions. Which side moved first? Was that move sustained or rejected? Where did price spend most of the session? Did the close confirm the dominant behavior of the day, or did a late move dramatically change the final candle?
You do not need to dissect every daily candle.
Most of the time, the higher timeframe provides enough information on its own.
But around major breakouts, failed moves and turning points, understanding how the candle was built can reveal information that its final shape compresses away.
The candle shows the result.
Sometimes the sequence explains how meaningful that result actually was.
#BTC走势分析 $BTC #PolymarketBankFailureBetsDrawFDICConcern #BlackRockBuildsTokenizedPortfoliosForOndo
{future}(BTCUSDT)
What a Candle Can Hide?
Higher-timeframe candles are useful because they compress a large amount of price action into something easy to read. The problem is that two candles with almost identical opens, highs, lows and closes can be created through very different sequences of events.
That sequence can matter when evaluating what actually happened during the session.
Suppose BTC opens at $80,000 and closesat $82,000. In the first scenario, price gradually moves higher throughout the day, pullbacks remain shallow, and most of the final hours are spent near $82,000. Buyers gained ground and were able to maintain it.
Now imagine the same open and close, but BTC first drops to $77,500, aggressively recovers to $83,000 and then falls back to $82,000 before the daily close.
Both sessions finish bullish, but they tell different stories. The second contained a failed move lower, a strong recovery and then selling above the eventual closing price. None of that is fully explained by simply calling the daily candle bullish.
This becomes especially useful around important levels.
Imagine a daily candle closes slightly above resistance. Looking only at the daily chart, it may appear to be a successful breakout. But a lower timeframe might show that price broke resistance early, spent most of the session back below it and only recovered during the final hour.
Compare that with a session that breaks resistance early, retests it from above and spends the remainder of the day building higher. The daily candles could eventually look similar, but the second shows much clearer acceptance above the level.
Lower timeframes can therefore be used as a diagnostic tool rather than simply as another place to search for entries.
When a higher-timeframe candle forms at an important area, look inside it and ask a few basic questions. Which side moved first? Was that move sustained or rejected? Where did price spend most of the session? Did the close confirm the dominant behavior of the day, or did a late move dramatically change the final candle?
You do not need to dissect every daily candle.
Most of the time, the higher timeframe provides enough information on its own.
But around major breakouts, failed moves and turning points, understanding how the candle was built can reveal information that its final shape compresses away.
The candle shows the result.
Sometimes the sequence explains how meaningful that result actually was.
#BTC走势分析 $BTC #PolymarketBankFailureBetsDrawFDICConcern #BlackRockBuildsTokenizedPortfoliosForOndo
That sequence can matter when evaluating what actually happened during the session.
Suppose BTC opens at $80,000 and closesat $82,000. In the first scenario, price gradually moves higher throughout the day, pullbacks remain shallow, and most of the final hours are spent near $82,000. Buyers gained ground and were able to maintain it.
Now imagine the same open and close, but BTC first drops to $77,500, aggressively recovers to $83,000 and then falls back to $82,000 before the daily close.
Both sessions finish bullish, but they tell different stories. The second contained a failed move lower, a strong recovery and then selling above the eventual closing price. None of that is fully explained by simply calling the daily candle bullish.
This becomes especially useful around important levels.
Imagine a daily candle closes slightly above resistance. Looking only at the daily chart, it may appear to be a successful breakout. But a lower timeframe might show that price broke resistance early, spent most of the session back below it and only recovered during the final hour.
Compare that with a session that breaks resistance early, retests it from above and spends the remainder of the day building higher. The daily candles could eventually look similar, but the second shows much clearer acceptance above the level.
Lower timeframes can therefore be used as a diagnostic tool rather than simply as another place to search for entries.
When a higher-timeframe candle forms at an important area, look inside it and ask a few basic questions. Which side moved first? Was that move sustained or rejected? Where did price spend most of the session? Did the close confirm the dominant behavior of the day, or did a late move dramatically change the final candle?
You do not need to dissect every daily candle.
Most of the time, the higher timeframe provides enough information on its own.
But around major breakouts, failed moves and turning points, understanding how the candle was built can reveal information that its final shape compresses away.
The candle shows the result.
Sometimes the sequence explains how meaningful that result actually was.
#BTC走势分析 $BTC #PolymarketBankFailureBetsDrawFDICConcern #BlackRockBuildsTokenizedPortfoliosForOndo
71
·
--
Em Alta
SOL Swing Long Trade
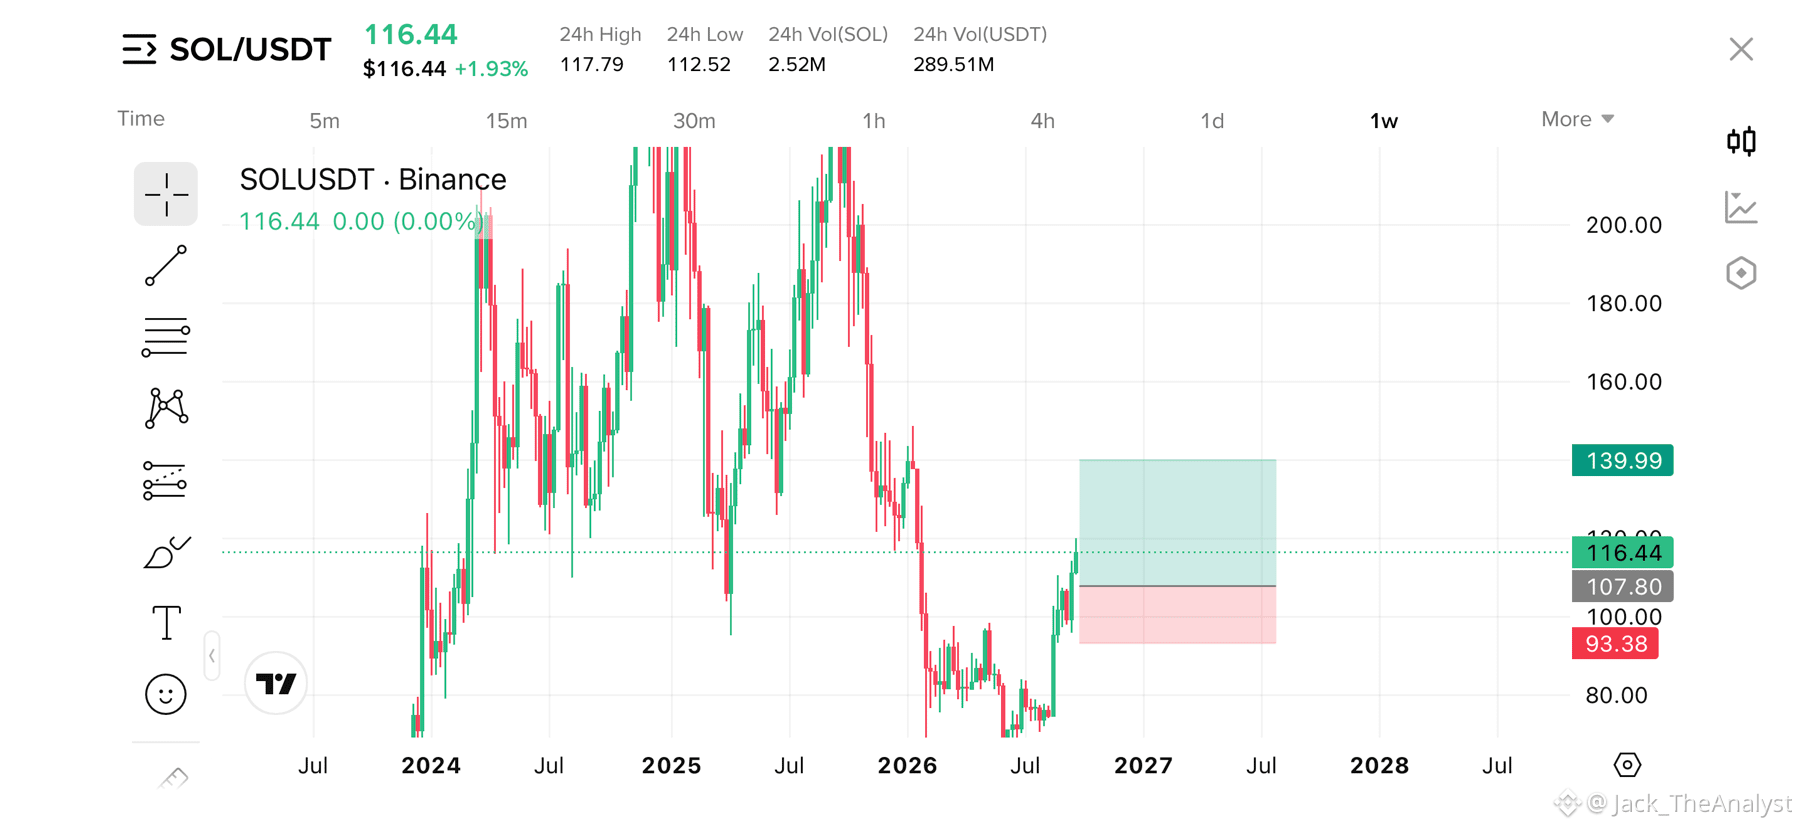
A Solana ($SOL) está a imprimir uma configuração estrutural sólida no gráfico semanal, defendendo áreas-chave de valor após uma fase prolongada de correção.
A resistência foi rompida e a vela semanal fechou acima e voltou a testar o nível.
(RR): ~1 : 2.24
Nível de Entrada: $107.80
Take Profit (TP): $140.00
Stop Loss (SL): $93.38
Parcial pode ser garantido em $140.00 e então podemos manter a operação até o próximo nível até $200.00 para o Take profit final.
#solonapumping #sol板块 #SolanaUSTD
$NVDAB $AAPLB $AAPL.US
SOL Swing Long Trade
A Solana ($SOL) está a imprimir uma configuração estrutural sólida no gráfico semanal, defendendo áreas-chave de valor após uma fase prolongada de correção.
A resistência foi rompida e a vela semanal fechou acima e voltou a testar o nível.
(RR): ~1 : 2.24
Nível de Entrada: $107.80
Take Profit (TP): $140.00
Stop Loss (SL): $93.38
Parcial pode ser garantido em $140.00 e então podemos manter a operação até o próximo nível até $200.00 para o Take profit final.
#solonapumping #sol板块 #SolanaUSTD
$NVDAB $AAPLB $AAPL.US
A Solana ($SOL) está a imprimir uma configuração estrutural sólida no gráfico semanal, defendendo áreas-chave de valor após uma fase prolongada de correção.
A resistência foi rompida e a vela semanal fechou acima e voltou a testar o nível.
(RR): ~1 : 2.24
Nível de Entrada: $107.80
Take Profit (TP): $140.00
Stop Loss (SL): $93.38
Parcial pode ser garantido em $140.00 e então podemos manter a operação até o próximo nível até $200.00 para o Take profit final.
#solonapumping #sol板块 #SolanaUSTD
$NVDAB $AAPLB $AAPL.US
1
78
·
--
Em Alta
#dodgecoin DOGE/USDT
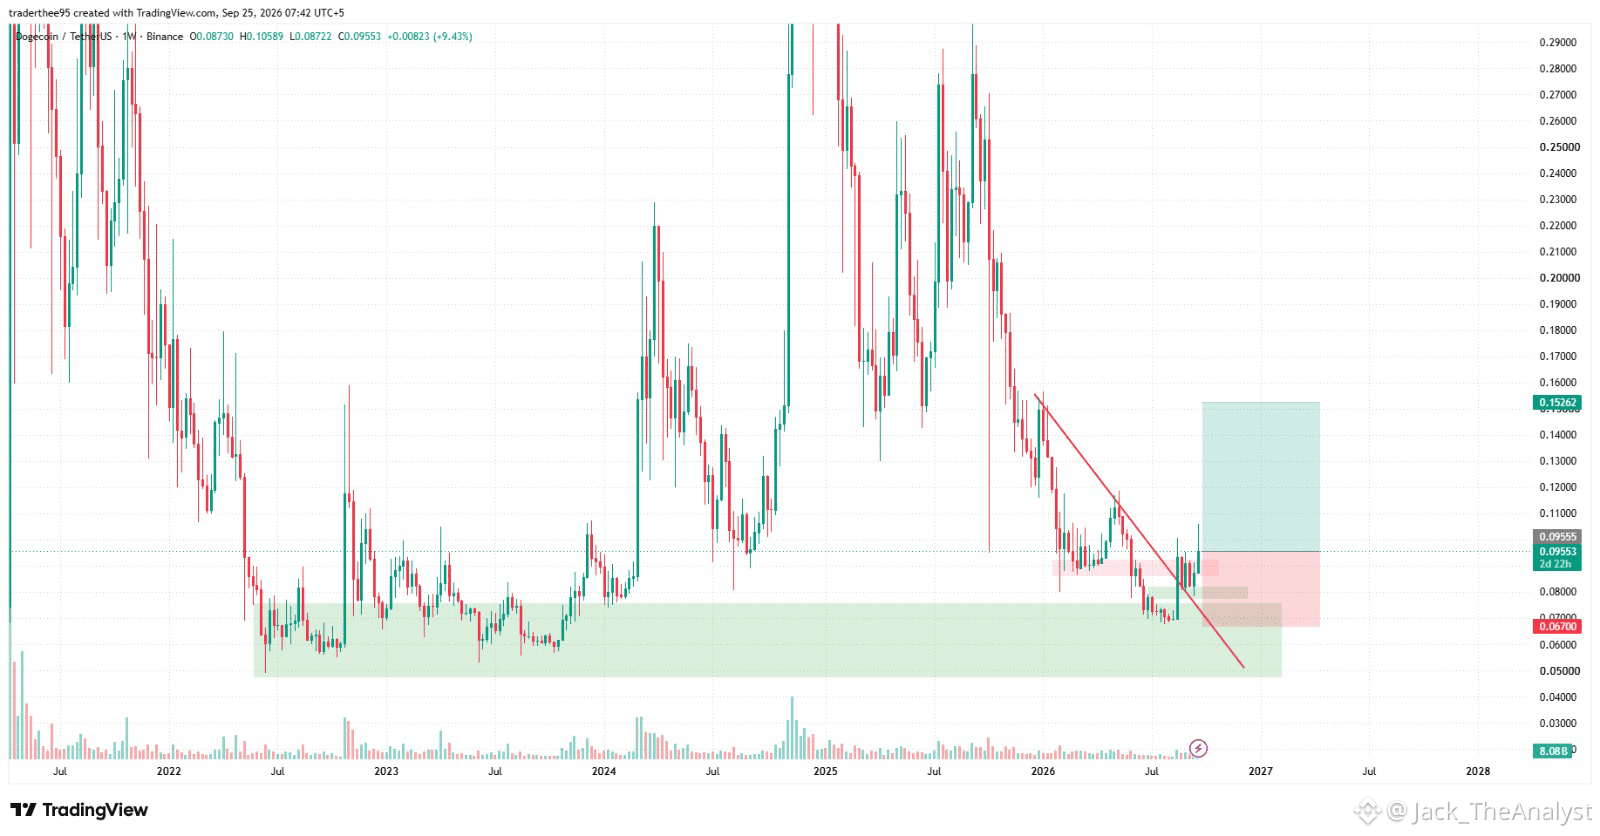
O DOGE testou novamente uma zona macro de suporte-chave (variando de US$ 0,0500 a US$ 0,0700) que se originou no início de 2021.
Após o rebote dessa grande área de suporte, o preço rompeu o nível inicial de Resistência-que-se-tornou-Suporte (RBS) em torno de US$ 0,08892, coincidindo com uma ruptura limpa acima da principal linha de tendência descendente.
Depois de recuperar a linha de tendência da ruptura, o DOGE avançou para romper sua recente zona de resistência, confirmando uma mudança estrutural em direção a um cenário de continuidade bullish forte.
Ponto de Entrada: ~US$ 0,09508 (Preço de mercado atual ou pequena retração).
Stop Loss (SL): US$ 0,06700 (Posicionado com segurança abaixo do suporte estrutural-chave).
Take Profit (TP): US$ 0,15262 (Alvo principal na resistência da máxima oscilação-chave).
#Dogecoin #doge⚡ #DOGEUSDT
$AAPL.US $AAPLB $GOOGL.US
#dodgecoin DOGE/USDT
O DOGE testou novamente uma zona macro de suporte-chave (variando de US$ 0,0500 a US$ 0,0700) que se originou no início de 2021.
Após o rebote dessa grande área de suporte, o preço rompeu o nível inicial de Resistência-que-se-tornou-Suporte (RBS) em torno de US$ 0,08892, coincidindo com uma ruptura limpa acima da principal linha de tendência descendente.
Depois de recuperar a linha de tendência da ruptura, o DOGE avançou para romper sua recente zona de resistência, confirmando uma mudança estrutural em direção a um cenário de continuidade bullish forte.
Ponto de Entrada: ~US$ 0,09508 (Preço de mercado atual ou pequena retração).
Stop Loss (SL): US$ 0,06700 (Posicionado com segurança abaixo do suporte estrutural-chave).
Take Profit (TP): US$ 0,15262 (Alvo principal na resistência da máxima oscilação-chave).
#Dogecoin #doge⚡ #DOGEUSDT
$AAPL.US $AAPLB $GOOGL.US
O DOGE testou novamente uma zona macro de suporte-chave (variando de US$ 0,0500 a US$ 0,0700) que se originou no início de 2021.
Após o rebote dessa grande área de suporte, o preço rompeu o nível inicial de Resistência-que-se-tornou-Suporte (RBS) em torno de US$ 0,08892, coincidindo com uma ruptura limpa acima da principal linha de tendência descendente.
Depois de recuperar a linha de tendência da ruptura, o DOGE avançou para romper sua recente zona de resistência, confirmando uma mudança estrutural em direção a um cenário de continuidade bullish forte.
Ponto de Entrada: ~US$ 0,09508 (Preço de mercado atual ou pequena retração).
Stop Loss (SL): US$ 0,06700 (Posicionado com segurança abaixo do suporte estrutural-chave).
Take Profit (TP): US$ 0,15262 (Alvo principal na resistência da máxima oscilação-chave).
#Dogecoin #doge⚡ #DOGEUSDT
$AAPL.US $AAPLB $GOOGL.US
1
195
·
--
Em Alta
#Litecoin Major Multi-Year Accumulation Breakdown & Rebound — Longo Setup
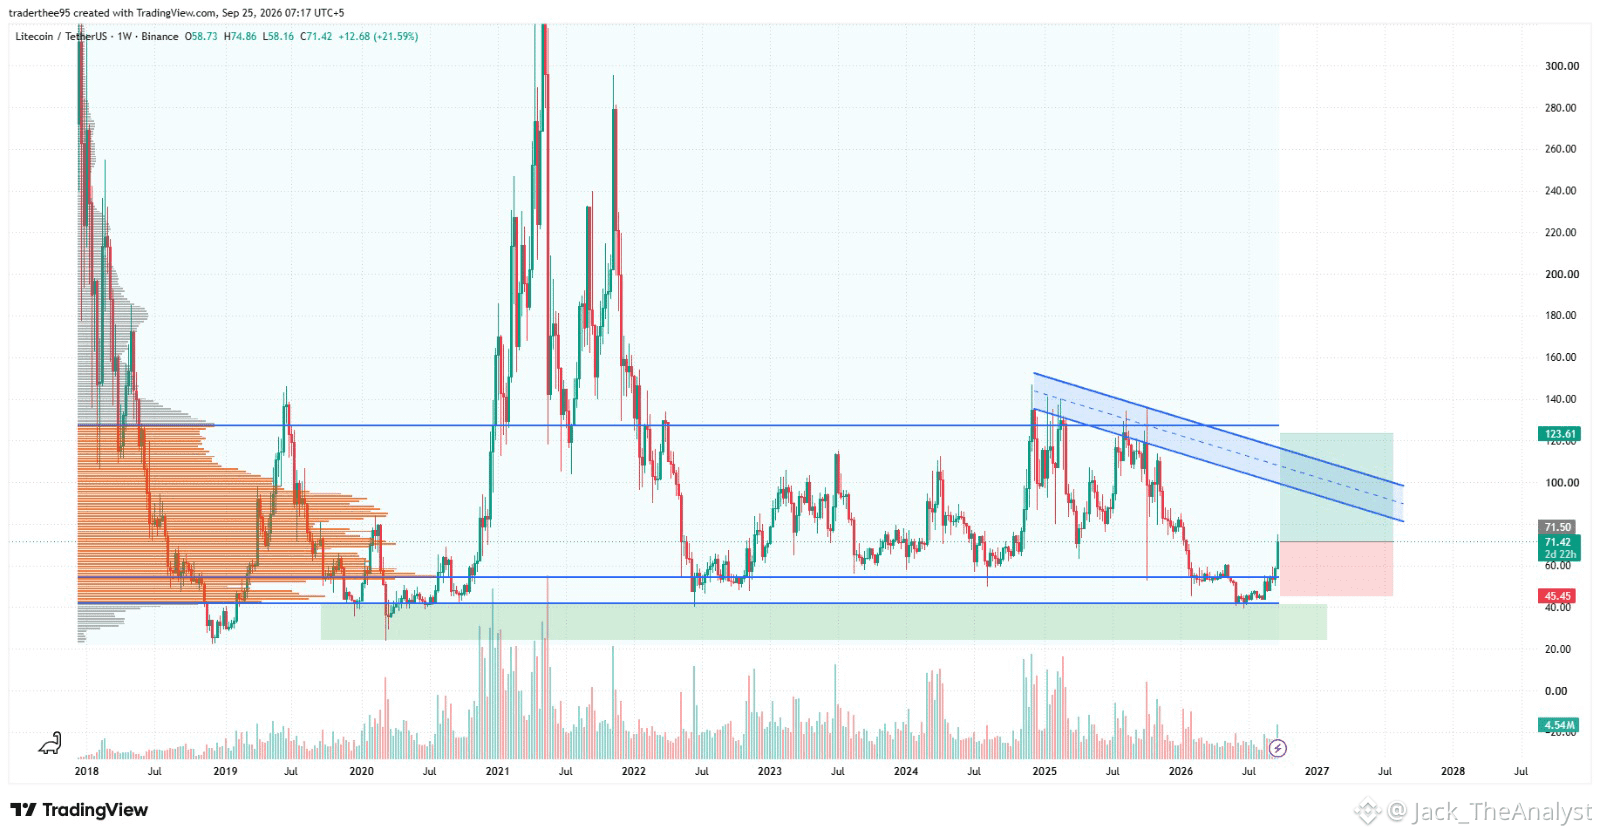
A ação do preço do Litecoin recentemente ultrapassou um nível de resistência importante em torno de US$ 60,47, que agora está atuando como uma área de suporte fundamental. Essa mudança na estrutura do mercado vale a pena ser acompanhada, pois manter o preço acima dessa região pode sustentar a possibilidade de que o movimento recente abaixo da faixa anterior tenha sido uma divergência, e não uma quebra sustentada.
Perfil de Volume: Construção sólida de acumulação nos níveis mais baixos indica compradores de longo prazo defendendo essa região.
Zona de Entrada: Preço Atual do Mercado (71,04) ou em pequenas retrações na direção de US$ 60,00 - US$ 65,00
Take Profit (TP): US$ 123,60 (Resistência Superior & Alvo do Canal)
Stop Loss (SL): US$ 45,45 (Abaixo do suporte estrutural-chave)
#Litecoin #LitecoinUpdate #LitecoinRevolution
$NVDAB $AAPLB $AAPL.US
#Litecoin Major Multi-Year Accumulation Breakdown & Rebound — Longo Setup
A ação do preço do Litecoin recentemente ultrapassou um nível de resistência importante em torno de US$ 60,47, que agora está atuando como uma área de suporte fundamental. Essa mudança na estrutura do mercado vale a pena ser acompanhada, pois manter o preço acima dessa região pode sustentar a possibilidade de que o movimento recente abaixo da faixa anterior tenha sido uma divergência, e não uma quebra sustentada.
Perfil de Volume: Construção sólida de acumulação nos níveis mais baixos indica compradores de longo prazo defendendo essa região.
Zona de Entrada: Preço Atual do Mercado (71,04) ou em pequenas retrações na direção de US$ 60,00 - US$ 65,00
Take Profit (TP): US$ 123,60 (Resistência Superior & Alvo do Canal)
Stop Loss (SL): US$ 45,45 (Abaixo do suporte estrutural-chave)
#Litecoin #LitecoinUpdate #LitecoinRevolution
$NVDAB $AAPLB $AAPL.US
A ação do preço do Litecoin recentemente ultrapassou um nível de resistência importante em torno de US$ 60,47, que agora está atuando como uma área de suporte fundamental. Essa mudança na estrutura do mercado vale a pena ser acompanhada, pois manter o preço acima dessa região pode sustentar a possibilidade de que o movimento recente abaixo da faixa anterior tenha sido uma divergência, e não uma quebra sustentada.
Perfil de Volume: Construção sólida de acumulação nos níveis mais baixos indica compradores de longo prazo defendendo essa região.
Zona de Entrada: Preço Atual do Mercado (71,04) ou em pequenas retrações na direção de US$ 60,00 - US$ 65,00
Take Profit (TP): US$ 123,60 (Resistência Superior & Alvo do Canal)
Stop Loss (SL): US$ 45,45 (Abaixo do suporte estrutural-chave)
#Litecoin #LitecoinUpdate #LitecoinRevolution
$NVDAB $AAPLB $AAPL.US
1
135
·
--
Em Alta
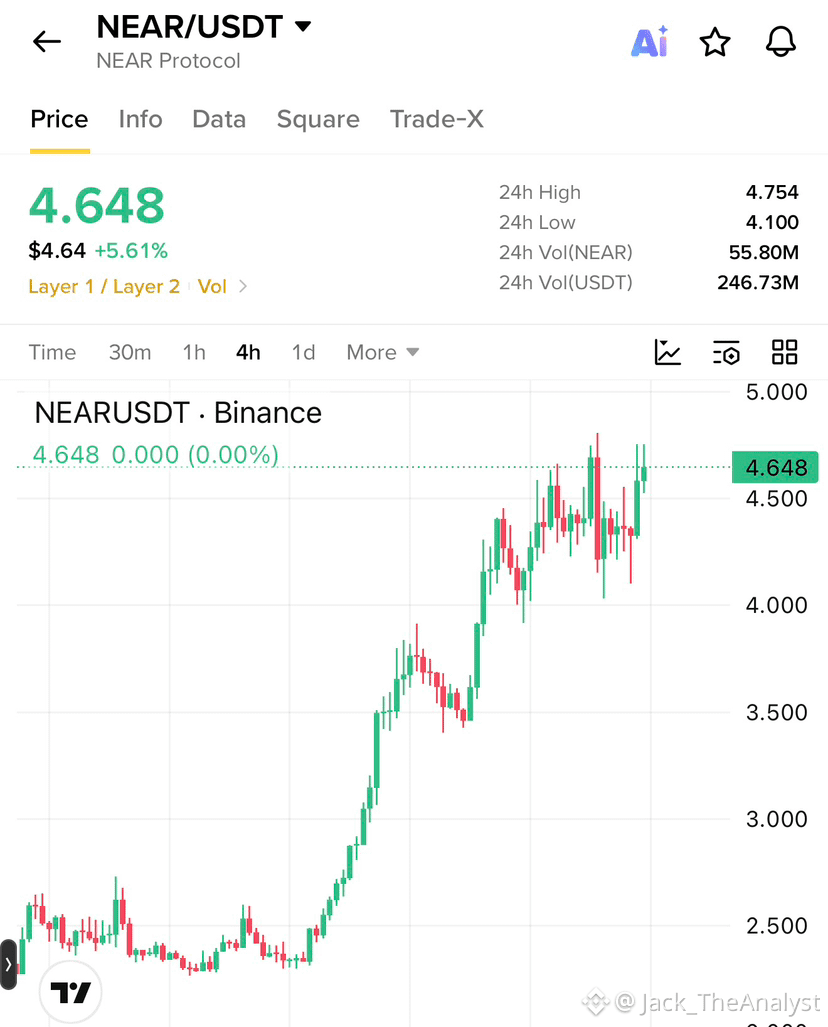
O NEAR Protocol ($NEAR) está demonstrando um enorme impulso de alta no gráfico de 4 horas, rompendo os níveis de consolidação de vários meses para alcançar US$ 4,65.
Para Compras: Um fechamento confirmado de uma vela de 4 horas acima de US$ 4,75 abre caminho para US$ 5,00, com alvos secundários em swing nos US$ 5,50 e US$ 6,00.
Cenário Bearish / Pullback: A falha em romper US$ 4,75 pode levar a realização de lucros no curto prazo em direção à zona de suporte entre US$ 4,10 e US$ 4,20 antes de outra tentativa de alta.
#Near #NEARUSDT #NEAR🚀🚀🚀 $NEAR
{spot}(NEARUSDT)
O NEAR Protocol ($NEAR ) está demonstrando um enorme impulso de alta no gráfico de 4 horas, rompendo os níveis de consolidação de vários meses para alcançar US$ 4,65.
Para Compras: Um fechamento confirmado de uma vela de 4 horas acima de US$ 4,75 abre caminho para US$ 5,00, com alvos secundários em swing nos US$ 5,50 e US$ 6,00.
Cenário Bearish / Pullback: A falha em romper US$ 4,75 pode levar a realização de lucros no curto prazo em direção à zona de suporte entre US$ 4,10 e US$ 4,20 antes de outra tentativa de alta.
#Near #NEARUSDT #NEAR🚀🚀🚀 $NEAR
Para Compras: Um fechamento confirmado de uma vela de 4 horas acima de US$ 4,75 abre caminho para US$ 5,00, com alvos secundários em swing nos US$ 5,50 e US$ 6,00.
Cenário Bearish / Pullback: A falha em romper US$ 4,75 pode levar a realização de lucros no curto prazo em direção à zona de suporte entre US$ 4,10 e US$ 4,20 antes de outra tentativa de alta.
#Near #NEARUSDT #NEAR🚀🚀🚀 $NEAR
3
717
Inicia sessão para explorar mais conteúdos
Junta-te a utilizadores de criptomoedas de todo o mundo na Binance Square
⚡️ Obtém informações úteis e recentes sobre criptomoedas.
💬 Com a confiança da maior exchange de criptomoedas do mundo.
👍 Descobre perspetivas reais de criadores verificados.
E-mail/Número de telefone
Tópicos em Tendência
CircleMints500MUSDCOnSolana
2,145 visualizações
184 a discutir
💰 MASSIVO: Circle Minta US$ 500M em $USDC na Solana!
A Circle acabou de cunhar 500 Milhões de $USDC na Solana em 2 transações ($250M + $250M) em 25 de setembro, em apenas 5,5 horas! 🚀
Agora a Solana tem $7,48B+ de dominância em $USDC — mais de 50% do seu fornecimento total de stablecoins de $14,7B.
Por que Solana?
⚡️ Velocidade: 65k TPS
💸 Taxas baixas: $0,00025
🔥 Hub de DeFi: Jupiter, Raydium em alta
Este é um dos maiores mintings em um único dia & é um sinal claro de GRANDE demanda institucional pelo ecossistema da Solana.
Touro para $SOL? 👇
#Circle #USDC #Solana #Stablecoin #DeFi#circlemints500musdconsolana
True News
·8 gostos
·2.3k visualizações
PolymarketBankFailureBetsDrawFDICConcern
13,635 visualizações
437 a discutir
BlackRockBuildsTokenizedPortfoliosForOndo
10,534 visualizações
307 a discutir