🚨 BITCOIN: IS THE 200-DAY MOVING AVERAGE TELLING US SOMETHING? ₿👀
$BTC
One pattern on this chart stands out:
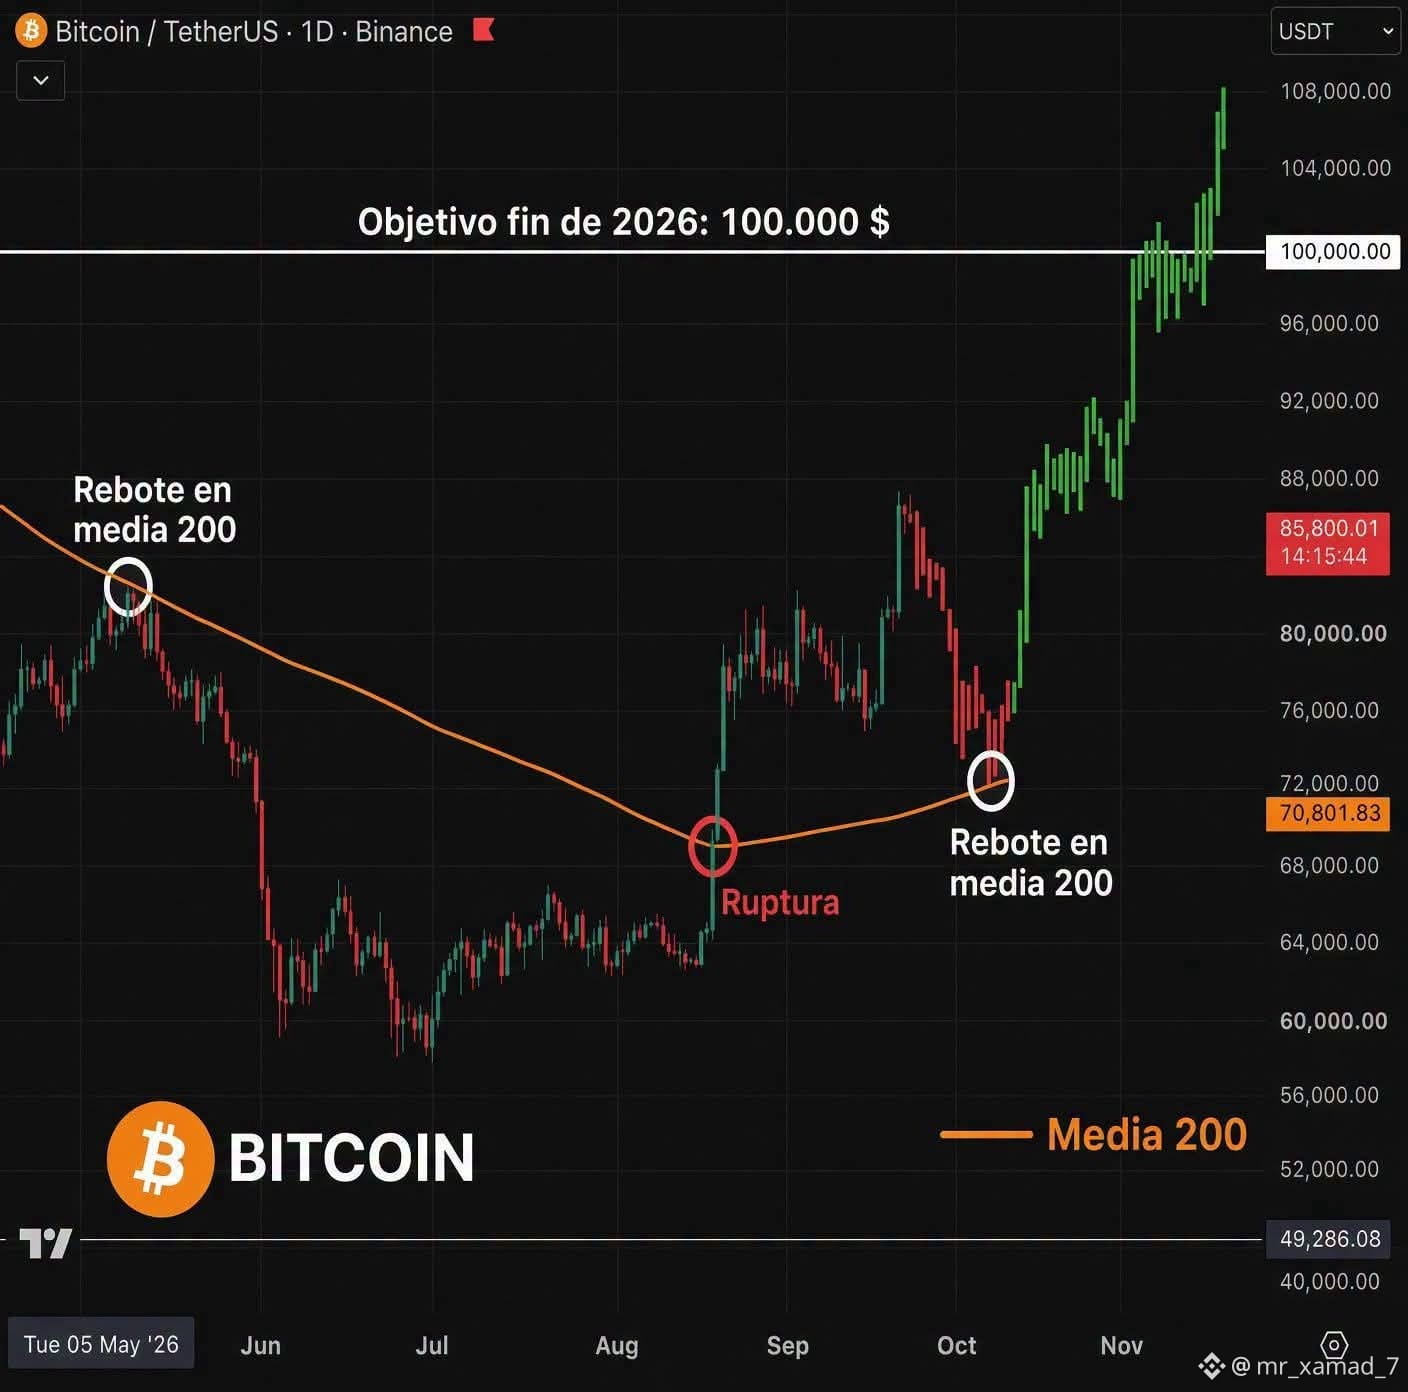
Bitcoin previously found a strong reaction around the 200-day moving average…
And after another move back toward the same area, BTC once again started pushing higher.
Now the chart highlights a potential $100K level as a year-end scenario.
But here’s the real question:
Are these repeated reactions around the 200-day MA actually showing a meaningful market structure…
or can similar-looking setups simply be coincidence?
The $100K level is a scenario shown on the chart — NOT a prediction.
What matters more to you here?
📌 The 200-day MA
📌 The $100K psychological level
📌 Or the overall price structure?
Tell us what specific signal would confirm or invalidate your view. 👇
Save this chart and share it with someone who follows Bitcoin cycles.
#Bitcoin #BTC #Crypto #BitcoinAnalysis #CryptoMarkets
$BTC
One pattern on this chart stands out:
Bitcoin previously found a strong reaction around the 200-day moving average…
And after another move back toward the same area, BTC once again started pushing higher.
Now the chart highlights a potential $100K level as a year-end scenario.
But here’s the real question:
Are these repeated reactions around the 200-day MA actually showing a meaningful market structure…
or can similar-looking setups simply be coincidence?
The $100K level is a scenario shown on the chart — NOT a prediction.
What matters more to you here?
📌 The 200-day MA
📌 The $100K psychological level
📌 Or the overall price structure?
Tell us what specific signal would confirm or invalidate your view. 👇
Save this chart and share it with someone who follows Bitcoin cycles.
#Bitcoin #BTC #Crypto #BitcoinAnalysis #CryptoMarkets