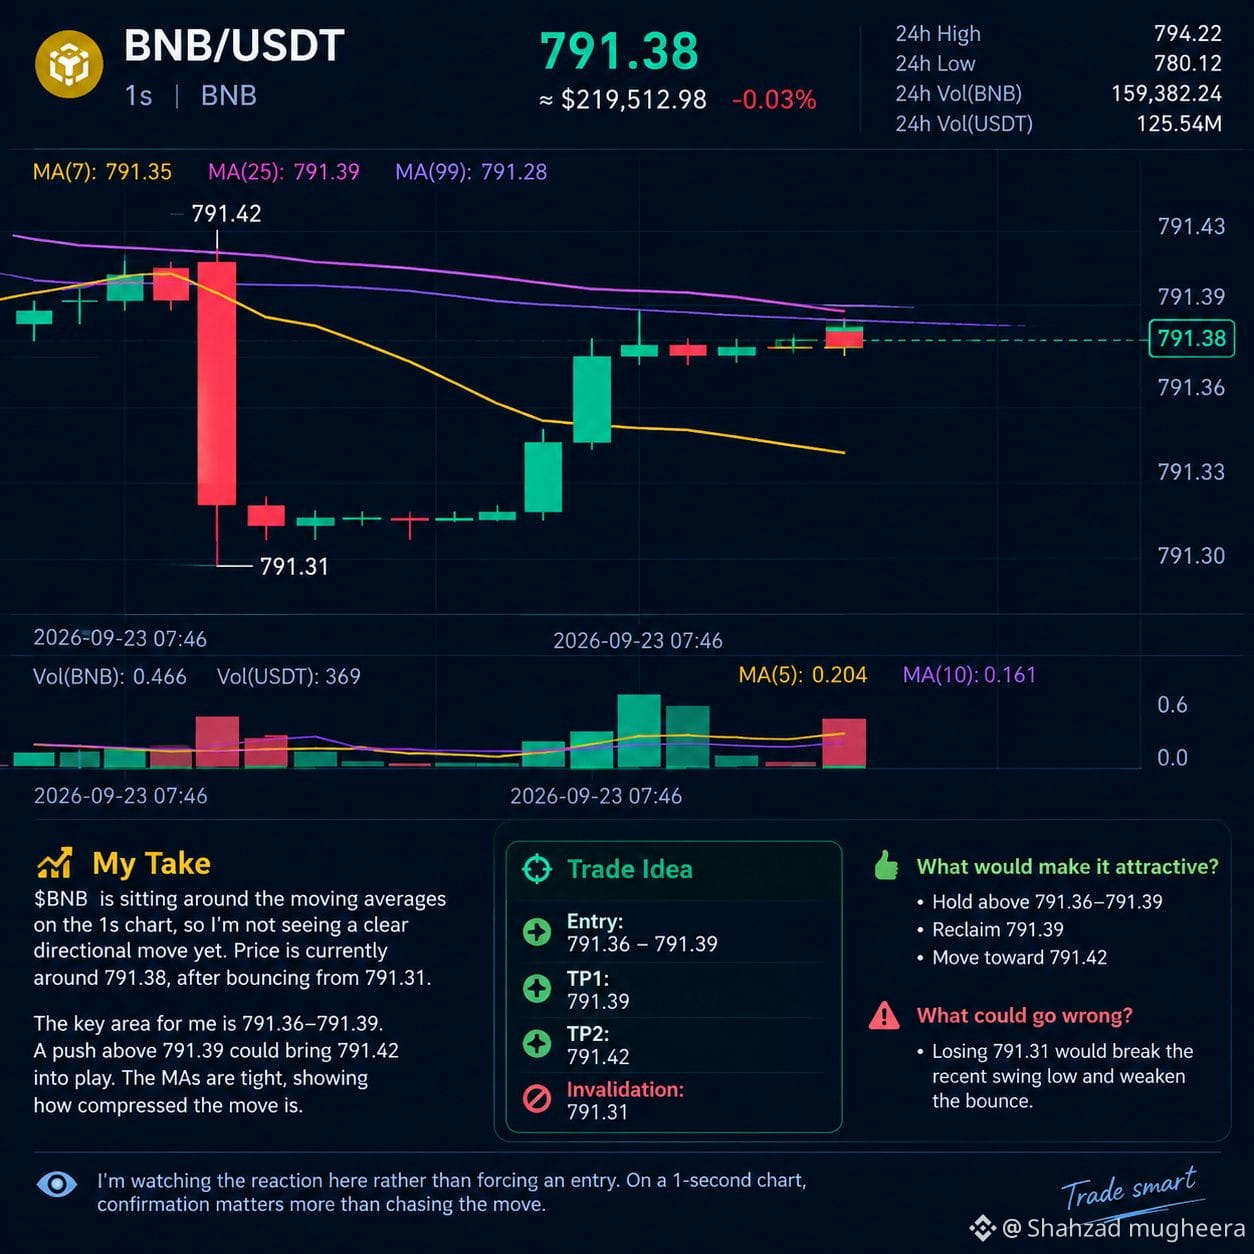
$BNB is sitting right around the moving averages on the 1s chart, so I’m not seeing a clean directional move yet. Price is currently around 791.38, after bouncing from the visible 791.31 low.
For me, the key area is 791.36–791.39. Price needs to hold this zone and push back above 791.39 for the setup to become more interesting. The recent visible high around 791.42 is the first resistance I’d watch.
📍 Entry: 791.36–791.39
🎯 TP1: 791.39
🎯 TP2: 791.42
🛑 Invalidation: 791.31
The moving averages are tightly grouped around the current price, which shows how compressed the move is. I’d rather see price hold above the nearby averages and reclaim 791.39 than chase the current candle.
If price loses 791.31, I’d step away from this setup because that would break the recent visible swing low and weaken the bounce.
I’m watching the reaction here rather than forcing an entry. On a 1-second chart, confirmation matters even more because the price action can change extremely quickly.
For me, the key area is 791.36–791.39. Price needs to hold this zone and push back above 791.39 for the setup to become more interesting. The recent visible high around 791.42 is the first resistance I’d watch.
📍 Entry: 791.36–791.39
🎯 TP1: 791.39
🎯 TP2: 791.42
🛑 Invalidation: 791.31
The moving averages are tightly grouped around the current price, which shows how compressed the move is. I’d rather see price hold above the nearby averages and reclaim 791.39 than chase the current candle.
If price loses 791.31, I’d step away from this setup because that would break the recent visible swing low and weaken the bounce.
I’m watching the reaction here rather than forcing an entry. On a 1-second chart, confirmation matters even more because the price action can change extremely quickly.