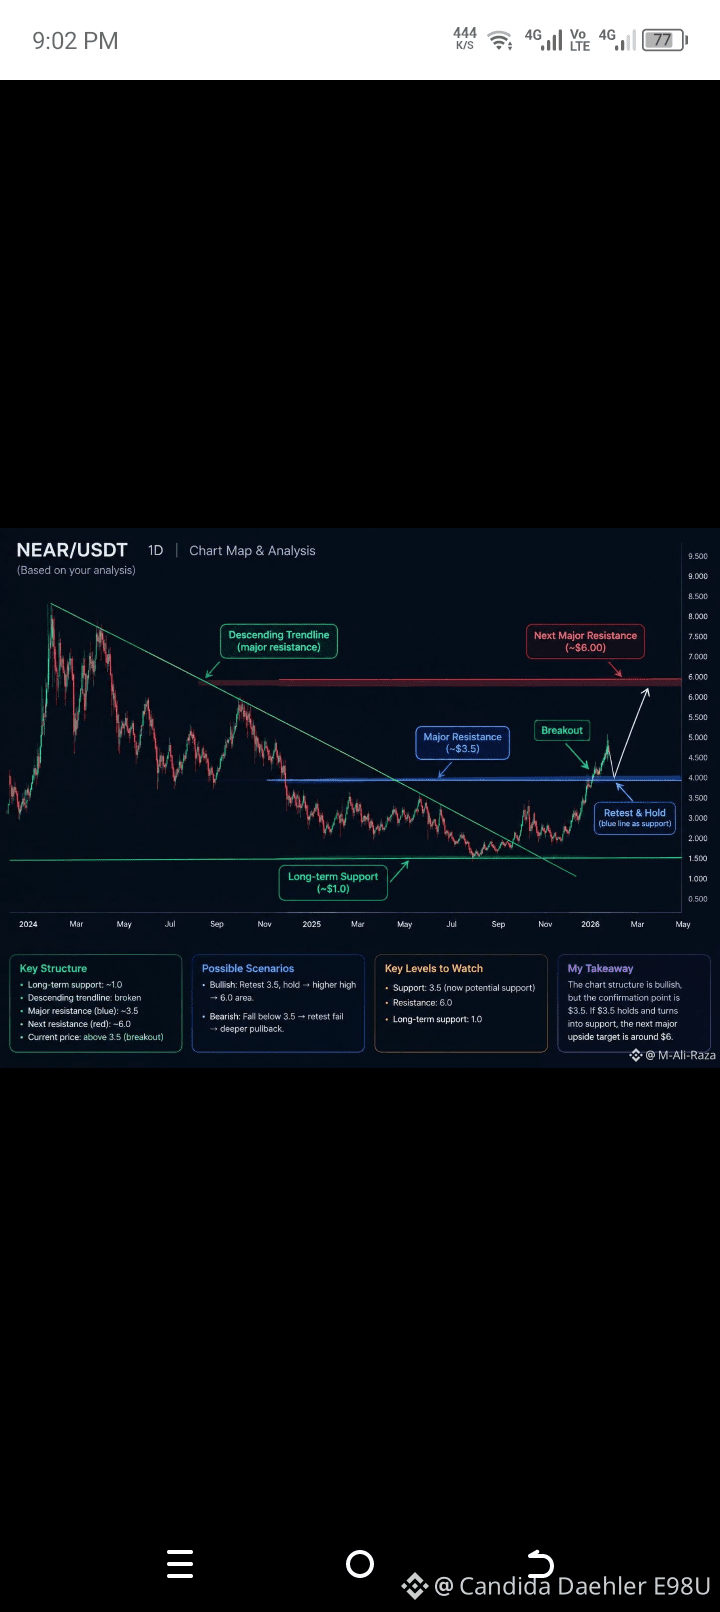
📊 NEAR/USDT:$ My 1D Chart Analysis
I’ve been studying NEAR through price action and market structure, and this is what I’m seeing.
NEAR spent a long period below a descending trendline after the major highs of 2024. At the same time, the ~$1 area acted as a major long-term support.
After months of consolidation, price finally broke above the descending trendline and started moving upward.
🔵 The key level: ~$3.50
The $3.50 area had acted as an important resistance for a long time. Price has now moved above it.
But I’m not simply thinking:
“Resistance broke → price will go up.”
I’ve been studying NEAR through price action and market structure, and this is what I’m seeing.
NEAR spent a long period below a descending trendline after the major highs of 2024. At the same time, the ~$1 area acted as a major long-term support.
After months of consolidation, price finally broke above the descending trendline and started moving upward.
🔵 The key level: ~$3.50
The $3.50 area had acted as an important resistance for a long time. Price has now moved above it.
But I’m not simply thinking:
“Resistance broke → price will go up.”