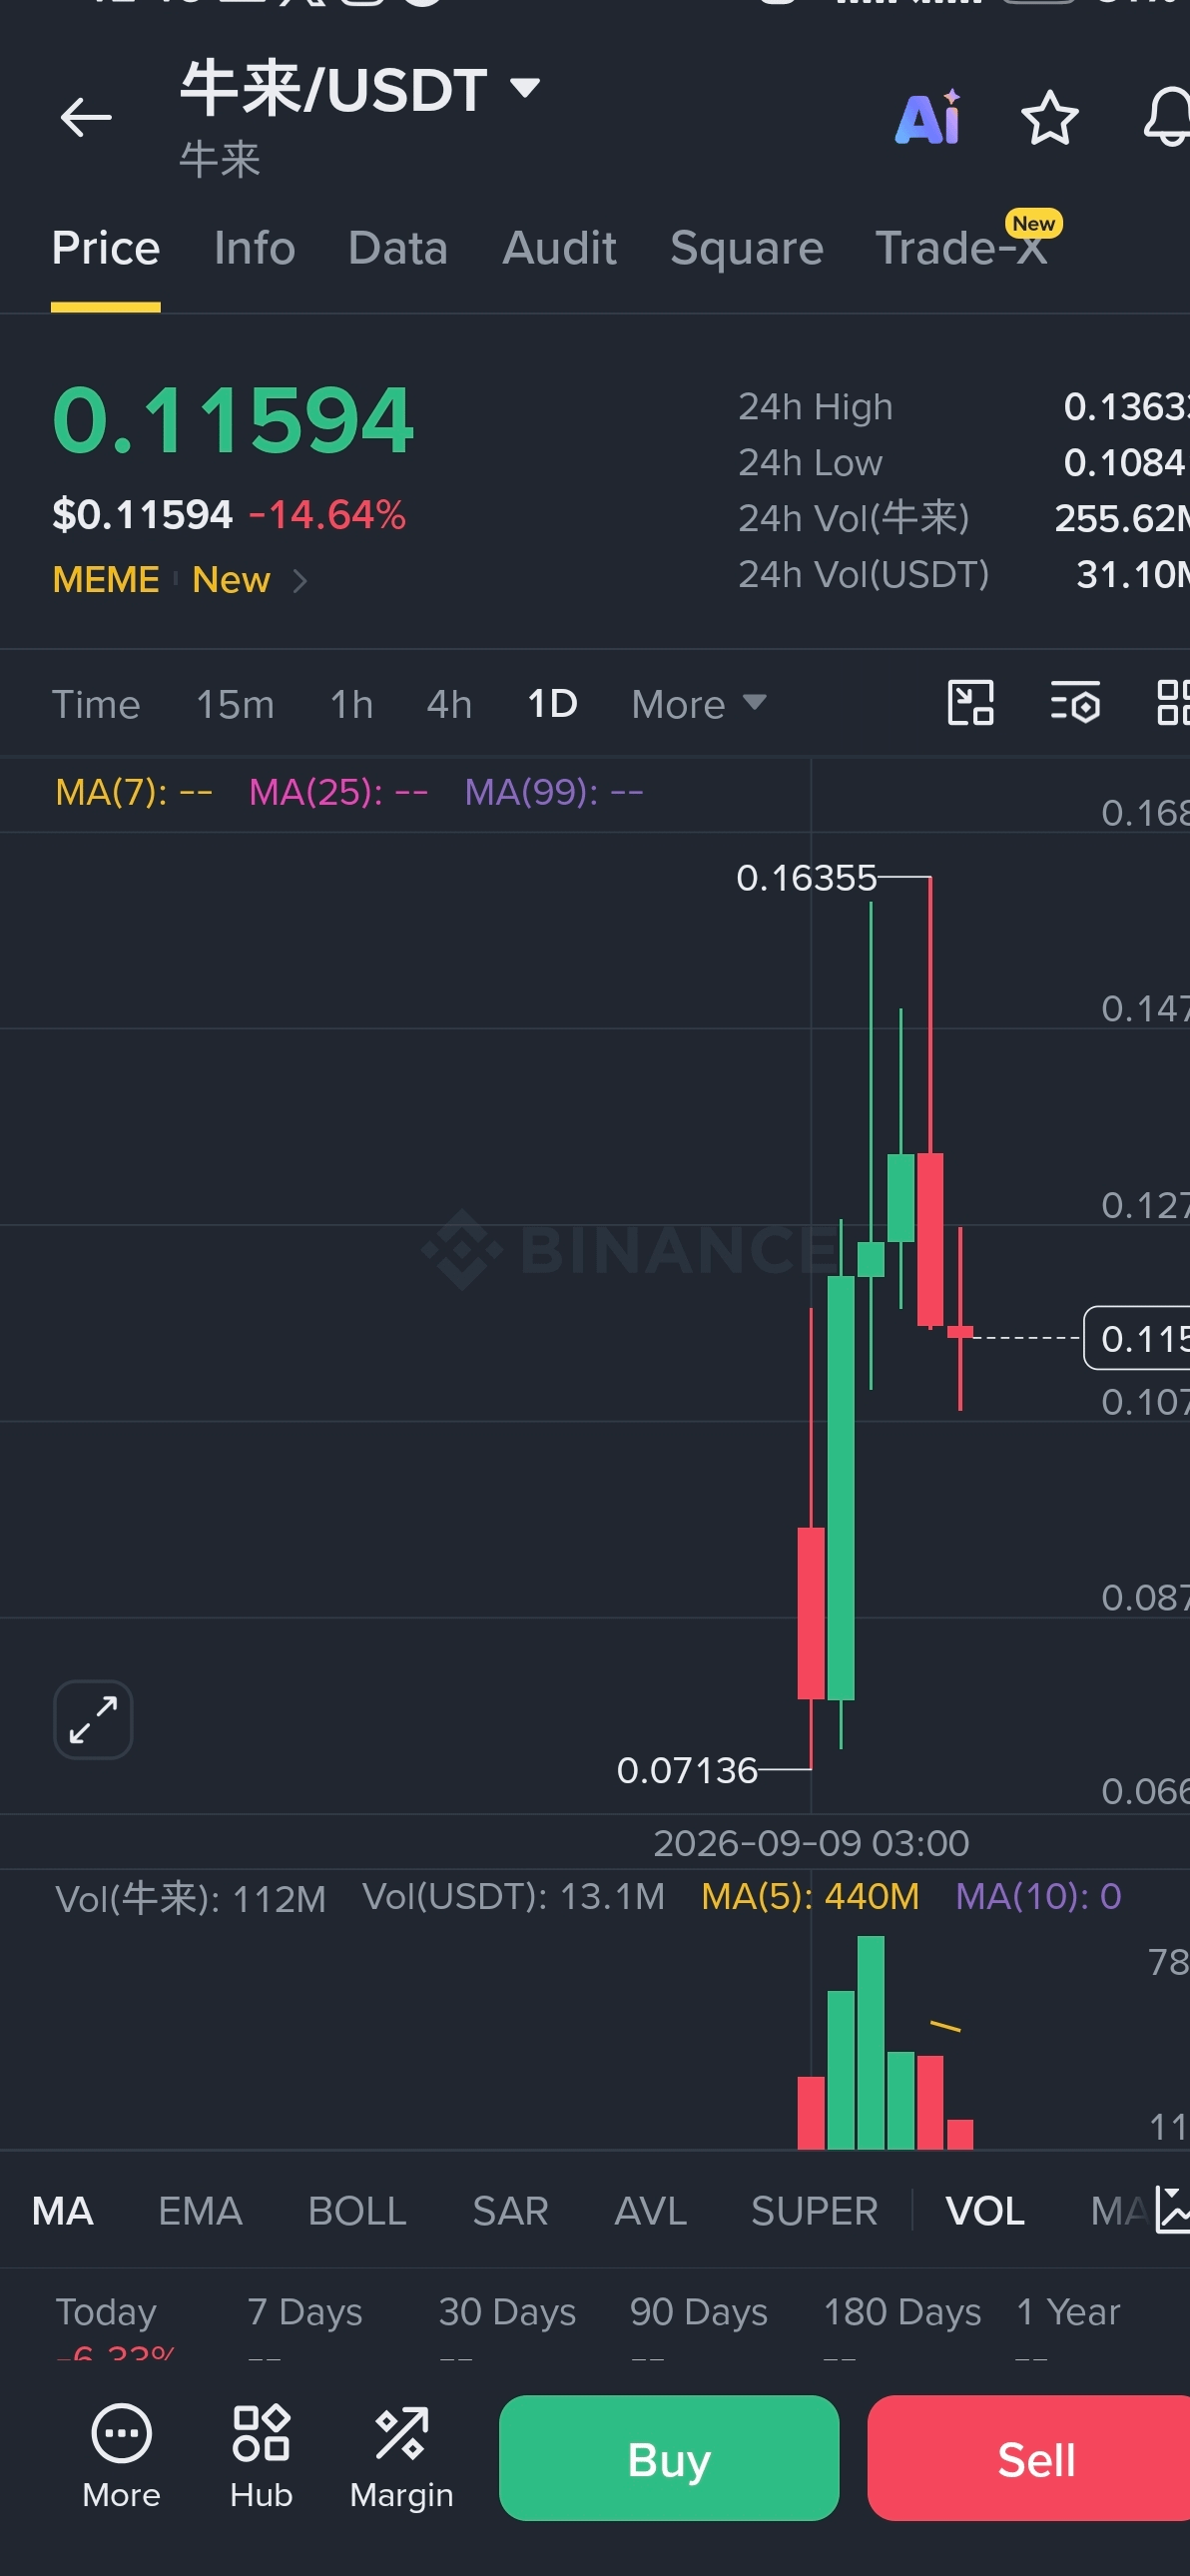
Current Price: 0.11594 USDT
24h Performance: Down 14.64%, trading near the lower end of its daily range.
24h High / Low:
24h High: 0.13633
24h Low: 0.10841
24h Volume: 255.62M 牛来 / 31.10M USDT
Chart Structure & Technical Observations
Recent Volatility: The daily candlestick chart shows a massive impulsive expansion starting around September 9, 2026, spiking to a peak of 0.16355 before experiencing heavy profit-taking and correction.
Current Candle: The active session is showing a red continuation candle pressing down toward support near the 0.10841 low.
Volume Profile: High volume clusters accompanied the initial breakout, but subsequent red volume bars indicate distribution and cooling momentum as short-term traders exit.
Short-Term Outlook (Next 24 Hours)
Support Zone: 0.10840 – 0.11000. Holding this level is critical to prevent a deeper slide toward psychological support zones.
Resistance Zone: 0.12700 – 0.13600. Any relief bounce will face immediate selling pressure around these former support-turned-resistance levels.
Market Bias: Bearish-to-neutral short-term correction following a high-volatility listing pump. Expect choppy consolidation or a retest of the daily low unless buying volume picks up significantly.
24h Performance: Down 14.64%, trading near the lower end of its daily range.
24h High / Low:
24h High: 0.13633
24h Low: 0.10841
24h Volume: 255.62M 牛来 / 31.10M USDT
Chart Structure & Technical Observations
Recent Volatility: The daily candlestick chart shows a massive impulsive expansion starting around September 9, 2026, spiking to a peak of 0.16355 before experiencing heavy profit-taking and correction.
Current Candle: The active session is showing a red continuation candle pressing down toward support near the 0.10841 low.
Volume Profile: High volume clusters accompanied the initial breakout, but subsequent red volume bars indicate distribution and cooling momentum as short-term traders exit.
Short-Term Outlook (Next 24 Hours)
Support Zone: 0.10840 – 0.11000. Holding this level is critical to prevent a deeper slide toward psychological support zones.
Resistance Zone: 0.12700 – 0.13600. Any relief bounce will face immediate selling pressure around these former support-turned-resistance levels.
Market Bias: Bearish-to-neutral short-term correction following a high-volatility listing pump. Expect choppy consolidation or a retest of the daily low unless buying volume picks up significantly.