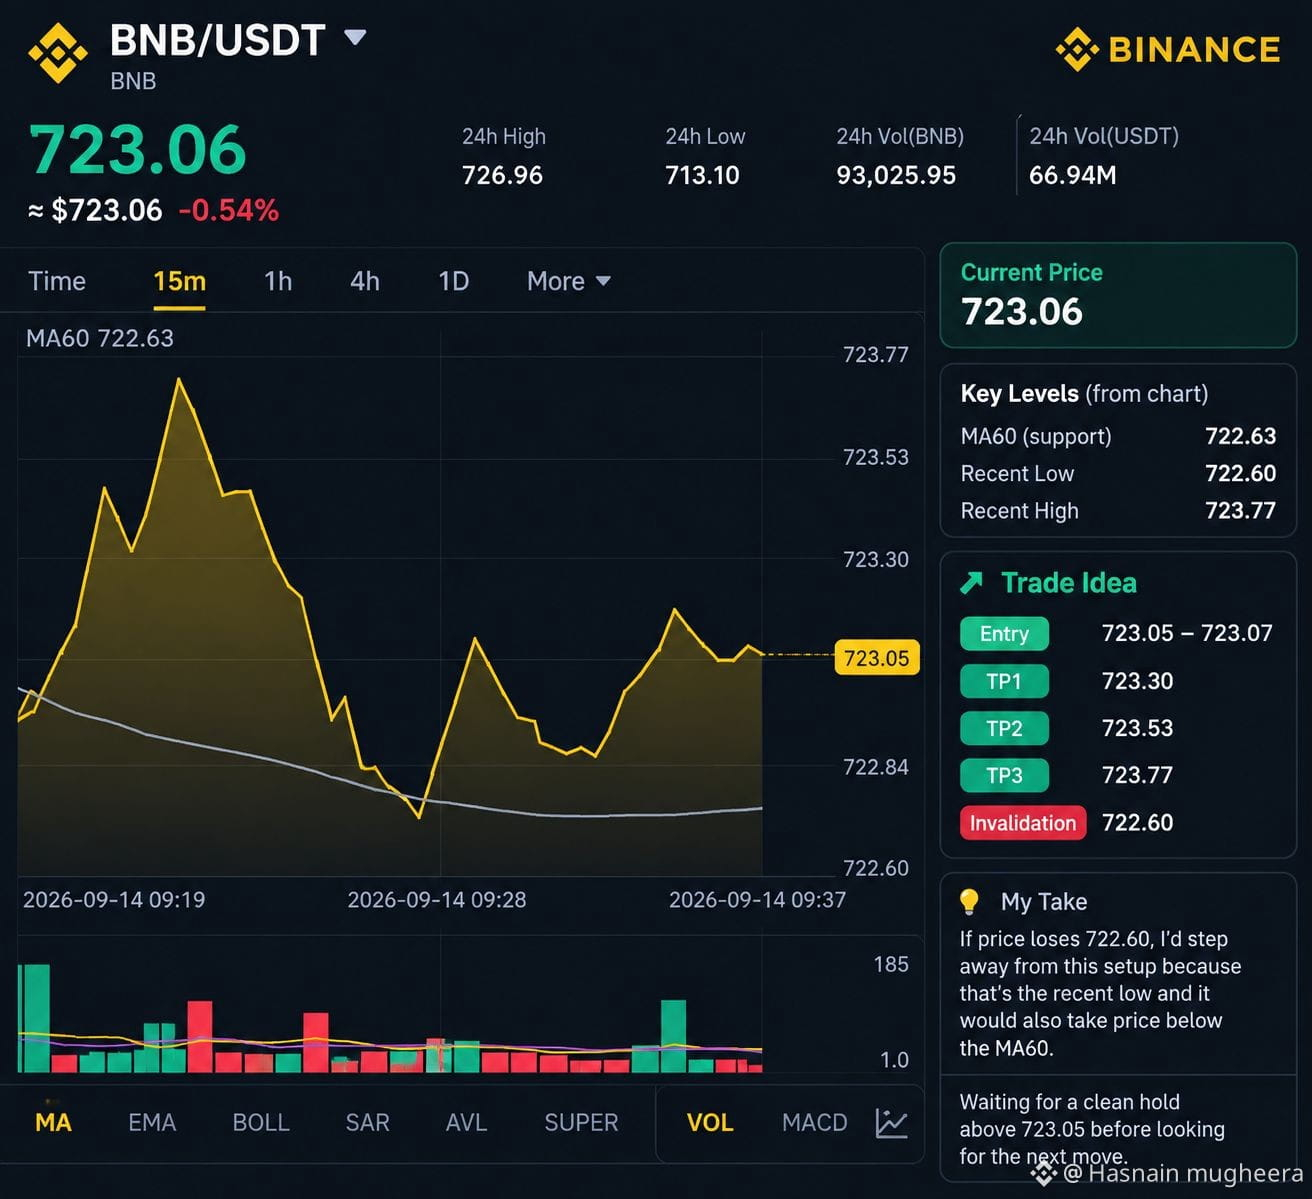
I’m looking at $BNB /USDT around 723.06, and the short-term chart looks choppy but price is still holding just above the visible MA60 at 722.63. For me, that’s the key area deciding whether this small bounce can continue.
Price recently dipped toward 722.60 and recovered, then pushed back above 723.00. I’d like to see price hold above 723.05–723.07 and start reclaiming the nearby chart levels before considering the setup attractive.
📍 Entry: 723.05–723.07
🎯 TP1: 723.30
🎯 TP2: 723.53
🎯 TP3: 723.77
🛑 Invalidation: 722.60
If price loses 722.60, I’d step away from this setup because that is the visible recent low and price would also be moving below the MA60 shown on the chart.
The main issue is momentum: the recent candles are mixed and the move is still relatively tight, so I wouldn’t chase a sudden spike. I’m waiting for a clean hold above 723.05 and then watching how price reacts around 723.30.
For me, this is a cautious short-term setup rather than a high-conviction move.
Price recently dipped toward 722.60 and recovered, then pushed back above 723.00. I’d like to see price hold above 723.05–723.07 and start reclaiming the nearby chart levels before considering the setup attractive.
📍 Entry: 723.05–723.07
🎯 TP1: 723.30
🎯 TP2: 723.53
🎯 TP3: 723.77
🛑 Invalidation: 722.60
If price loses 722.60, I’d step away from this setup because that is the visible recent low and price would also be moving below the MA60 shown on the chart.
The main issue is momentum: the recent candles are mixed and the move is still relatively tight, so I wouldn’t chase a sudden spike. I’m waiting for a clean hold above 723.05 and then watching how price reacts around 723.30.
For me, this is a cautious short-term setup rather than a high-conviction move.