A Moment of Momentum: Reading the USD/INR OTC Chart 📈
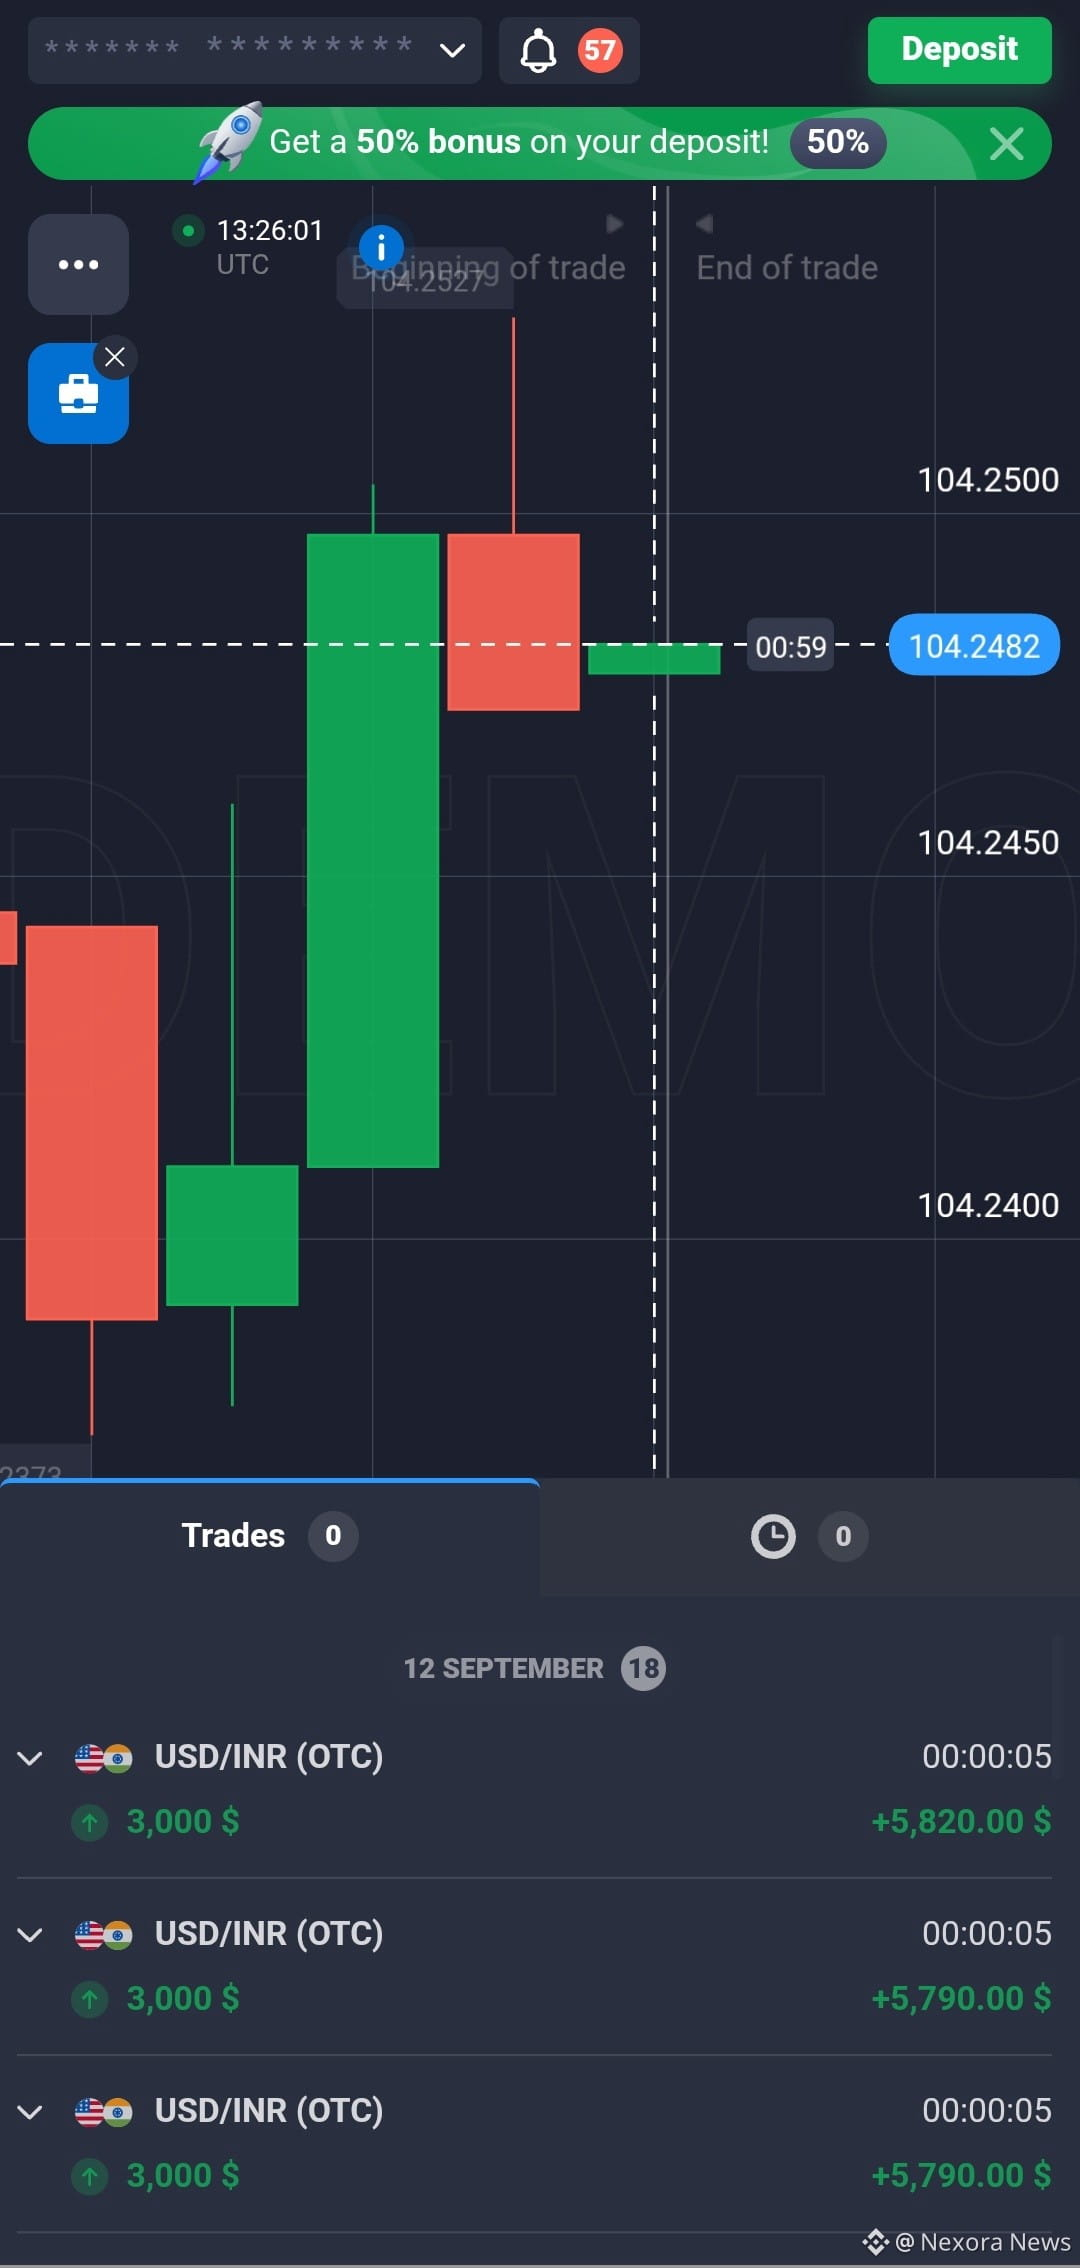
This trading chart captures a short-term moment in the USD/INR (OTC) market, where price action is moving around the 104.2482 level.
The chart shows a strong bullish candle followed by a bearish pullback and then a small green candle. This kind of movement highlights how quickly market sentiment can change in short-term trading.
🔍 Key takeaway:
Price action can provide valuable clues, but a single candle or short-term movement is never a guarantee of what happens next. Smart trading requires patience, proper analysis, and disciplined risk management.
💡 Trade the setup, not the emotion.
Every candle tells part of the story—your job is to understand the bigger picture before making a decision.
This trading chart captures a short-term moment in the USD/INR (OTC) market, where price action is moving around the 104.2482 level.
The chart shows a strong bullish candle followed by a bearish pullback and then a small green candle. This kind of movement highlights how quickly market sentiment can change in short-term trading.
🔍 Key takeaway:
Price action can provide valuable clues, but a single candle or short-term movement is never a guarantee of what happens next. Smart trading requires patience, proper analysis, and disciplined risk management.
💡 Trade the setup, not the emotion.
Every candle tells part of the story—your job is to understand the bigger picture before making a decision.