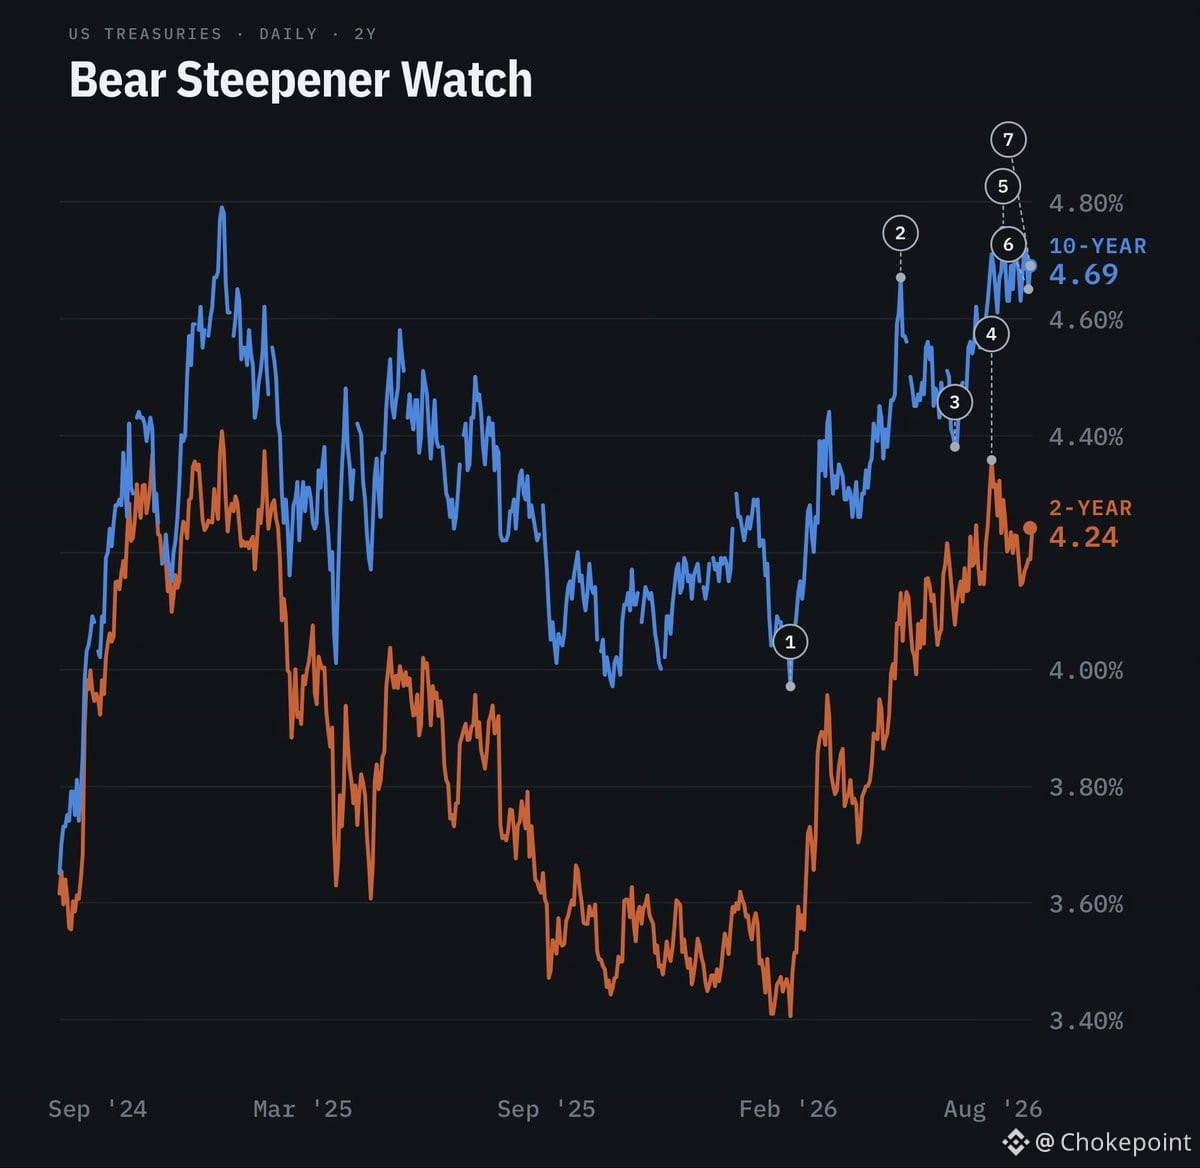
The front end topped a month ago. The long end didn't get the memo.
FEB 27: Cycle low, 3.97%. The floor before a 71bp repricing. Ten-year hasn't traded below 4% since.
MAY 19: Momentum peak at 4.67%, RSI 74.8 — the strongest thrust of the move. Every subsequent high came on weaker momentum.
JUN 26: Sponsorship thins at 4.38%. Buyers in 10s–30s start stepping back, long end begins pulling away from the front.
JUL 23: Front end tops. Two-year peaks at 4.36%. The Fed-driven leg of the selloff ends here.
JUL 31: Twelve-month high, 4.75%. Long end makes its high with the two-year already rolling over. Bear flattener becomes bear steepener.
AUG 19: Treasury doubles buybacks. Bessent lifts liquidity-support operations from $2bn to $4bn. Ten-year rallies 6bp to 4.65%.
AUG 20: Round-tripped in a day. Back to 4.69%. Two-thirds of the rally gone in 24 hours.
Everything that matters happened in those eight days between July 23 and July 31.
The buyback tells you why. Treasury doubled its liquidity support and the market erased two-thirds of it in one session. That's not a positioning problem — it's a demand problem the front end doesn't have.
So what do you do from here.
Not short the ten-year. Before July, it closed above 4.69 on exactly three days in two years — all in one week in January 2025. It's done it seven times in the last month. That's a two-year ceiling that just broke, with Treasury actively leaning against the level. Bad entry, policy bid underneath.
The trade is the curve, not the level.
2s10s works if the two-year keeps falling or the ten-year breaks. You don't have to be right about which one.
Kill it if the front end turns back up. The two-year printed +5bp Friday.
$SPY $QQQ
FEB 27: Cycle low, 3.97%. The floor before a 71bp repricing. Ten-year hasn't traded below 4% since.
MAY 19: Momentum peak at 4.67%, RSI 74.8 — the strongest thrust of the move. Every subsequent high came on weaker momentum.
JUN 26: Sponsorship thins at 4.38%. Buyers in 10s–30s start stepping back, long end begins pulling away from the front.
JUL 23: Front end tops. Two-year peaks at 4.36%. The Fed-driven leg of the selloff ends here.
JUL 31: Twelve-month high, 4.75%. Long end makes its high with the two-year already rolling over. Bear flattener becomes bear steepener.
AUG 19: Treasury doubles buybacks. Bessent lifts liquidity-support operations from $2bn to $4bn. Ten-year rallies 6bp to 4.65%.
AUG 20: Round-tripped in a day. Back to 4.69%. Two-thirds of the rally gone in 24 hours.
Everything that matters happened in those eight days between July 23 and July 31.
The buyback tells you why. Treasury doubled its liquidity support and the market erased two-thirds of it in one session. That's not a positioning problem — it's a demand problem the front end doesn't have.
So what do you do from here.
Not short the ten-year. Before July, it closed above 4.69 on exactly three days in two years — all in one week in January 2025. It's done it seven times in the last month. That's a two-year ceiling that just broke, with Treasury actively leaning against the level. Bad entry, policy bid underneath.
The trade is the curve, not the level.
2s10s works if the two-year keeps falling or the ten-year breaks. You don't have to be right about which one.
Kill it if the front end turns back up. The two-year printed +5bp Friday.
$SPY $QQQ