

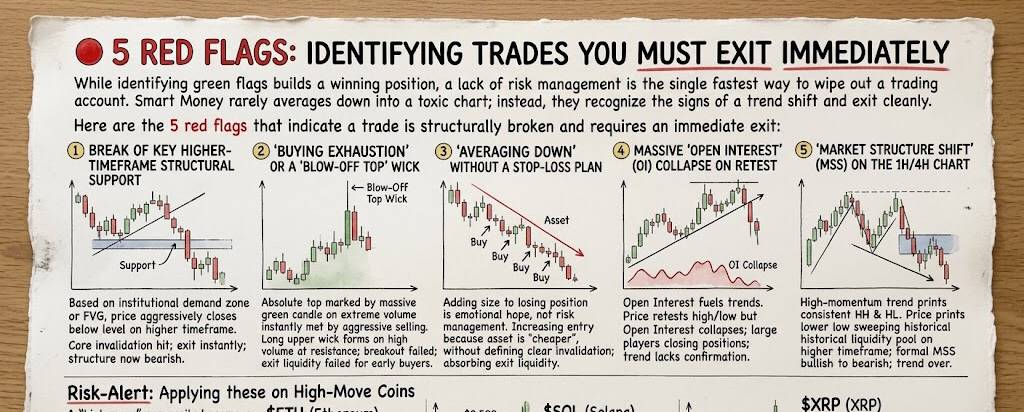

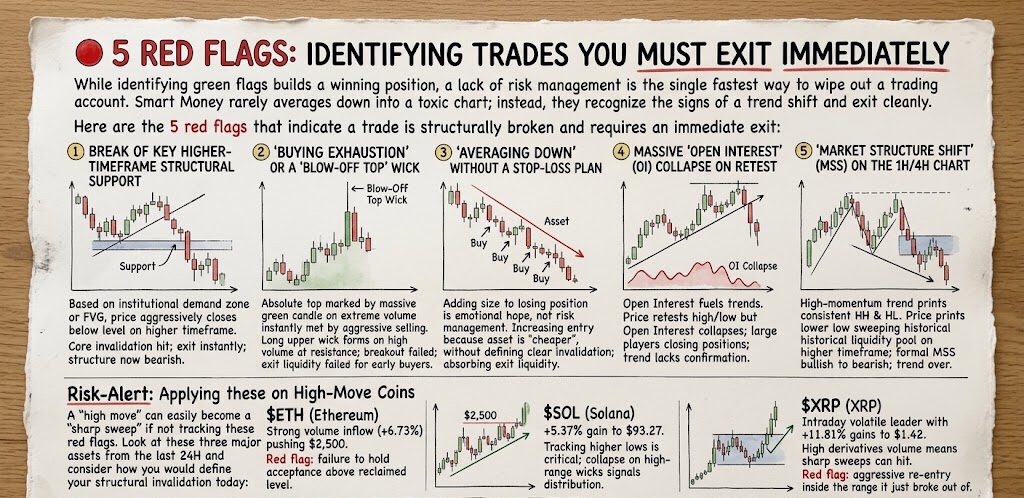
Embora identificar sinais verdes ajude você a construir uma posição vencedora, a falta de gestão de risco é a forma mais rápida de apagar uma conta de trading. O Smart Money raramente faz médias para baixo em um gráfico tóxico; em vez disso, eles reconhecem os sinais de uma mudança de tendência e saem de forma limpa.
Aqui estão os 5 sinais vermelhos que indicam que uma operação está estruturalmente quebrada e exige uma saída imediata:
1. Ruptura da Estrutura de Suporte Estrutural em Timeframe Maior
Quando uma operação é baseada em uma zona de demanda institucional ou em um Fair Value Gap (FVG) e o preço fecha agressivamente abaixo desse nível em um timeframe maior, a invalidação central da operação foi atingida. Saia instantaneamente; a estrutura agora é de baixa.
2. Um pavimento de 'Exaustão de Compras' ou um pavimento de 'Topo em Blow-Off'
O topo absoluto muitas vezes é marcado por uma vela final massiva de impulso verde, com volume extremo, que é imediatamente atingida por uma venda agressiva. Se você vir um pavimento superior longo (2x a 3x o corpo) se formando com alto volume em um nível de resistência, o rompimento falhou, e isso é liquidez de saída para compradores iniciais.
3. 'Média para Baixo' Sem um Plano de Stop-Loss
Adicionar mais tamanho a uma posição perdedora não é gestão de risco; é esperança emocional. Se você se vê aumentando o tamanho da entrada estritamente porque o ativo está 'mais barato' do que antes, sem definir uma invalidação clara, você está absorvendo a liquidez de saída de outra pessoa.
4. Colapso Massivo de 'Open Interest' (OI) no Reteste
O Open Interest te diz se um capital fresco está alimentando uma tendência. Se o preço está fazendo um reteste de uma máxima/mínima importante, mas o Open Interest está desabando ativamente, isso sinaliza que grandes players estão fechando posições em vez de abrir novas. A tendência não tem confirmação.
5. 'Mudança de Estrutura de Mercado' (MSS) no gráfico de 1H/4H
Uma tendência de alta-momentum deve imprimir máximas mais altas e mínimas mais altas consistentes. Quando o preço imprime uma mínima mais baixa que varre uma importante reserva de liquidez histórica no timeframe maior, isso marca uma Mudança Formal de Estrutura de Mercado de bullish para bearish. A tendência acabou.
Alerta de Risco: Aplicar isso em Coins de Alto Movimento
Um "alto movimento" pode facilmente virar um "sweep brusco" se você não estiver acompanhando esses sinais de alerta. Veja esses três principais ativos das últimas 24H e considere como você definiria sua invalidação estrutural hoje:
$ONT (Ethereum): Forte entrada de volume (+6,73%) impulsionando US$ 2.500. Um sinal de alerta seria falhar em manter aceitação acima desse nível recém-recuperado.
$SOL (Solana): Ganho de +5,37% para US$ 93,27. Acompanhar mínimas mais altas é crucial aqui, pois um colapso em pavimentos de alta amplitude sinalizaria distribuição.
$XRP (XRP): Líder volátil no intraday com +11,81% de ganhos para US$ 1,42. Alto volume de derivativos significa que sweeps bruscos podem acontecer. Um sinal de alerta seria uma reentrada agressiva dentro da faixa da qual ele acabou de romper.
🔔 Siga para o próximo post: Dominando a Estratégia de Execução do Caçador de Entrada!
#writetoearn #cryptotrading #priceaction #TradingSetups #TechnicalAnalysis #BinanceSquare