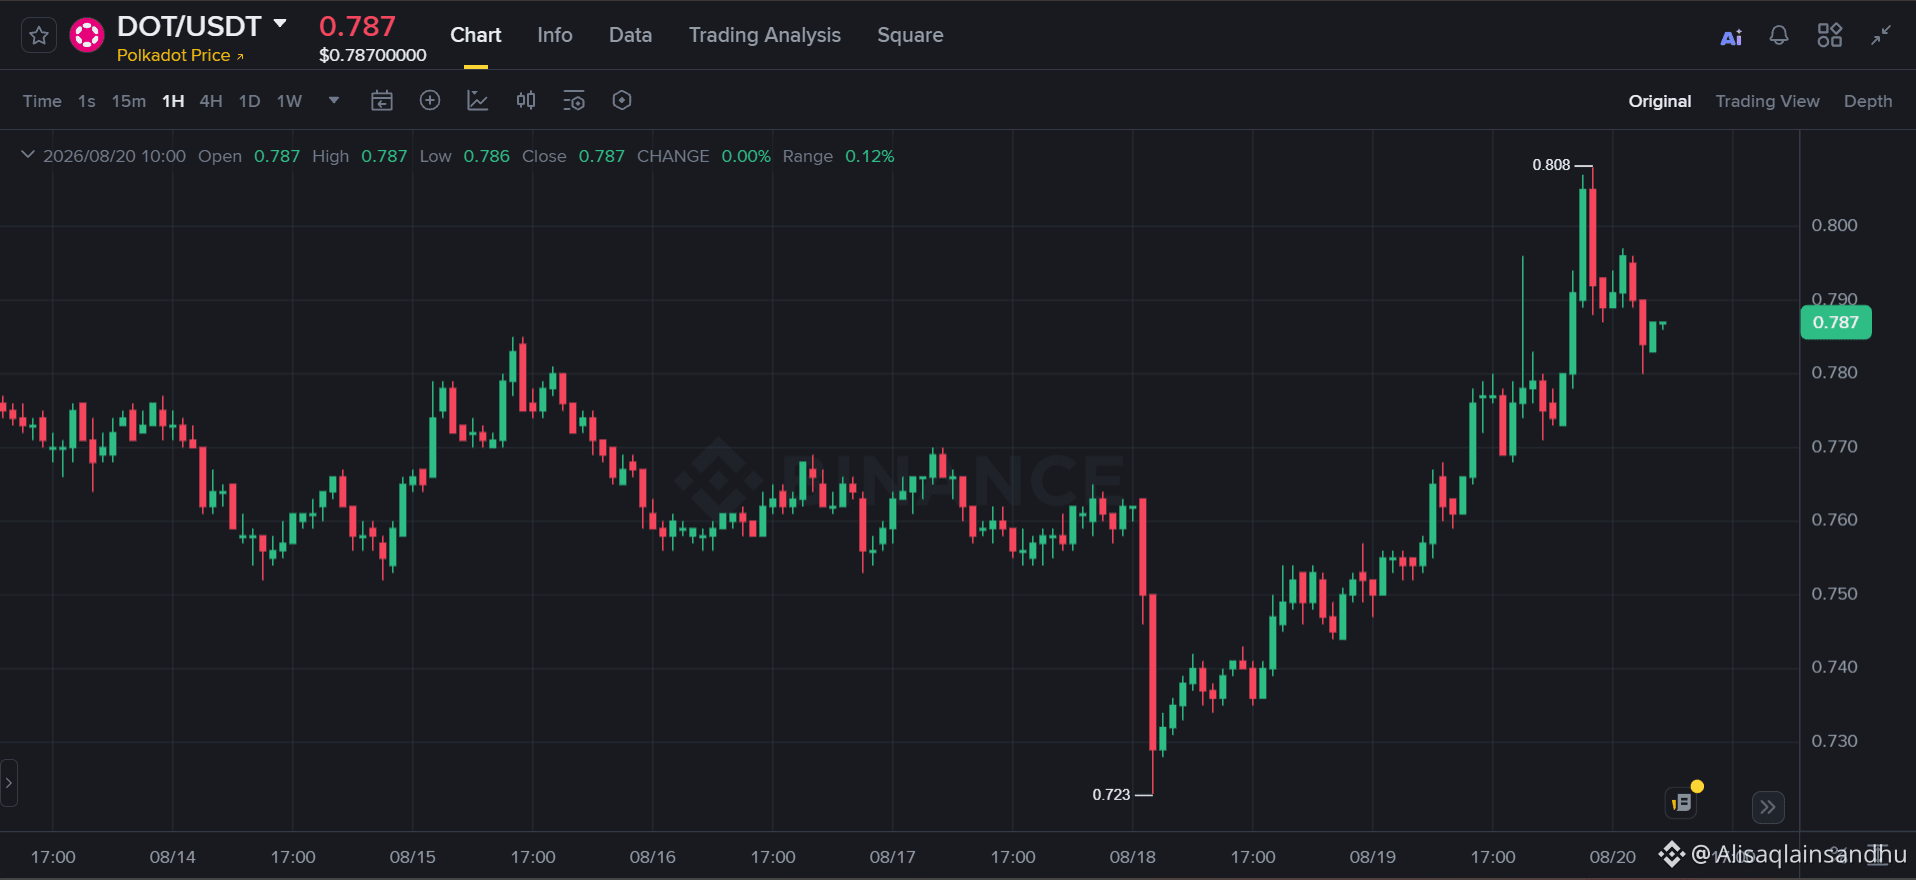
Vamos detalhar esta configuração da Polkadot para um short de alta probabilidade.
Título: A Polkadot imprime a armadilha! 🚨 A rejeição do DOT abre as comportas 📉
A Configuração (SHORT $DOT ):
• Zona de Entrada: US$ 0,787 – US$ 0,795
• Invalidação / Stop Loss: US$ 0,812 (fechamento limpo de 1H acima da varredura de liquidez em US$ 0,808)
• Alvo 🎯 1: US$ 0,760
• Alvo 🎯 2: US$ 0,740
• Alvo 🎯 3: US$ 0,725
A Narrativa do Mercado:
A Polkadot disparou forte para atingir os stops psicológicos de US$ 0,800, mas vendedores com grande presença no topo absorveram imediatamente a pressão de compra, forçando os longs atrasados para fora da posição.
A Análise Técnica:
No gráfico de 1 hora, $DOT registrou um enorme “liquidity grab” (captura de liquidez), subindo até US$ 0,808 antes de rejeitar violentamente e fechar de volta abaixo da resistência estrutural. Isso formou uma vela pesada de pavio longo (shooting star) / rejeição, imediatamente seguida por uma quebra impulsiva da estrutura baixista do canal local. Observe a distribuição acontecendo: máximas mais baixas se formam em torno de US$ 0,795, e o momentum voltou com firmeza para as mãos dos ursos.
O movimento vertical do preço a partir da mínima em US$ 0,723 deixou vários bolsões de liquidez não tocados (Fair Value Gaps) no caminho de alta. Como os compradores não conseguiram manter aceitação acima de US$ 0,800, o caminho de menor resistência é um movimento de reversão à média para preencher esses desequilíbrios. Assim que o suporte local em US$ 0,780 romper, espere uma aceleração para baixo em direção à faixa anterior de acumulação perto de US$ 0,760, com potencial para retestar o patamar estrutural em US$ 0,723.
Você acha que o DOT segura a linha aqui, ou vamos voltar a despejar para US$ 0,720? Deixe seus alvos abaixo! 👇
#Polkadot $DOT #cryptotrading #TechnicalAnalysis
Aviso: Isto é apenas para fins educacionais e não é aconselhamento de investimento. Sempre faça sua própria pesquisa e gerencie seu risco.
Título: A Polkadot imprime a armadilha! 🚨 A rejeição do DOT abre as comportas 📉
A Configuração (SHORT $DOT ):
• Zona de Entrada: US$ 0,787 – US$ 0,795
• Invalidação / Stop Loss: US$ 0,812 (fechamento limpo de 1H acima da varredura de liquidez em US$ 0,808)
• Alvo 🎯 1: US$ 0,760
• Alvo 🎯 2: US$ 0,740
• Alvo 🎯 3: US$ 0,725
A Narrativa do Mercado:
A Polkadot disparou forte para atingir os stops psicológicos de US$ 0,800, mas vendedores com grande presença no topo absorveram imediatamente a pressão de compra, forçando os longs atrasados para fora da posição.
A Análise Técnica:
No gráfico de 1 hora, $DOT registrou um enorme “liquidity grab” (captura de liquidez), subindo até US$ 0,808 antes de rejeitar violentamente e fechar de volta abaixo da resistência estrutural. Isso formou uma vela pesada de pavio longo (shooting star) / rejeição, imediatamente seguida por uma quebra impulsiva da estrutura baixista do canal local. Observe a distribuição acontecendo: máximas mais baixas se formam em torno de US$ 0,795, e o momentum voltou com firmeza para as mãos dos ursos.
O movimento vertical do preço a partir da mínima em US$ 0,723 deixou vários bolsões de liquidez não tocados (Fair Value Gaps) no caminho de alta. Como os compradores não conseguiram manter aceitação acima de US$ 0,800, o caminho de menor resistência é um movimento de reversão à média para preencher esses desequilíbrios. Assim que o suporte local em US$ 0,780 romper, espere uma aceleração para baixo em direção à faixa anterior de acumulação perto de US$ 0,760, com potencial para retestar o patamar estrutural em US$ 0,723.
Você acha que o DOT segura a linha aqui, ou vamos voltar a despejar para US$ 0,720? Deixe seus alvos abaixo! 👇
#Polkadot $DOT #cryptotrading #TechnicalAnalysis
Aviso: Isto é apenas para fins educacionais e não é aconselhamento de investimento. Sempre faça sua própria pesquisa e gerencie seu risco.