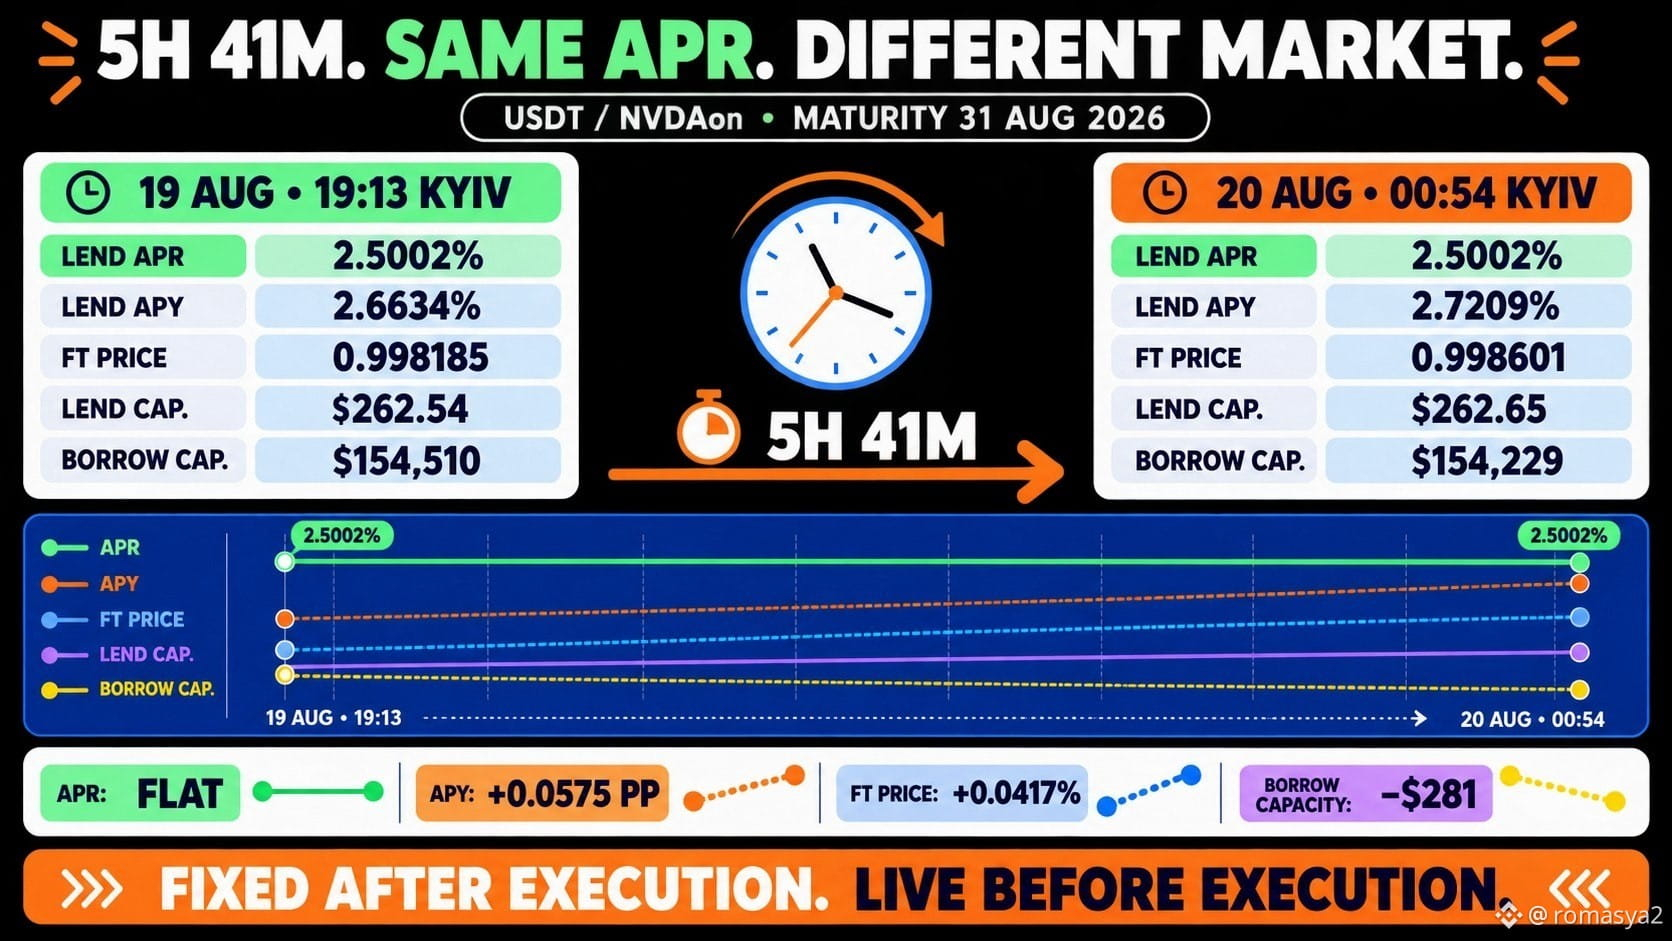
I watched the same TermMax market for 5 hours and 41 minutes.
The lend APR did not move. Almost everything around it did.
Market: USDT/NVDAon@31AUG2026
Period: 19 Aug, 19:13 → 20 Aug, 00:54 Kyiv
Here is what changed:
Lend APR: 2.5002% → 2.5002%
Lend APY: 2.6634% → 2.7209%
FT price: 0.998185 → 0.998601
Visible lend capacity: $262.54 → $262.65
Visible borrow capacity: $154,510 → $154,229
Reported rolling 24h volume: $2.00 → $4.00
The headline APR looked frozen, but FT price, capacity and recent market activity were not.
Why does this matter?
TermMax describes FT as a zero-coupon-style token purchased below its maturity value. Range orders provide pricing curves, meaning available rates and liquidity depend on where an order is matched along that curve.
The fixed part begins after execution. Before execution, the user is still looking at a live market snapshot.
So a displayed APR should not be evaluated alone. Before entering, I would check:
1. The rate for my exact position size.
2. Available capacity at that rate.
3. FT price and remaining time.
4. Gas and the complete exit path.
My conclusion: a stable APR does not necessarily mean a static market.
No transaction was executed for this test. The figures come from two public-data snapshots.
@TermMax #TermMax
The lend APR did not move. Almost everything around it did.
Market: USDT/NVDAon@31AUG2026
Period: 19 Aug, 19:13 → 20 Aug, 00:54 Kyiv
Here is what changed:
Lend APR: 2.5002% → 2.5002%
Lend APY: 2.6634% → 2.7209%
FT price: 0.998185 → 0.998601
Visible lend capacity: $262.54 → $262.65
Visible borrow capacity: $154,510 → $154,229
Reported rolling 24h volume: $2.00 → $4.00
The headline APR looked frozen, but FT price, capacity and recent market activity were not.
Why does this matter?
TermMax describes FT as a zero-coupon-style token purchased below its maturity value. Range orders provide pricing curves, meaning available rates and liquidity depend on where an order is matched along that curve.
The fixed part begins after execution. Before execution, the user is still looking at a live market snapshot.
So a displayed APR should not be evaluated alone. Before entering, I would check:
1. The rate for my exact position size.
2. Available capacity at that rate.
3. FT price and remaining time.
4. Gas and the complete exit path.
My conclusion: a stable APR does not necessarily mean a static market.
No transaction was executed for this test. The figures come from two public-data snapshots.
@TermMax #TermMax