

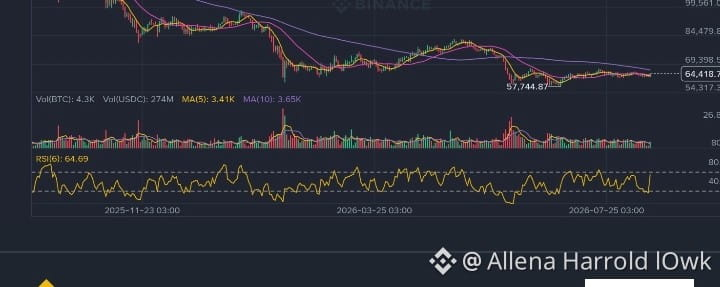

Bitcoin (BTC/USDC) está sendo negociado a US$ 64.418,77 (+2,07% no dia), demonstrando uma recuperação bullish de curto prazo após estabelecer uma mínima local perto de US$ 57.744,87.
Métricas Técnicas e Indicadores
* Ação de Preço e Tendência: O ativo está emergindo de uma prolongada tendência de baixa após seu pico em US$ 126.296,00. O candle diário atual mostra consolidação com viés de alta próximo ao topo da sua faixa recente.
* Médias Móveis (MM):
* Médias Móveis (MM) (7) [US$ 63.382,40] e MM(25) [US$ 63.912,06]: O preço recuperou ambas as médias móveis de curto prazo, sinalizando que o momento favorece os compradores no curto prazo.
* MA(99) [$66,392.09]: Serve como a principal linha de resistência da tendência por trás das despesas. Recuperar esse nível é crucial para a reversão da tendência no médio prazo.
* RSI (6): Situado em 64,69, indicando fortalecimento do impulso comprador, ainda abaixo do limite de sobrecompra (>70).
* Volume: O volume está relativamente contido em comparação com os grandes picos de venda próximos da mínima de US$ 57.744, sugerindo compras controladas em vez de volatilidade movida por pânico.
Principais Níveis de Preço
* Resistência Imediata: US$ 66.392 (MA 99) \rightarrow US$ 69.398 (nível-chave de pivô estrutural).
* Suporte Imediato: US$ 63.912 (MA 25) \rightarrow US$ 63.382 (MA 7) \rightarrow US$ 57.744 (suporte importante na mínima de oscilação).
Perspectiva de Negociação
* Cenário Otimista: Um fechamento de candle diário acima de US$ 66.400 confirma uma ruptura acima da MA(99), abrindo a zona-alvo na direção de US$ 69.400–US$ 70.000.
* Cenário de baixa: A falha em romper a MA(99), seguida por uma queda abaixo da zona de suporte de US$ 63.380, coloca em risco um reteste do limite inferior de suporte por volta de US$ 57.744.
Estou planejando entrar em uma compra a al $BTC

O que você está olhando e onde estão seus níveis-chave