


JASMY holds support inside a major falling wedge pattern.
Analyst Javon Marks targets a potential move toward $0.2785.
Technical indicators show weak momentum near current levels.
Jasmy (JASMY) is gaining attention after analyst Javon Marks identified a possible breakout structure forming on the chart. The JASMY Price Analysis shows the token holding support inside a major falling wedge pattern. Marks suggested that a confirmed breakout could move the asset toward a $0.2785 target.
The analyst noted that JASMY continues to defend important support levels within the formation. His chart analysis places focus on a possible continuation move if buyers regain control and push price above key resistance areas.
JASMY Price Analysis Highlights Analyst Breakout Target
Javon Marks stated that JASMY remains positioned within a falling wedge pattern that could lead to a larger price movement. The analyst previously highlighted that the token was maintaining support while approaching the upper boundary of the structure.
$JASMY's breakout looks imminent!
This next wave can send it towards the target at $0.2785 which is a whopping 5,770% away!
That is a near 60X and prices look right on brink of a breakout & run that could spark a significantly bullish process towards…
(JasmyCoin) https://t.co/ybsLfIZwzc pic.twitter.com/eYHHDRdtRn
— JAVONMARKS (@JavonTM1) July 29, 2026
The projected $0.2785 target represents a long-term level from Marks’ technical setup. However, the move depends on breakout confirmation and stronger buying activity across the market.
JASMY has traded under pressure for several months after declining from earlier highs in 2026. The current pattern shows price compression, with traders monitoring whether the wedge formation can produce a trend reversal.
JASMY Price Analysis Tracks Falling Wedge Formation
The current JASMY price stands near $0.00427 on the daily chart. The token trades below the Bollinger Band middle line at $0.00447, while resistance remains near the upper band at $0.00477.
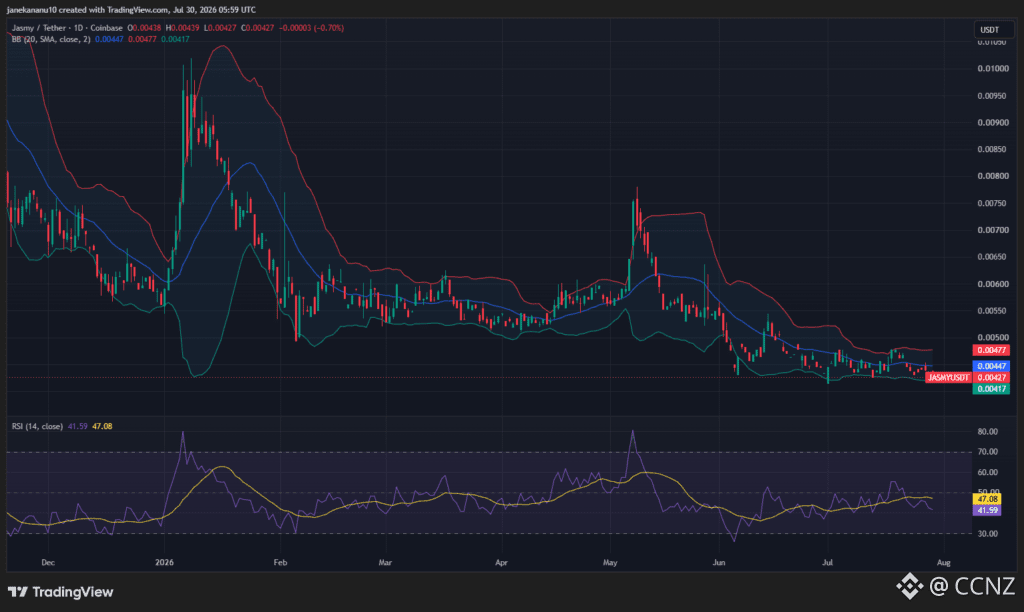 JASMY/USDT 1D Price Chart | Source: TradingView
The lower Bollinger Band sits around $0.00417, creating a key support zone. The Relative Strength Index (RSI) reads 41.59, showing weak momentum without reaching oversold territory.
A move above $0.00447 could improve short-term conditions, while losing support near $0.00417 may increase selling pressure.
Disclaimer: This article is for informational purposes only and does not constitute financial advice. CoinCryptoNewz is not responsible for any losses incurred. Readers should do their own research before making financial decisions.
<p>The post JASMY Breakout Setup Eyes 5,770% Move as Analyst Targets $0.2785 first appeared on Coin Crypto Newz.</p>