
Análise do Mapa de Calor de Liquidações da ETH – Onde o Dinheiro Inteligente Está Olhando?
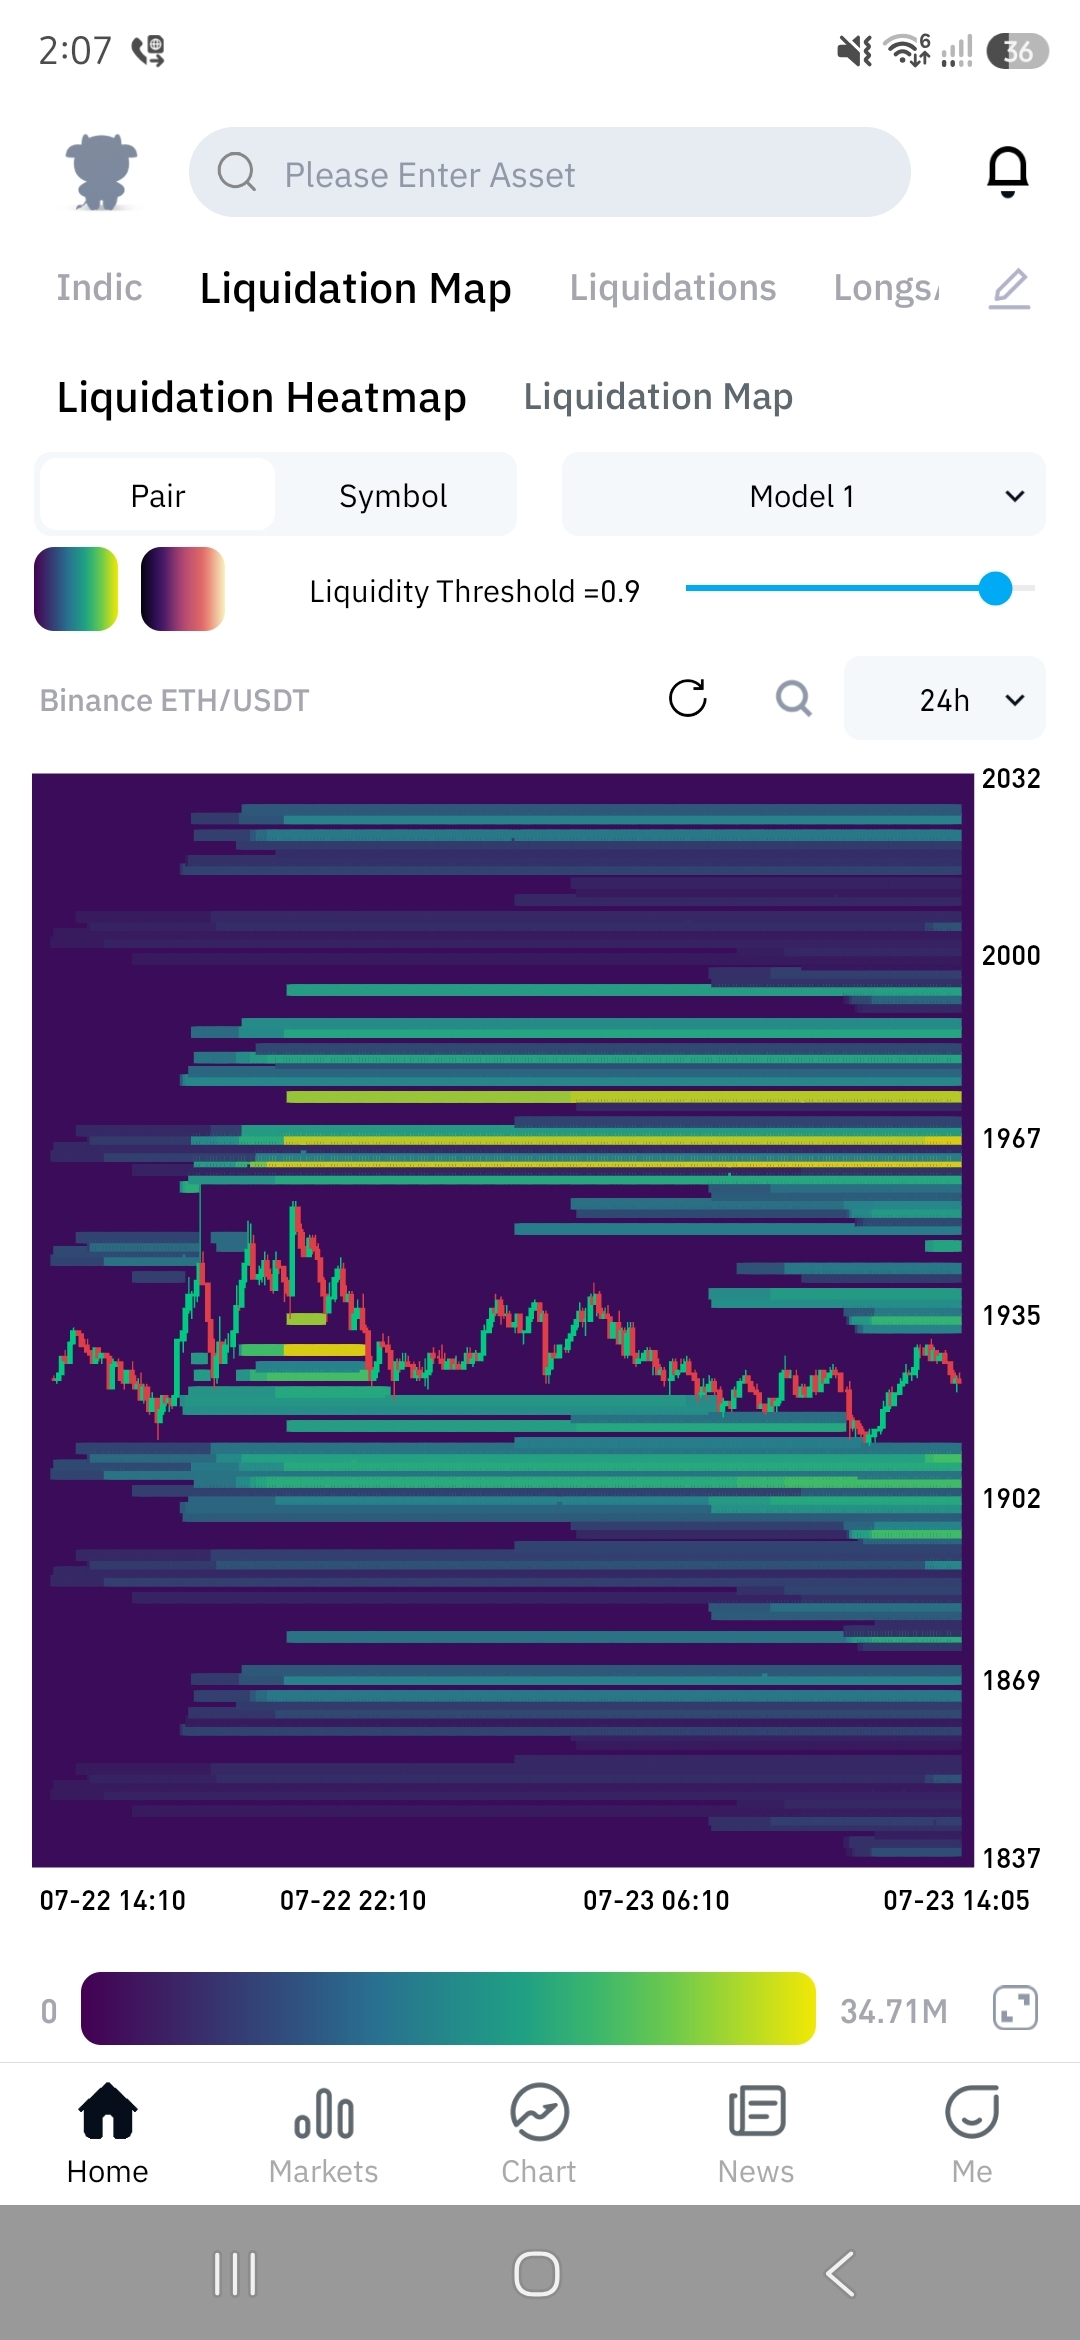
O mapa de calor de liquidações da ETH conta uma história interessante. Em vez de focar apenas em velas e indicadores, ele revela onde estão os maiores agrupamentos de posições alavancadas. Essas zonas de liquidez frequentemente atuam como ímãs para o preço, porque é ali que os market makers podem disparar liquidações e gerar volatilidade.
Principais observações:
1. Liquidez majoritária acima do preço atual
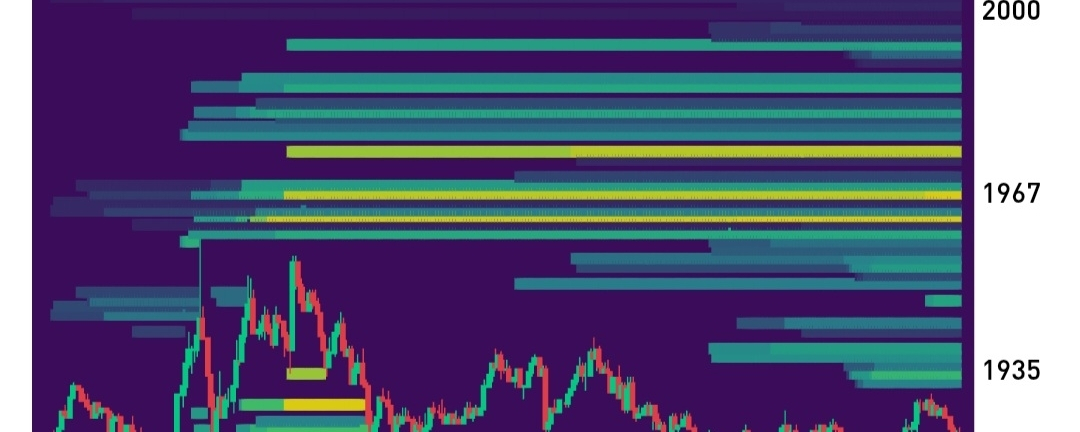
O cluster de liquidez mais forte está concentrado na faixa de 1965–1970. Atualmente, esta é a área mais brilhante no mapa de calor, indicando uma quantidade significativa de liquidez em repouso.
Se o ETH ganhar impulso, esta área se torna um alvo de alta probabilidade antes de qualquer grande rejeição ocorrer.
2. Resistência imediata
Existem várias faixas de liquidez entre 1935 e 1965. Esses níveis talvez não impeçam o preço permanentemente, mas podem desacelerar o movimento antes que o mercado tente pegar o maior pool de liquidez perto de 1967.
3. Forte suporte abaixo
A área de 1900–1905 também contém um cluster de liquidez perceptível. Se o ETH sofrer uma queda, esta zona pode atrair o preço antes que os compradores tentem outra recuperação.
Se 1900 falhar, a próxima liquidez significativa aparece bem mais abaixo, por volta de 1870, o que poderia virar o próximo ímã de queda.
O que isso significa?
Os mercados geralmente não andam em linha reta. Eles tendem a caçar liquidez primeiro.
No momento:
A maior liquidez visível ainda está acima do preço atual.
Os ursos podem tentar rejeitar o mercado antes de 1965.
Os touros precisam recuperar a região de 1935–1940 e continuar pressionando em direção ao grande cluster de liquidez.
Plano de trade
Cenário de alta
Mantenha acima de 1900.
Rompa 1935 de forma convincente.
Liquidez-alvo em torno de 1965–1970.
Se aquela liquidez for absorvida em vez de rejeitada, o ETH pode continuar ainda mais alto.
Cenário de baixa
Perder 1900.
Varredura de liquidez abaixo do suporte.
O próximo alvo principal vira a região de 1870.
Gestão de risco
Um heatmap de liquidações nunca deve ser usado sozinho. Ele funciona melhor quando combinado com:
Estrutura de mercado
Volume
Open Interest (OI)
Taxa de Funding
Correlação com BTC
Suporte e resistência em time frame maior
A liquidez mostra para onde o preço pode ser atraído, não para onde o preço precisa ir.
Considerações Finais
Agora, o ETH parece estar sendo negociado entre dois pools importantes de liquidez. O cluster maior e mais brilhante continua acima, perto de 1965–1970, tornando esta uma área importante para observar. Porém, se os compradores não conseguirem defender 1900, o mercado pode primeiro varrer a liquidez mais baixa antes de tentar qualquer recuperação sustentada.
Lembre-se: o Preço segue a liquidez com mais frequência do que as emoções. Paciência é a chave—deixe o mercado chegar à liquidez, em vez de perseguir cada movimento.
Esta é minha análise pessoal do mercado, não é aconselhamento financeiro. Sempre gerencie seu