


Here is the natural, fluent English translation of your analysis. I've kept the technical terms accurate but made the language sound like a professional crypto analyst sharing insights on a forum or social media.
---
📌 General Outlook
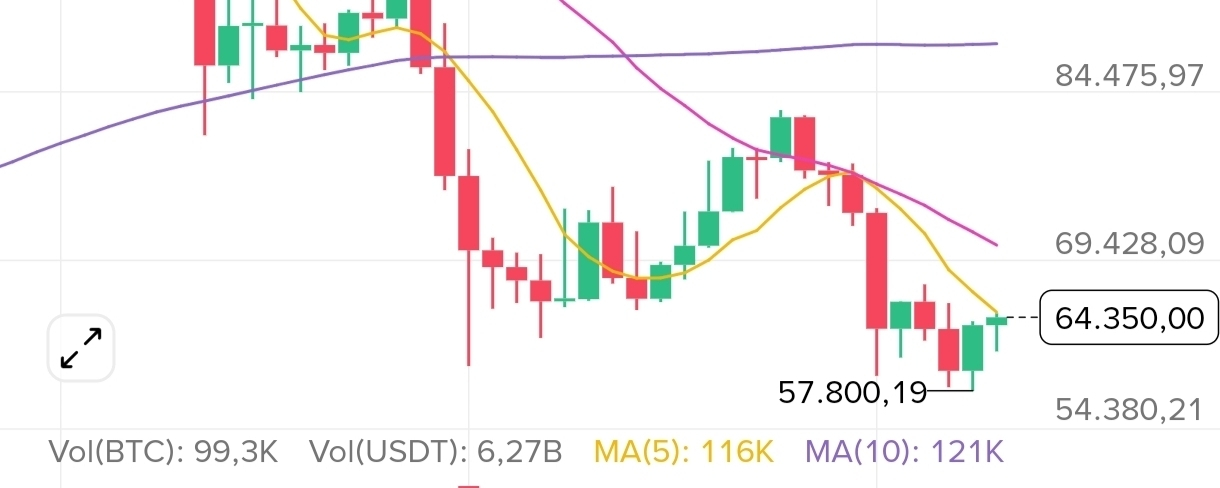
Current price: $64,350**. The chart indicates that Bitcoin has found strong support around **$57,800 (the bottom of the last green weekly candle) following a broad downtrend. However, the recovery is still weak, and the asset is facing significant resistance overhead.
---
📅 Weekly Analysis (Short-Term - 1W Chart)
· Current Status: We saw a minor recovery of +0.46% over the past week. The price is currently hovering near the upward-sloping 7-day Moving Average (MA7: $64,805**). Sitting just below this level makes **$64,350 a critical pivot point right now.
· Resistance Levels:
· The first major resistance is the MA7 around ~$64,800. For any sustainable upside, we need to see a confirmed close above this level.
· The next key target is the 25-day MA (MA25: ~$70,802). Breaking above this would be the first real confirmation that the short-term trend is turning bullish.
· Support Levels: The strongest support below the weekly close remains the recent low of $57,800. If this level gets breached, the bearish momentum will likely accelerate significantly.
· Weekly Takeaway: If the weekly candle closes firmly above the $64,800 - $65,000 zone, we could see a faster rally. As long as we stay below this range, we are at high risk of a classic "dead cat bounce" (a rally that quickly reverses into selling pressure).
---
📅 Monthly Analysis (Medium-Term)
· Downtrend Structure: Looking at the broader picture, the price has been in a consistent downtrend since the peak of $126,199**, breaking through key levels like **$99,523 and $84,475. On a monthly timeframe, we are still clearly stuck in a bearish trend.
· Long-Term Resistance (MA99): The purple line on the chart—the 99-day MA (MA99: ~$88,767**)—is the ultimate trend-defining level that separates a bull market from a bear market. Price is currently trading well below this line. For any meaningful medium-term recovery, BTC needs to climb back to the **$75,000 - $80,000 range first, before it can even test the MA99 hurdle.
· Performance Data: The stats at the bottom of the screen paint a fairly grim picture of the larger trend:
· 30-Day Change: -9% (Downward pressure persists)
· 180-Day Change: -29.66%
· 1-Year Change: -45.31% (Massive value erosion over the last year)
· Monthly Takeaway: The price has not yet given a clear "reversal" signal on the monthly timeframe. The year-long selling pressure will likely only end with a confirmed breakout above the $70,000** resistance. Until then, a retest of the **$57,800 lows remains a distinct possibility.
---
⚠️ Risks & Points to Watch
1. Trading Volume: Looking at the volume (Vol) bars at the bottom, trading activity has been noticeably low over the last few weeks. This indicates that the recent bounces lack conviction, meaning the big players (whales) haven't stepped back in with size yet.
2. The "Tap here for the depth chart" Note: The prompt at the bottom is a good reminder to check the order book depth. You should definitely take a look to see if there are massive sell walls or buy walls sitting at current prices. With an order book ratio showing roughly 9.11% (Buy) vs 90.89% (Sell), the market sentiment on the books is still heavily skewed toward sellers.
---
Summary Verdict: In the short term, BTC must clear the immediate resistance at $64,800**. On the monthly view, however, the downtrend is still intact. While we are in a bottom-finding phase, it doesn't look like a "safe buy zone" just yet; waiting for a confirmed foothold above the MA25 (**~$70,800) would be the smarter confirmation play.
Disclaimer: This is purely technical analysis, not financial advice. Always do your own research, manage your risk, and remember that the final decision is yours. Best of luck and happy trading, folks! 🚀
#BitcoinUp9.5%InJulyBestInFourYears
