

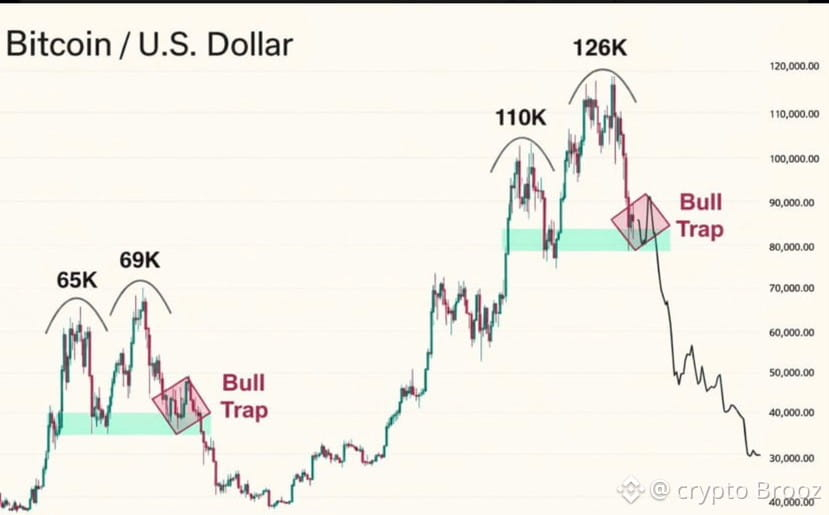
$At the moment, price is hovering around a 1H order block, and from my perspective the probability of this zone being swept is relatively high. The reasoning is not only based on the current price structure, but also on the earlier CRT corrective setup on the 15M timeframe, which suggests that short-term selling pressure may not be fully exhausted yet.From a structural standpoint, Bitcoin is also moving very close to the 71K–72K resistance region. This area is particularly important because 72,000 USD previously acted as a key level on the chart. Markets tend to react strongly around such levels since they often contain a concentration of liquidity and positioning.If price approaches this zone but fails to break through decisively, the market may rotate lower to revisit nearby support levels. In many cases, when resistance holds, the market searches for liquidity below before attempting another move.The key level to monitor on the downside is the double bottom structure on the 1H chart around 68K. This zone currently acts as the structural support for the ongoing rebound. If price breaks below this level and closes with confirmation, it would weaken the current bullish attempt and suggest that the recent recovery may have been only a temporary bounce.Psychologically, areas like 72K often attract breakout traders expecting continuation. If the market fails to sustain momentum there, those positions can quickly become trapped, which sometimes accelerates the next corrective move.For traders positioning for a breakout, this resistance zone deserves close attention. A clean break and acceptance above 72K could open the door for a more constructive continuation. But if the market shows strong rejection signals at this level, a deeper retest of support would become increasingly likely.For now, I’m watching how price reacts around this zone. If a clearer setup develops, I’ll share an update.$BTC #Bitcoin #Bitcoin #Crypto
Follow and support for more updates