🧠 Technical Analysis: Reading Charts and Indicators
Technical analysis relies on studying historical price movements using charts and indicators. Key tools include:
- Moving Averages (MA): Help you understand the overall price trend (upward or downward).
- Relative Strength Index (RSI): Measures the market's saturation with buying or selling, revealing the likelihood of a trend reversal.
- MACD Indicator: Reveals turning points in the trend through the intersection of moving average lines.
- Support and Resistance Levels: Define areas that are hard for the price to surpass, helping you anticipate reversals or breakouts.
🔍 Fundamental Analysis: Understanding factors influencing the market
Fundamental analysis focuses on events and data affecting Bitcoin's price, such as:
- Global Economic News: Such as interest rate decisions, inflation, or financial crises.
- Institutional Adoption: Entry of major companies or banks into the Bitcoin market boosts confidence and raises the price.
- Government Regulations: Any new laws that may affect trading or mining.
- Miner Behavior: If they start selling large quantities, it may indicate upcoming selling pressure.
😬 Sentiment Analysis: Measuring market sentiment
Sentiment plays a significant role in Bitcoin movements and can be measured through:
- Fear & Greed Index: Reveals the general psychological state of traders.
- Funding Rates: In futures, reflect traders' direction (are the majority betting on upward or downward?).
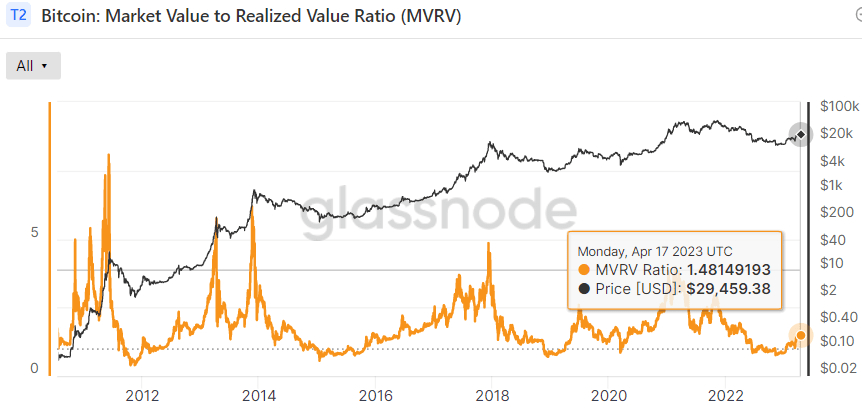
- On-Chain Data: Such as whale activity, currency flows to and from exchanges, and the number of active addresses.
🎯 How do you gather all these tools?
The best way to determine Bitcoin's direction is to combine these tools:
1. Monitor technical indicators to determine the current trend.
2. Follow economic and institutional news to understand the general context.
3. Use sentiment indicators to assess the likelihood of trend continuation or reversal.
4. Don't rely on a single indicator—integrating tools gives you a clearer view.