
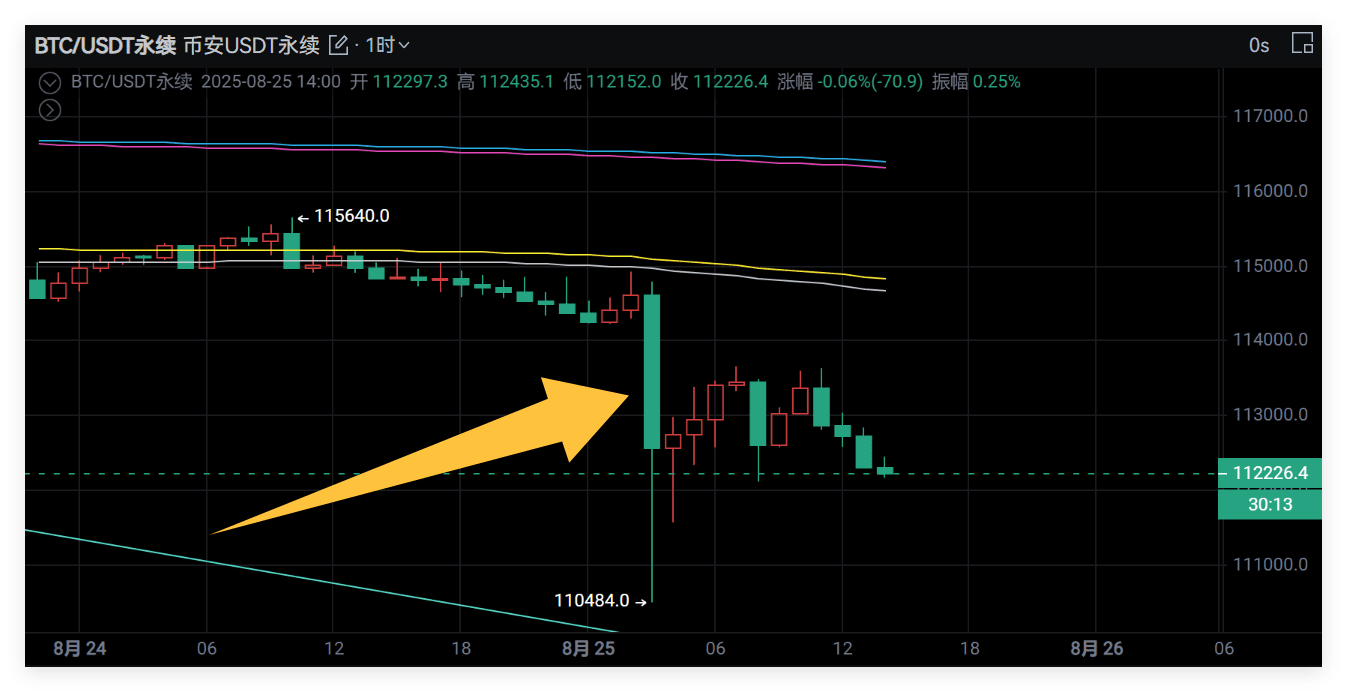
2025.08.25 03:00, BTC experienced a significant drop with high volume in a short time, and a very standard Pin-Bar formed on the hourly chart. Understanding candlestick patterns is one of the most important cornerstones of chart interpretation in price action trading. These candlestick patterns provide visual clues that help traders predict market trends. One of the most powerful and common patterns is the pinbar pattern. In this guide, we will delve into what a pinbar pattern is, how to identify it, and most importantly, how to trade it effectively.
What is a Pin Bar?
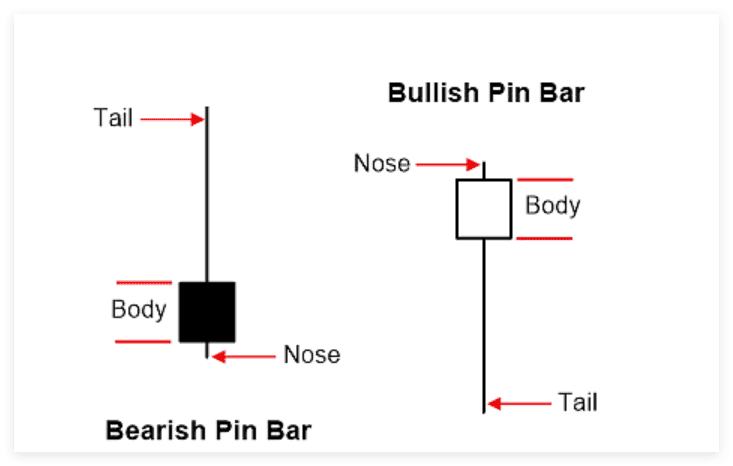
A typical pinbar consists of three main parts:
Long Wick (TAIL): The wick is the most prominent feature of a pinbar. It indicates the price level at which the market rejected. In a bullish pinbar, the wick is at the bottom; in a bearish pinbar, the wick is at the top.
Small Body (BODY): The body of the pinbar (representing the opening and closing prices of the candlestick) is relatively small compared to the wick. This smaller body is crucial as it indicates that there was little consensus between buyers and sellers at the extreme levels tested by the wick.
Shorter Inverse Wick (NOSE): The inverse wick is very short, or may not exist, further emphasizing the dominant rejection represented by the long wick.
Market Mechanism Behind Pinbar: This is a struggle between buyers and sellers, where one side temporarily has the upper hand but ultimately fails, leading to a sharp price reversal. This chaotic situation sends a strong signal to traders to avoid long wicks and turn to the body direction.
How to Trade Using Pin Bar?
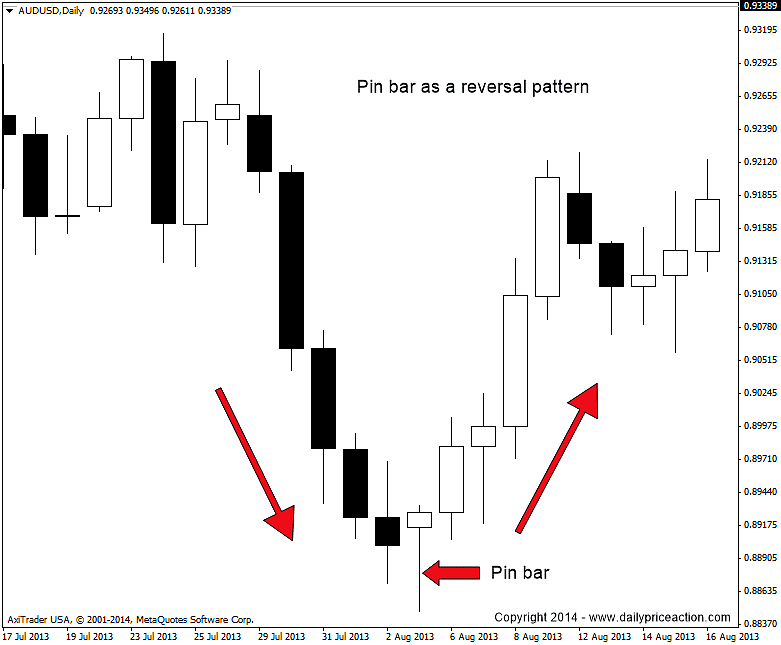
👉Bullish Pinbar Interpretation: A bullish Pinbar indicates that a downtrend may be ending and buyers are entering the market. This type of Pinbar typically appears at the bottom of a downtrend or at key support levels. A bullish Pinbar suggests that the market may reverse upwards.
Suppose you are analyzing a coin that has been in a downtrend, and suddenly a bullish pinbar forms at a strong support level. This pinbar indicates that sellers are trying to push prices down but buyers have stepped in strongly, rejecting the downtrend and pushing prices higher. This may suggest that we should consider establishing a long position as a reversal trading strategy, placing the stop loss below the lowest point of the pinbar.
👉Bearish Pinbar Interpretation: On the other hand, a bearish Pinbar signals a potential downward trend. It often appears at the top of an uptrend or near resistance levels. This type of Pinbar indicates that buyers attempted to push prices higher but faced strong selling pressure, causing a price pullback.
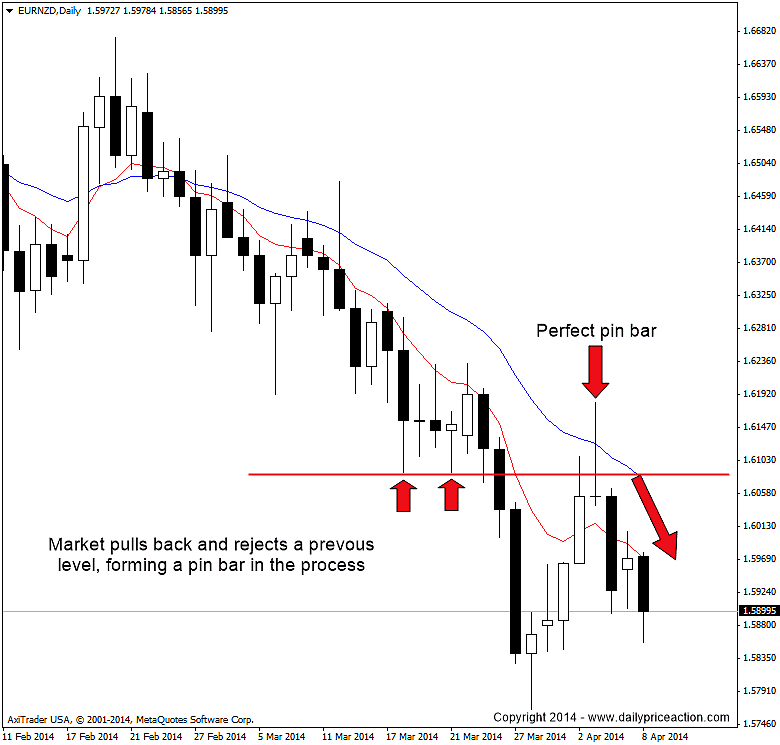
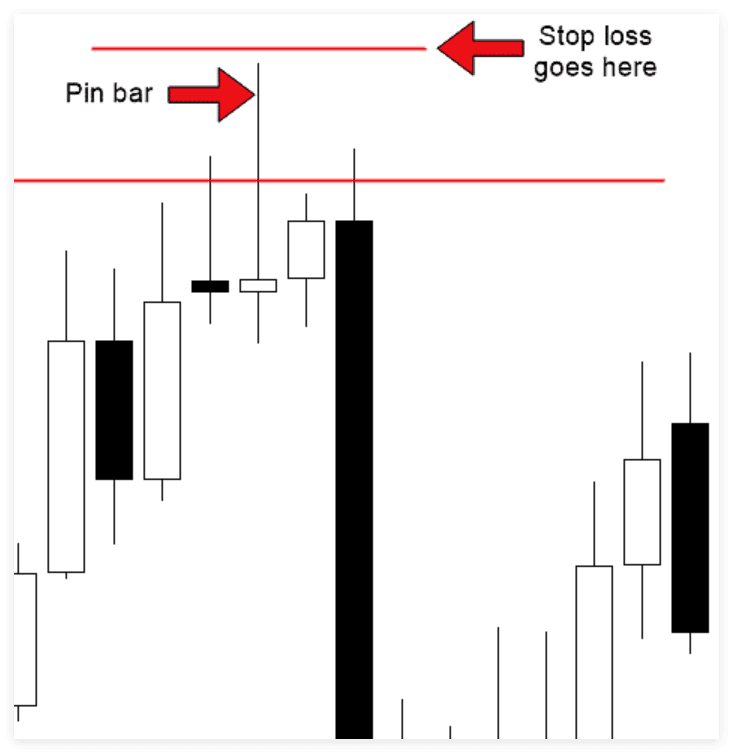
If you are trading a PinBar reversal, whether going long or short, the best stop loss placement after the completion of the PinBar is above or below the long tail of the pinbar. As shown in the image below, keep a distance that you are comfortable with; for example, after the completion of the PinBar in Ethereum, leaving a stop loss space of 10-20 points above the tip of the long tail would be sufficient.
🌞Timeframes: It is best to trade Pinbars on hourly to four-hour timeframes; ultra-short trades that capture Pinbar quick rebounds can also be effective, but ultra-short trades are indeed ultra-short.
Considerations for Trading with Pin Bar
Note that all technical indicators are not foolproof; while the pinbar indicator is powerful, it can sometimes fail:
Invalid Pinbar: Not all candlesticks with long wicks are Pinbars. Before trading, be sure that the candlestick meets the specific criteria for a Pinbar. Additionally, the environment in which the Pinbar forms is crucial. If a Pinbar forms in the mid-term of a trend, and there are no significant support or resistance levels nearby, it may be unreliable.
Overtrading by Relying Solely on Pinbars: Relying solely on Pinbars for trading decisions can lead to overtrading and poor outcomes. Before trading, it is essential to consider other factors, such as overall market conditions, other technical indicators, and risk management strategies.
By combining pinbars with other technical indicators (such as moving averages, RSI, or Fibonacci levels), the effectiveness of both strategies can be enhanced, thereby increasing the probability of successful trades.
Pinbars at resistance and support levels have a higher success rate!
🧧🧧🧧Other supplements to be updated
