


Bitcoin's price has been trending downward since reaching a new all-time high of $123,731 on August 14. The leading currency is now trading at $115,892, marking a 7% drop in less than a week.
This decline has raised concerns among traders, but on-chain data suggests a potential recovery led by the largest Bitcoin investors may be on the horizon.
BTC may enter a new bullish phase, the analyst says.
In a new report, the anonymous analyst at CryptoQuant, SunflowrQuant, noted that "a new bullish phase for Bitcoin may begin in the near term," as a key on-chain indicator shows positive signals.
SunflowrQuant assessed the whale ratio on Bitcoin exchanges and found that the indicator has risen to a level that historically aligns with local price bottoms.
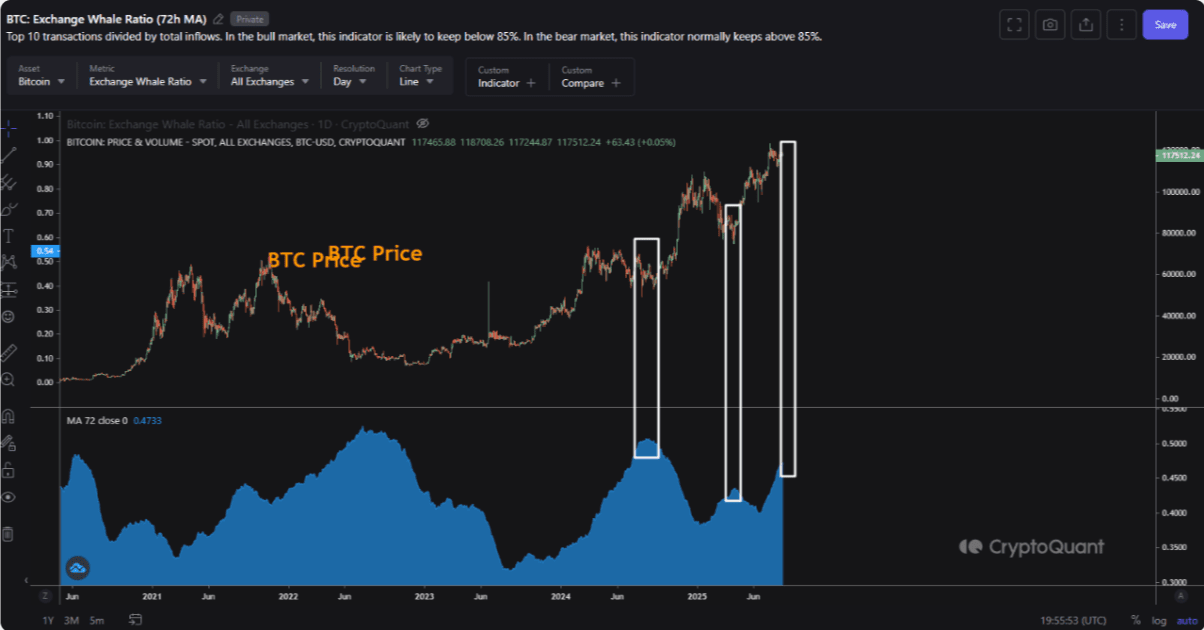
The whale ratio on Bitcoin exchanges measures the amount of coins flowing into exchanges from the top 10 transactions. An increase in the ratio indicates heightened activity from large investors, typically in preparation for significant market moves.
The report clarified that "when this ratio rises, it indicates that large investors (whales) are becoming more active on exchanges — which is often interpreted as a sign of preparing for large market moves."
The analyst also noted the historical performance of the whale ratio on Bitcoin exchanges and found that the currency enters a bottoming phase whenever the indicator rises to test the 0.50 level.
The analyst said: "Looking at recent years, whenever the whale ratio on exchanges tested the 0.50 level, it often indicated local price bottoms, followed by periods of consolidation and then bullish movement."
This metric is observed using a seven-day moving average, currently sitting at 0.48, approaching the 0.50 mark.
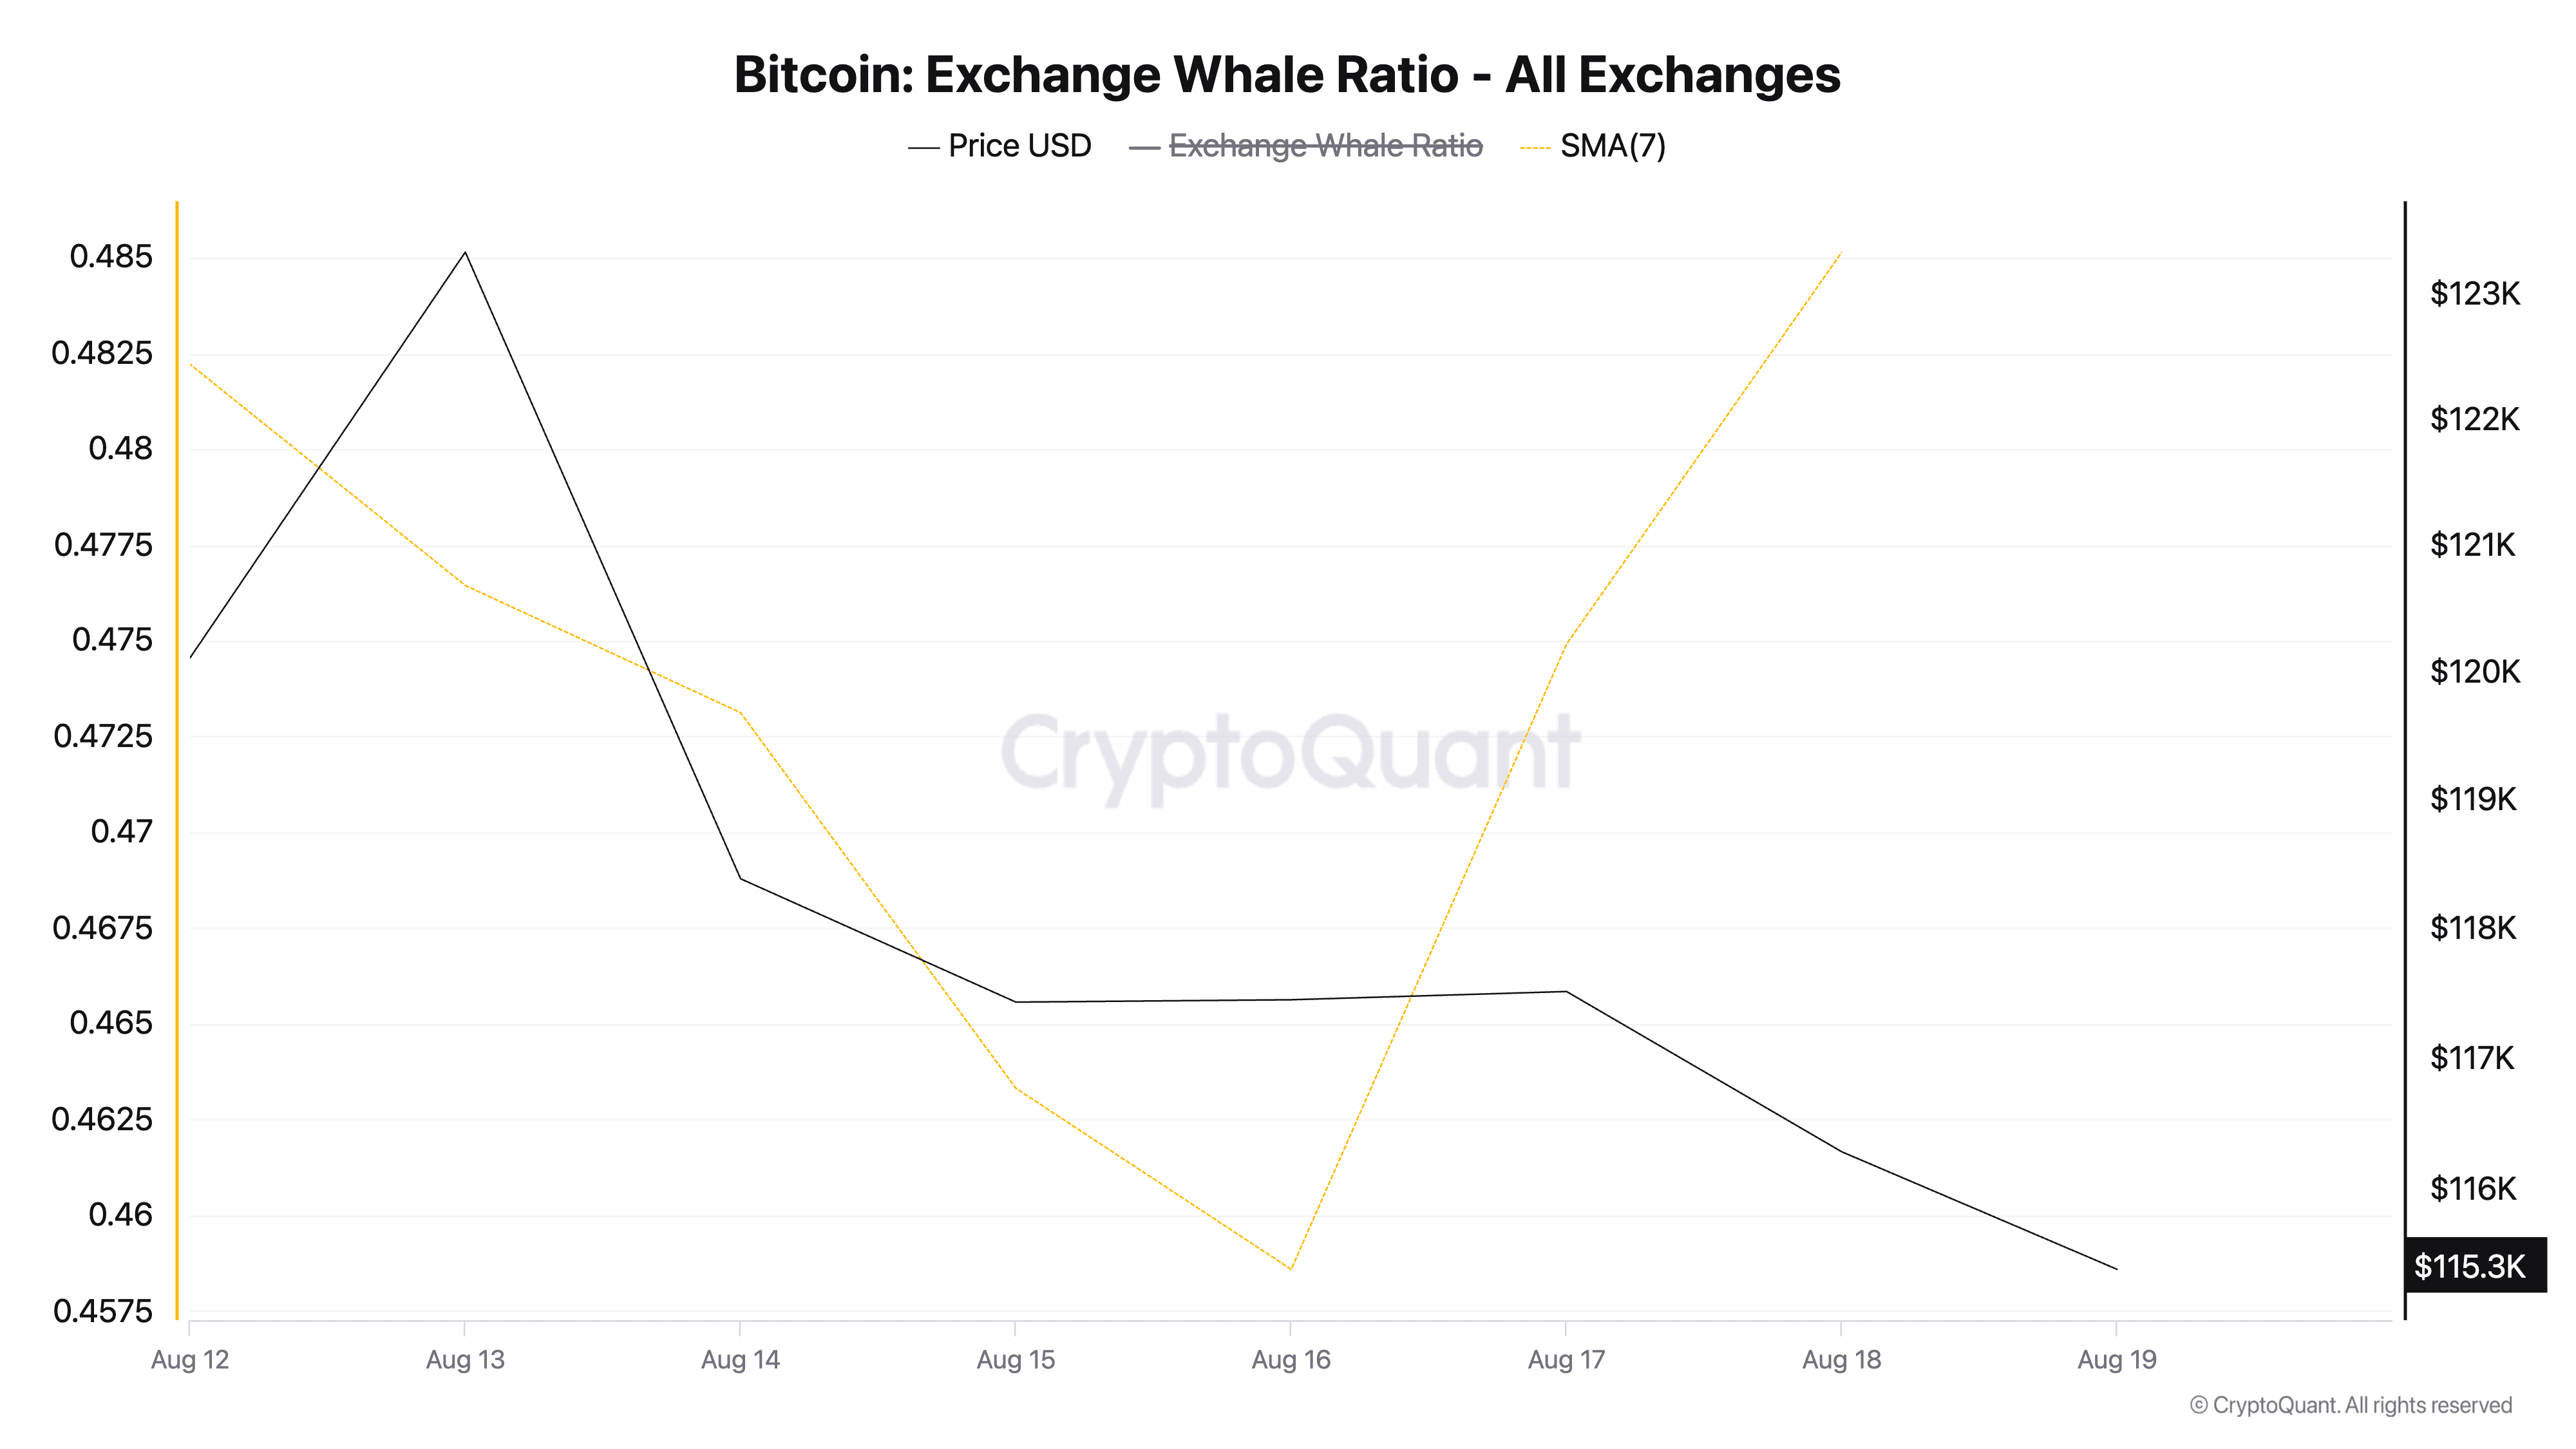
If history is any guide, this pattern suggests that the recent decline in Bitcoin's price may be nearing exhaustion, setting the stage for another rally.
Bitcoin's liquidation map indicates a price magnet of $120,000.
Bitcoin's liquidation map readings support this bullish outlook. According to Coinglass data, there is a concentration of leveraged positions and liquidity above the currency's price near the $120,000 area.
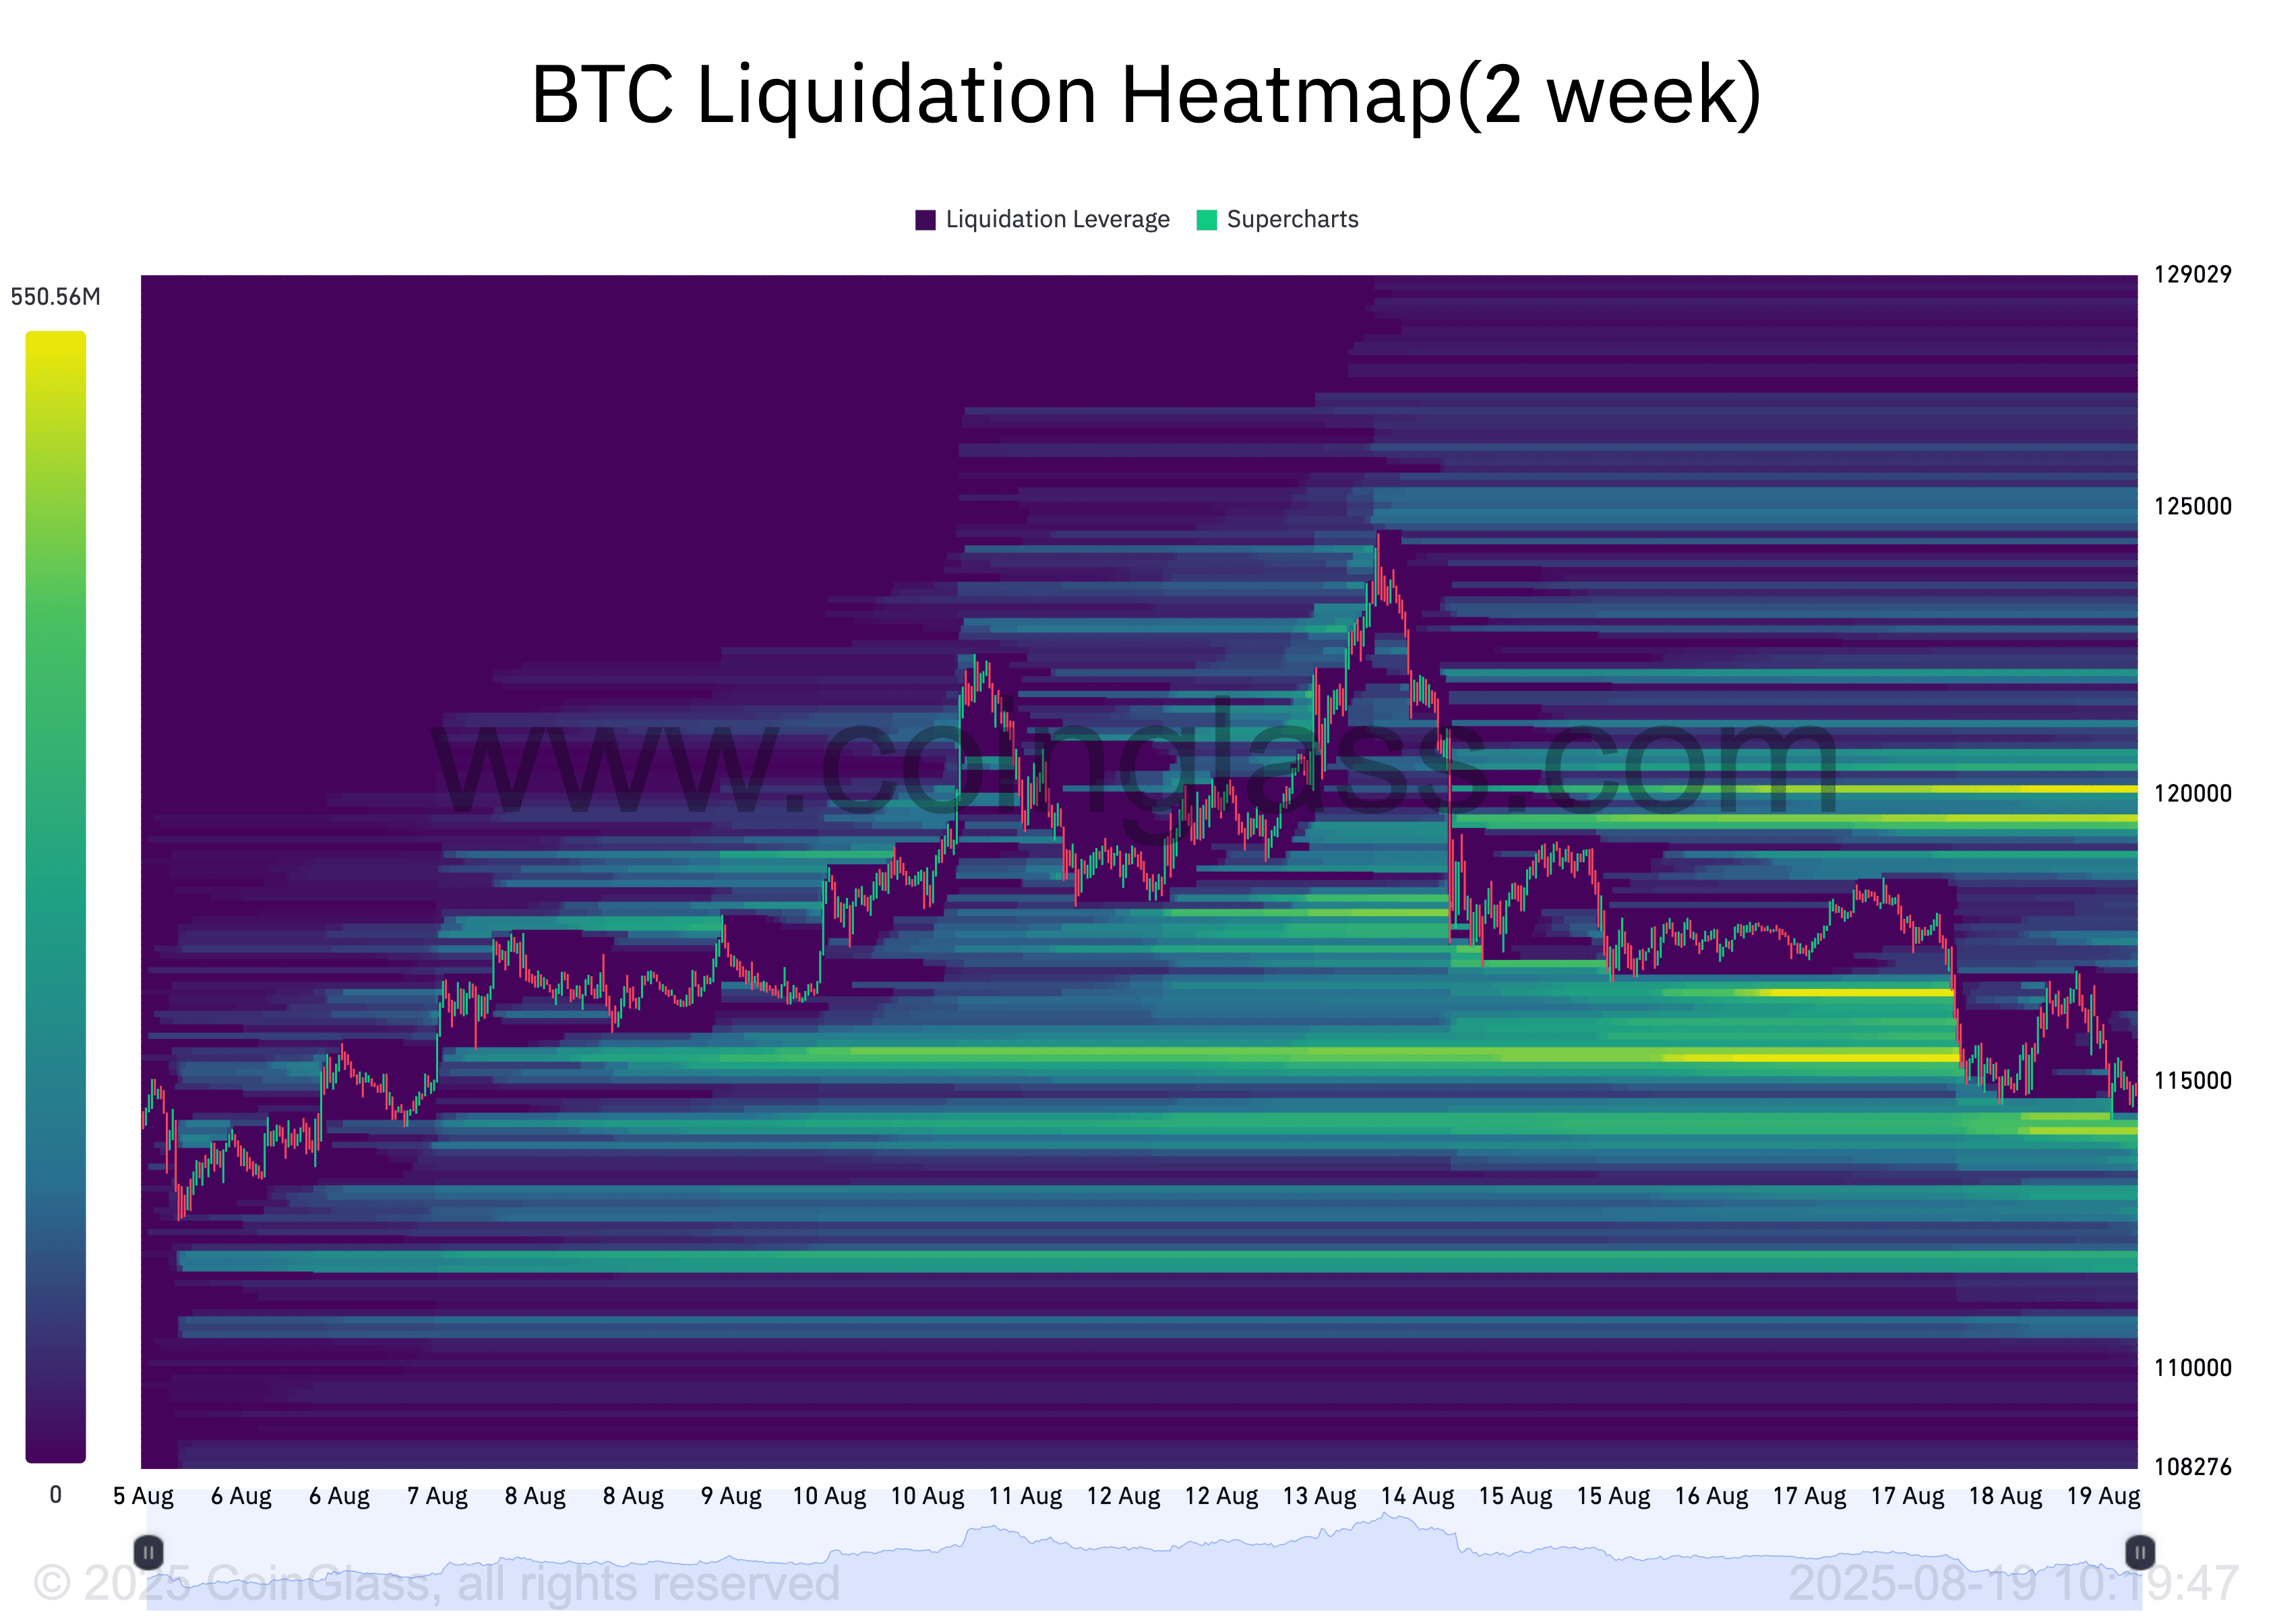
Liquidation maps are visual tools that track the clusters of leveraged trading positions (longs and shorts) in the market and highlight price levels where collective liquidations are likely.
Typically, when capital clusters form above an asset's market value, they attract short-term bullish momentum as traders seek to capitalize on these liquidity zones.
Thus, it may attract short-term bullish momentum for Bitcoin as traders seek to capitalize on it.
BTC risks dropping to $111,000 if the selling continues.
If SunflowrQuant's predictions hold true and Bitcoin finds a bottom soon, the currency could rebound towards the $120,000 mark after a period of consolidation.
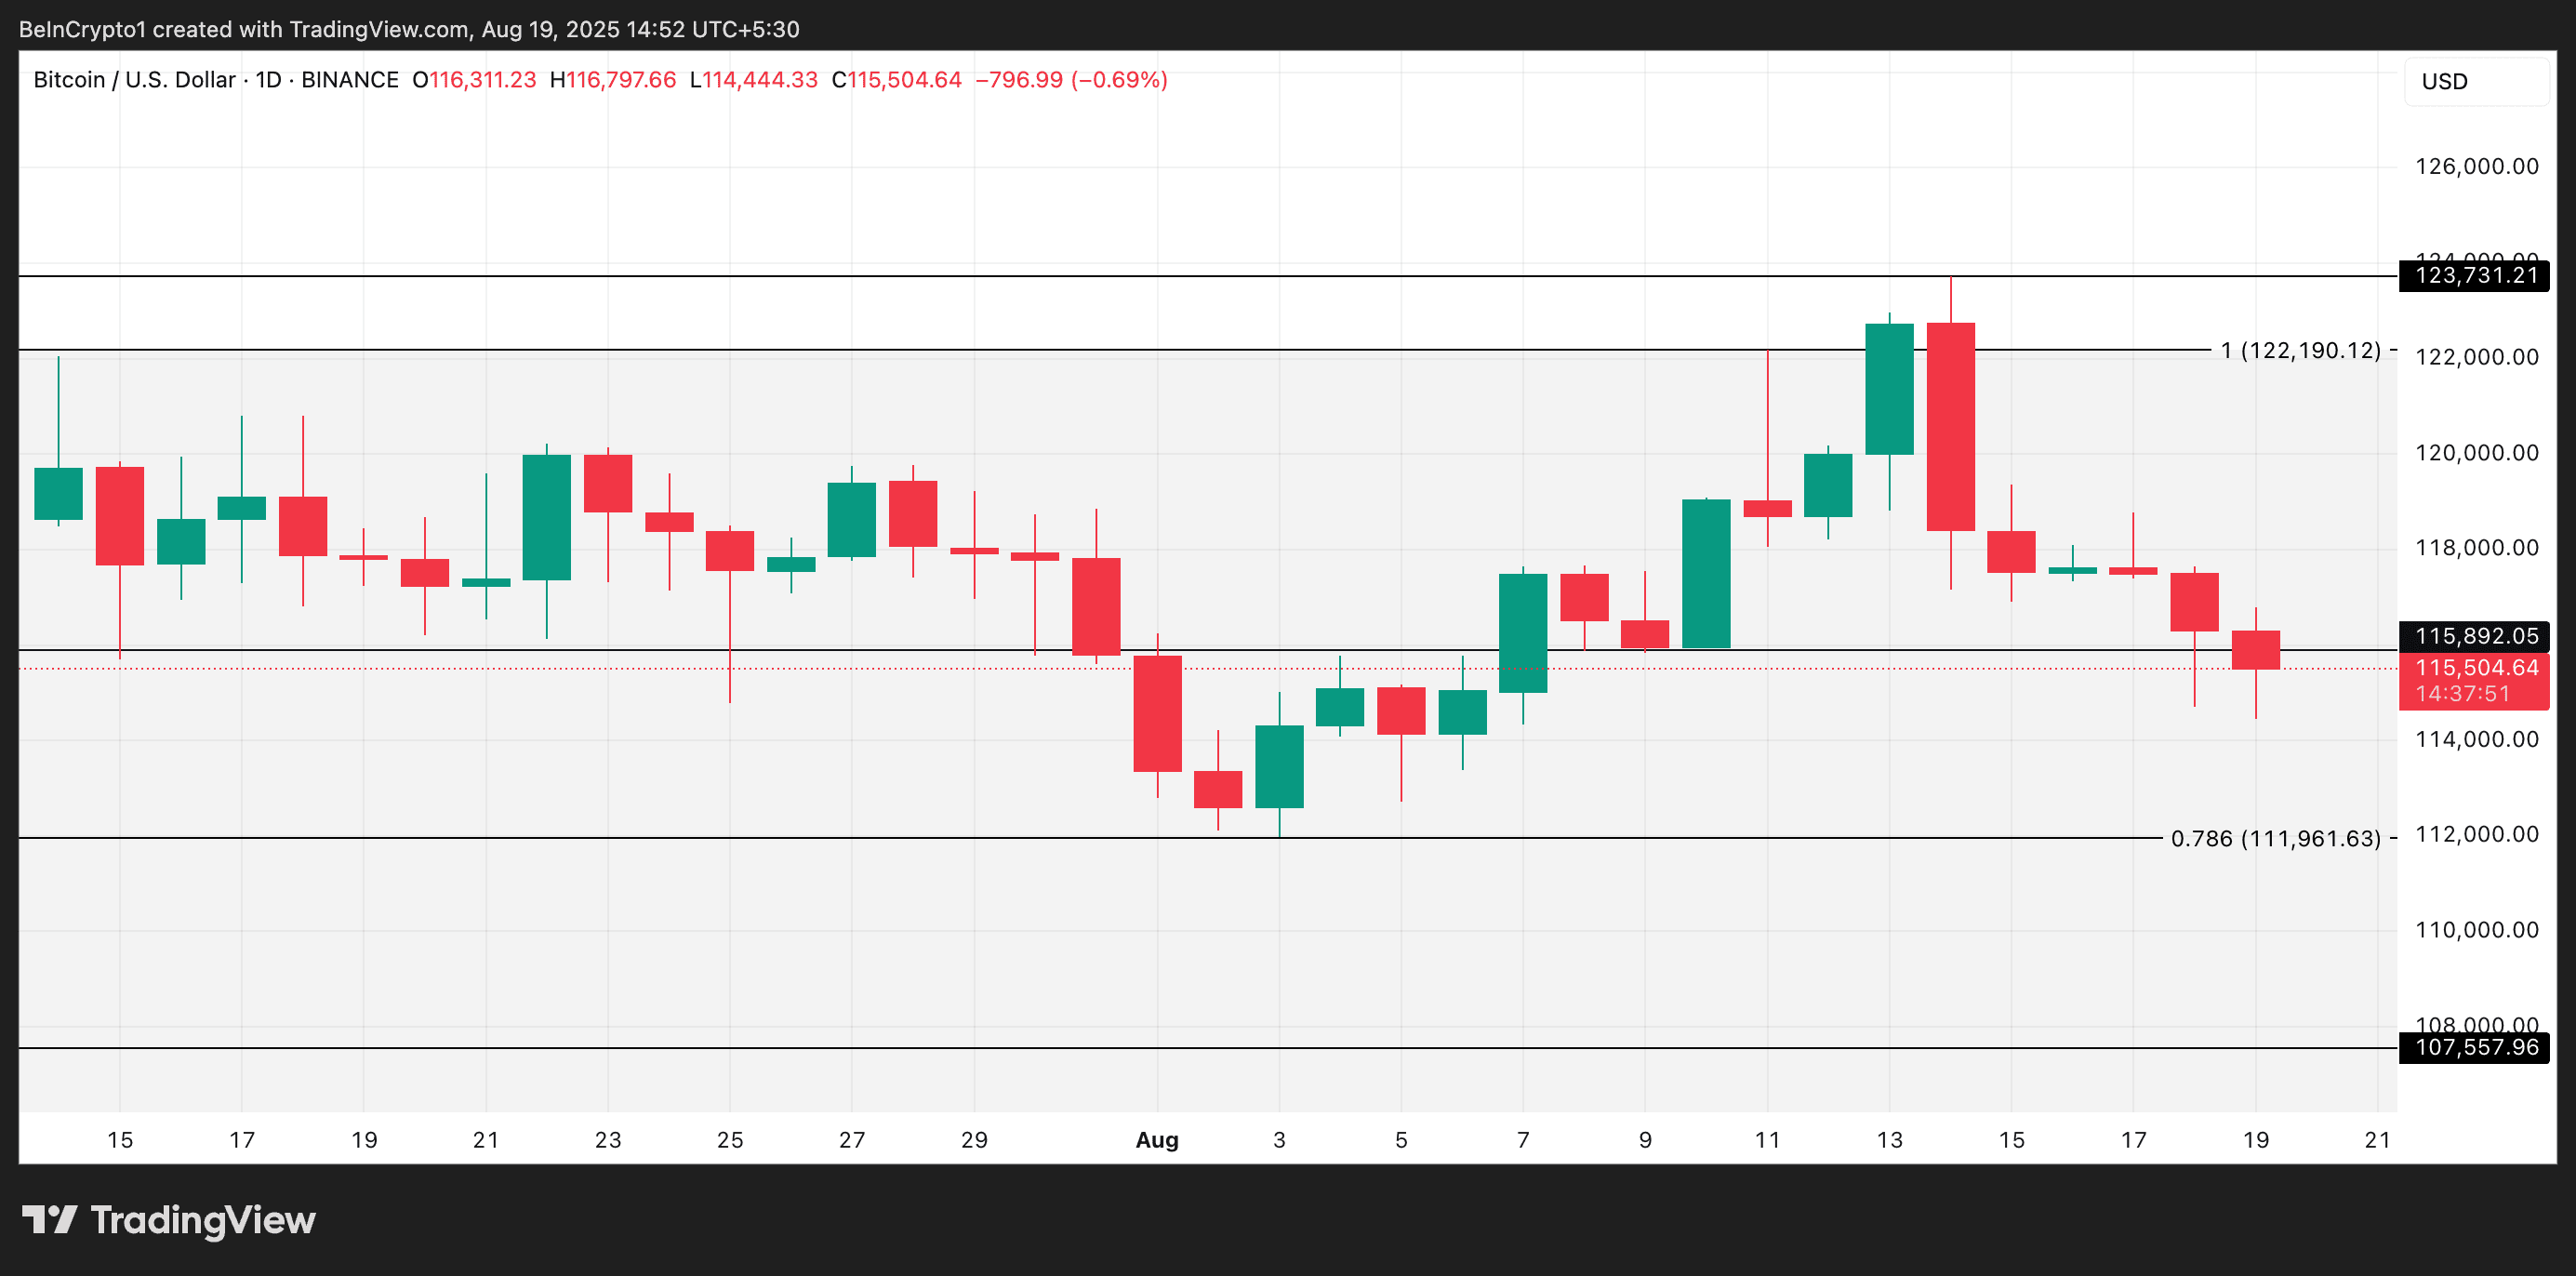
However, if selling pressure intensifies in the short term, Bitcoin risks extending its decline to $111,961, a level last seen on August 3.
