


Following the CPI report released on July 15, Bitcoin quickly lost momentum and faced strong selling pressure across the board. From the recent peak of 123,203 USD, BTC's price has fallen to 118,215 USD at the time of writing, equivalent to a correction of about 4% — a signal indicating that market sentiment is turning negative.
In the context of a surge in inflows to exchanges and a weakening technical structure, the question now arises: Is the next 8% price drop an inevitable scenario?
Inflow into exchanges peaked
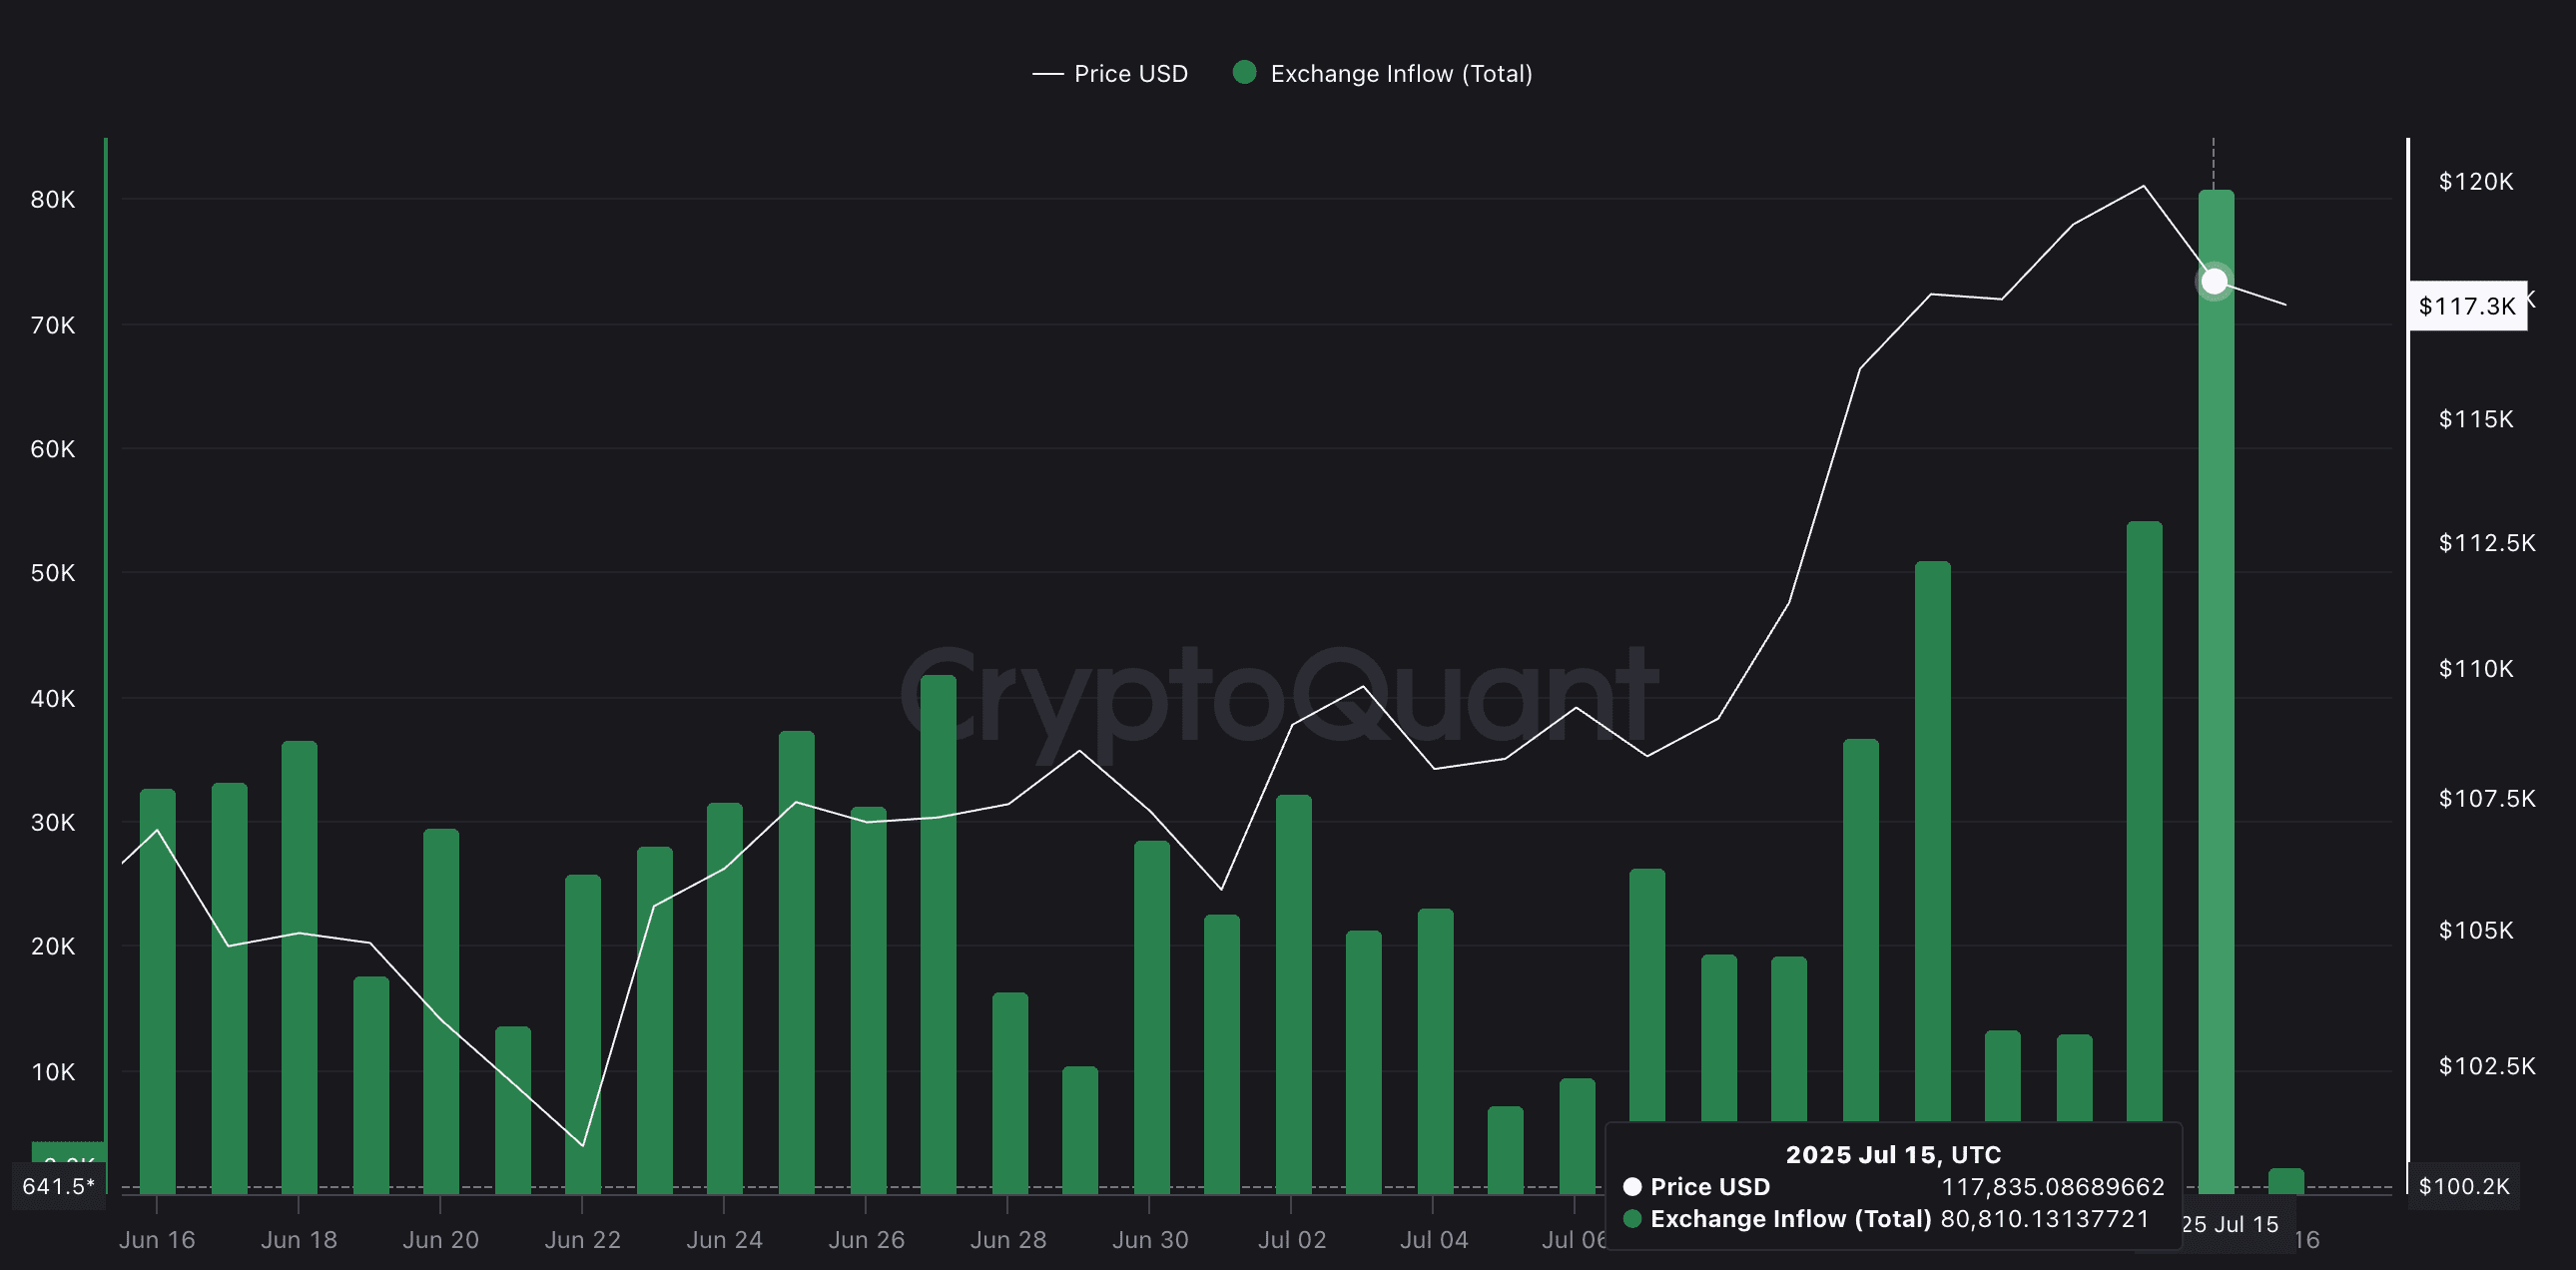
Data from CryptoQuant indicates that on July 15, the market recorded over 80,810 BTC transferred to centralized exchanges — the highest in a single day since early 2025. In estimated value, this represents a capital flow worth over 9.4 billion USD into trading platforms within just 24 hours.
The flow and price chart of BTC from CryptoQuant shows a simultaneous increase between BTC inflows to exchanges and falling prices, a pattern often associated with significant selling pressure.
In terms of market behavior, a large amount of BTC being transferred from personal wallets to exchanges is often seen as a clear sign that investors are preparing to sell. In a context where prices show signs of weakening, such large capital flows not only reflect a risk-averse sentiment but also trigger a potential wave of selling.
Historical accumulation zone: Support layer for the decline
According to the on-chain heat map from Glassnode, Bitcoin has recorded strong buying activity at two key price zones:
93,000 – 97,000 USD
101,000 – 109,000 USD
In these areas, a large amount of BTC has been absorbed by strong buying forces, creating 'accumulation clusters' — where prices tend to receive natural support whenever the market corrects.
Notably, the 107,000 – 109,000 USD range stands out as a significant technical and psychological level. This is not only an area where prices went sideways for many sessions before BTC broke through to an all-time high, but also where many investors opened long positions. A return to this range during a decline could trigger renewed buying interest from both new investors and those looking to average down.
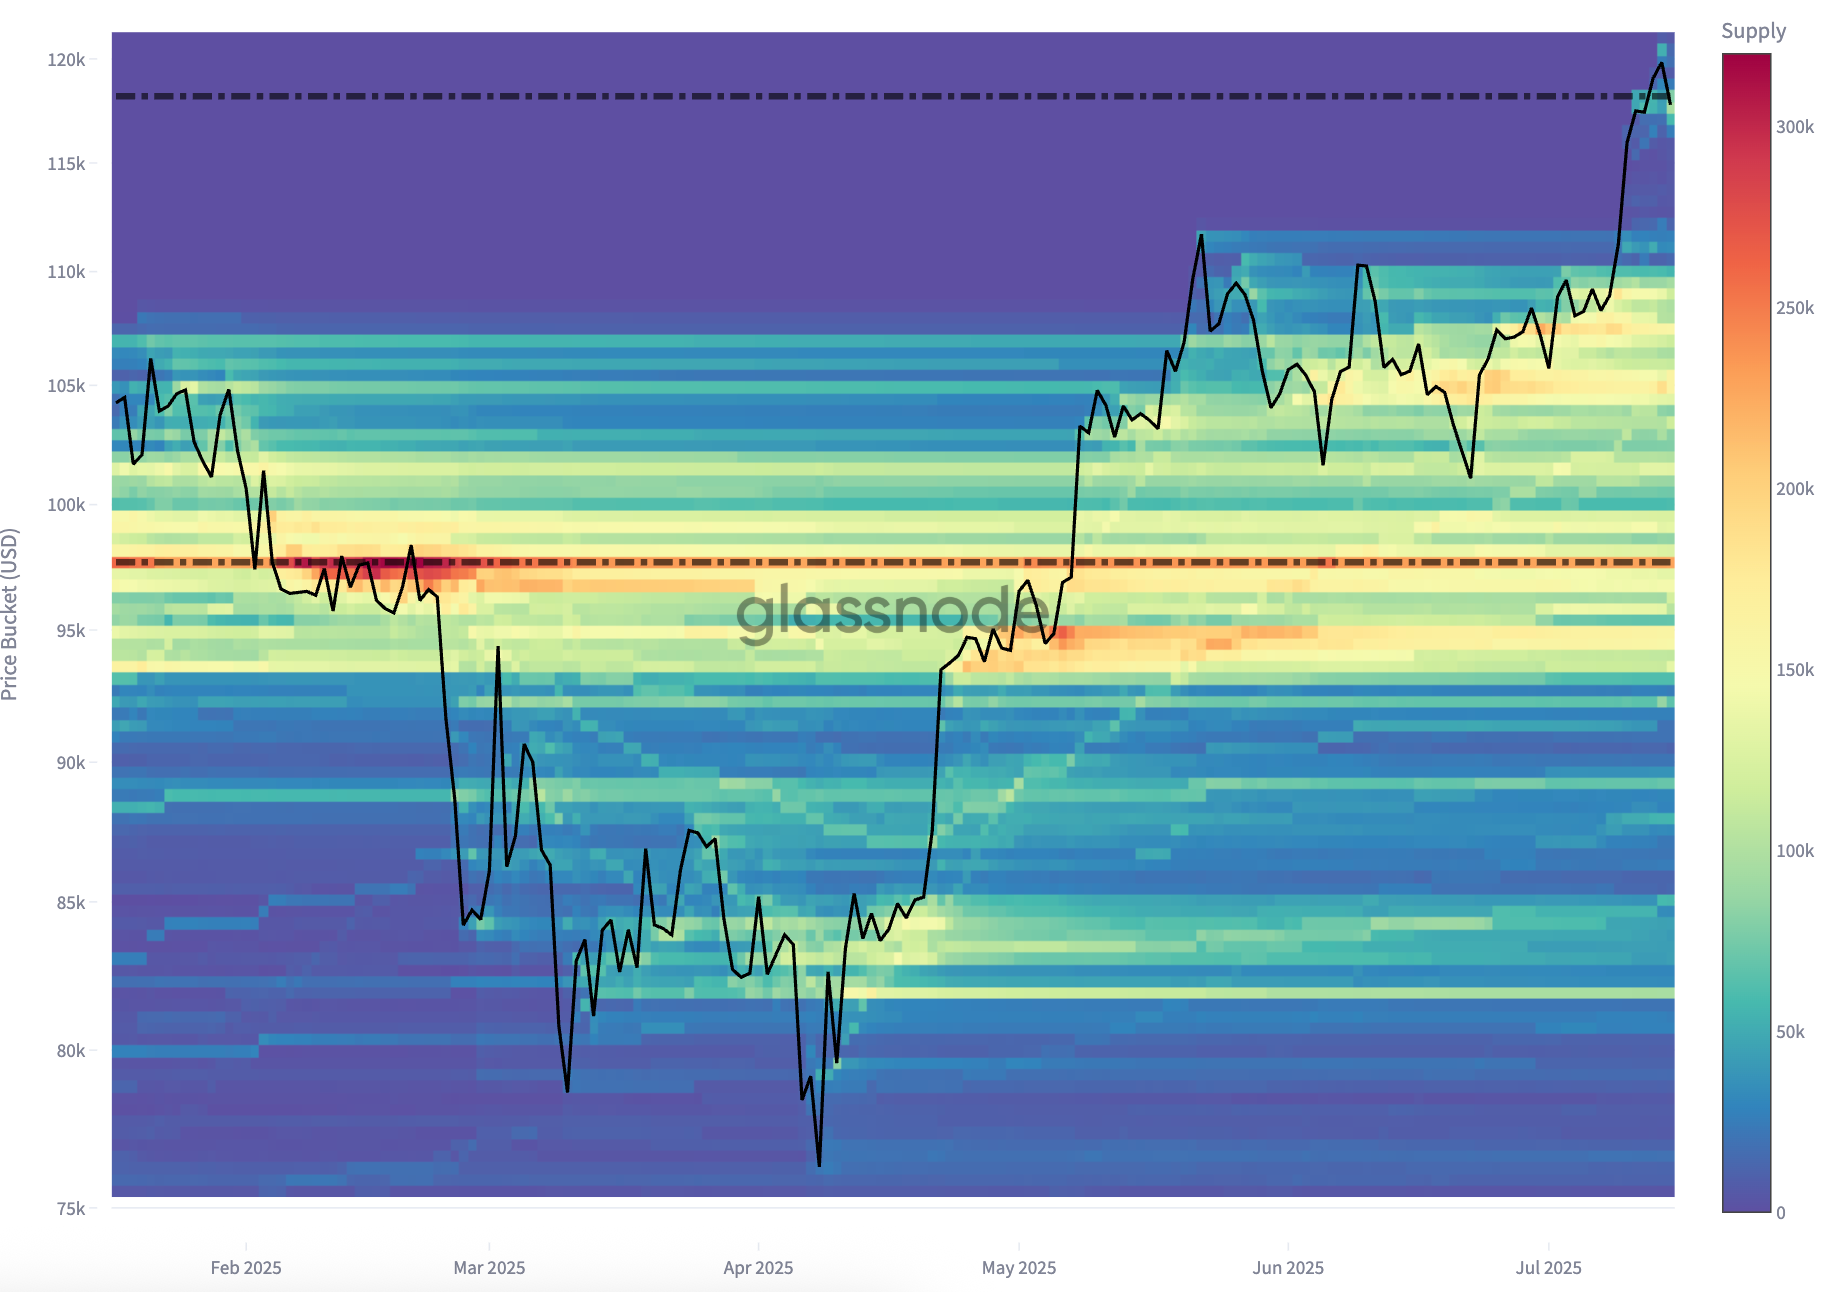
Overall, these accumulation zones reflect significant buying history, serving as important 'buffer zones' that help the market absorb selling pressure. If prices continue to decline sharply, the likelihood of a supportive reaction from these areas is very high.
An 8% drop could still occur
At the current moment, Bitcoin is trading around the 118,215 USD mark, with a slight increase of 1.3% over the past 24 hours but down about 4% from the recent ATH. Notably, this decline has caused the price to break the important Fibonacci support level of 0.236 at 117,293 USD before bouncing back.
The Fibonacci retracement system is used to identify potential support/resistance areas in a trend. In this case, the levels are calculated from the June low of around 98,160 USD to the recently achieved all-time high of 123,203 USD, helping to outline points where price reactions may occur during market corrections.
A deeper observation based on Fibonacci structure indicates that the next level analysts are particularly focused on is the 0.618 retracement level at 107,726 USD — commonly referred to as the 'golden pocket' in technical analysis. This is the area where assets tend to form technical bottoms and bounce back after significant corrections, especially if the long-term uptrend remains intact.
Despite having two intermediate levels at 0.382 (113,637 USD) and 0.5 (110,682 USD), these areas lack clear accumulation data in the past and do not show significant buying pressure, thus the potential for support if prices continue to decline is relatively weak.
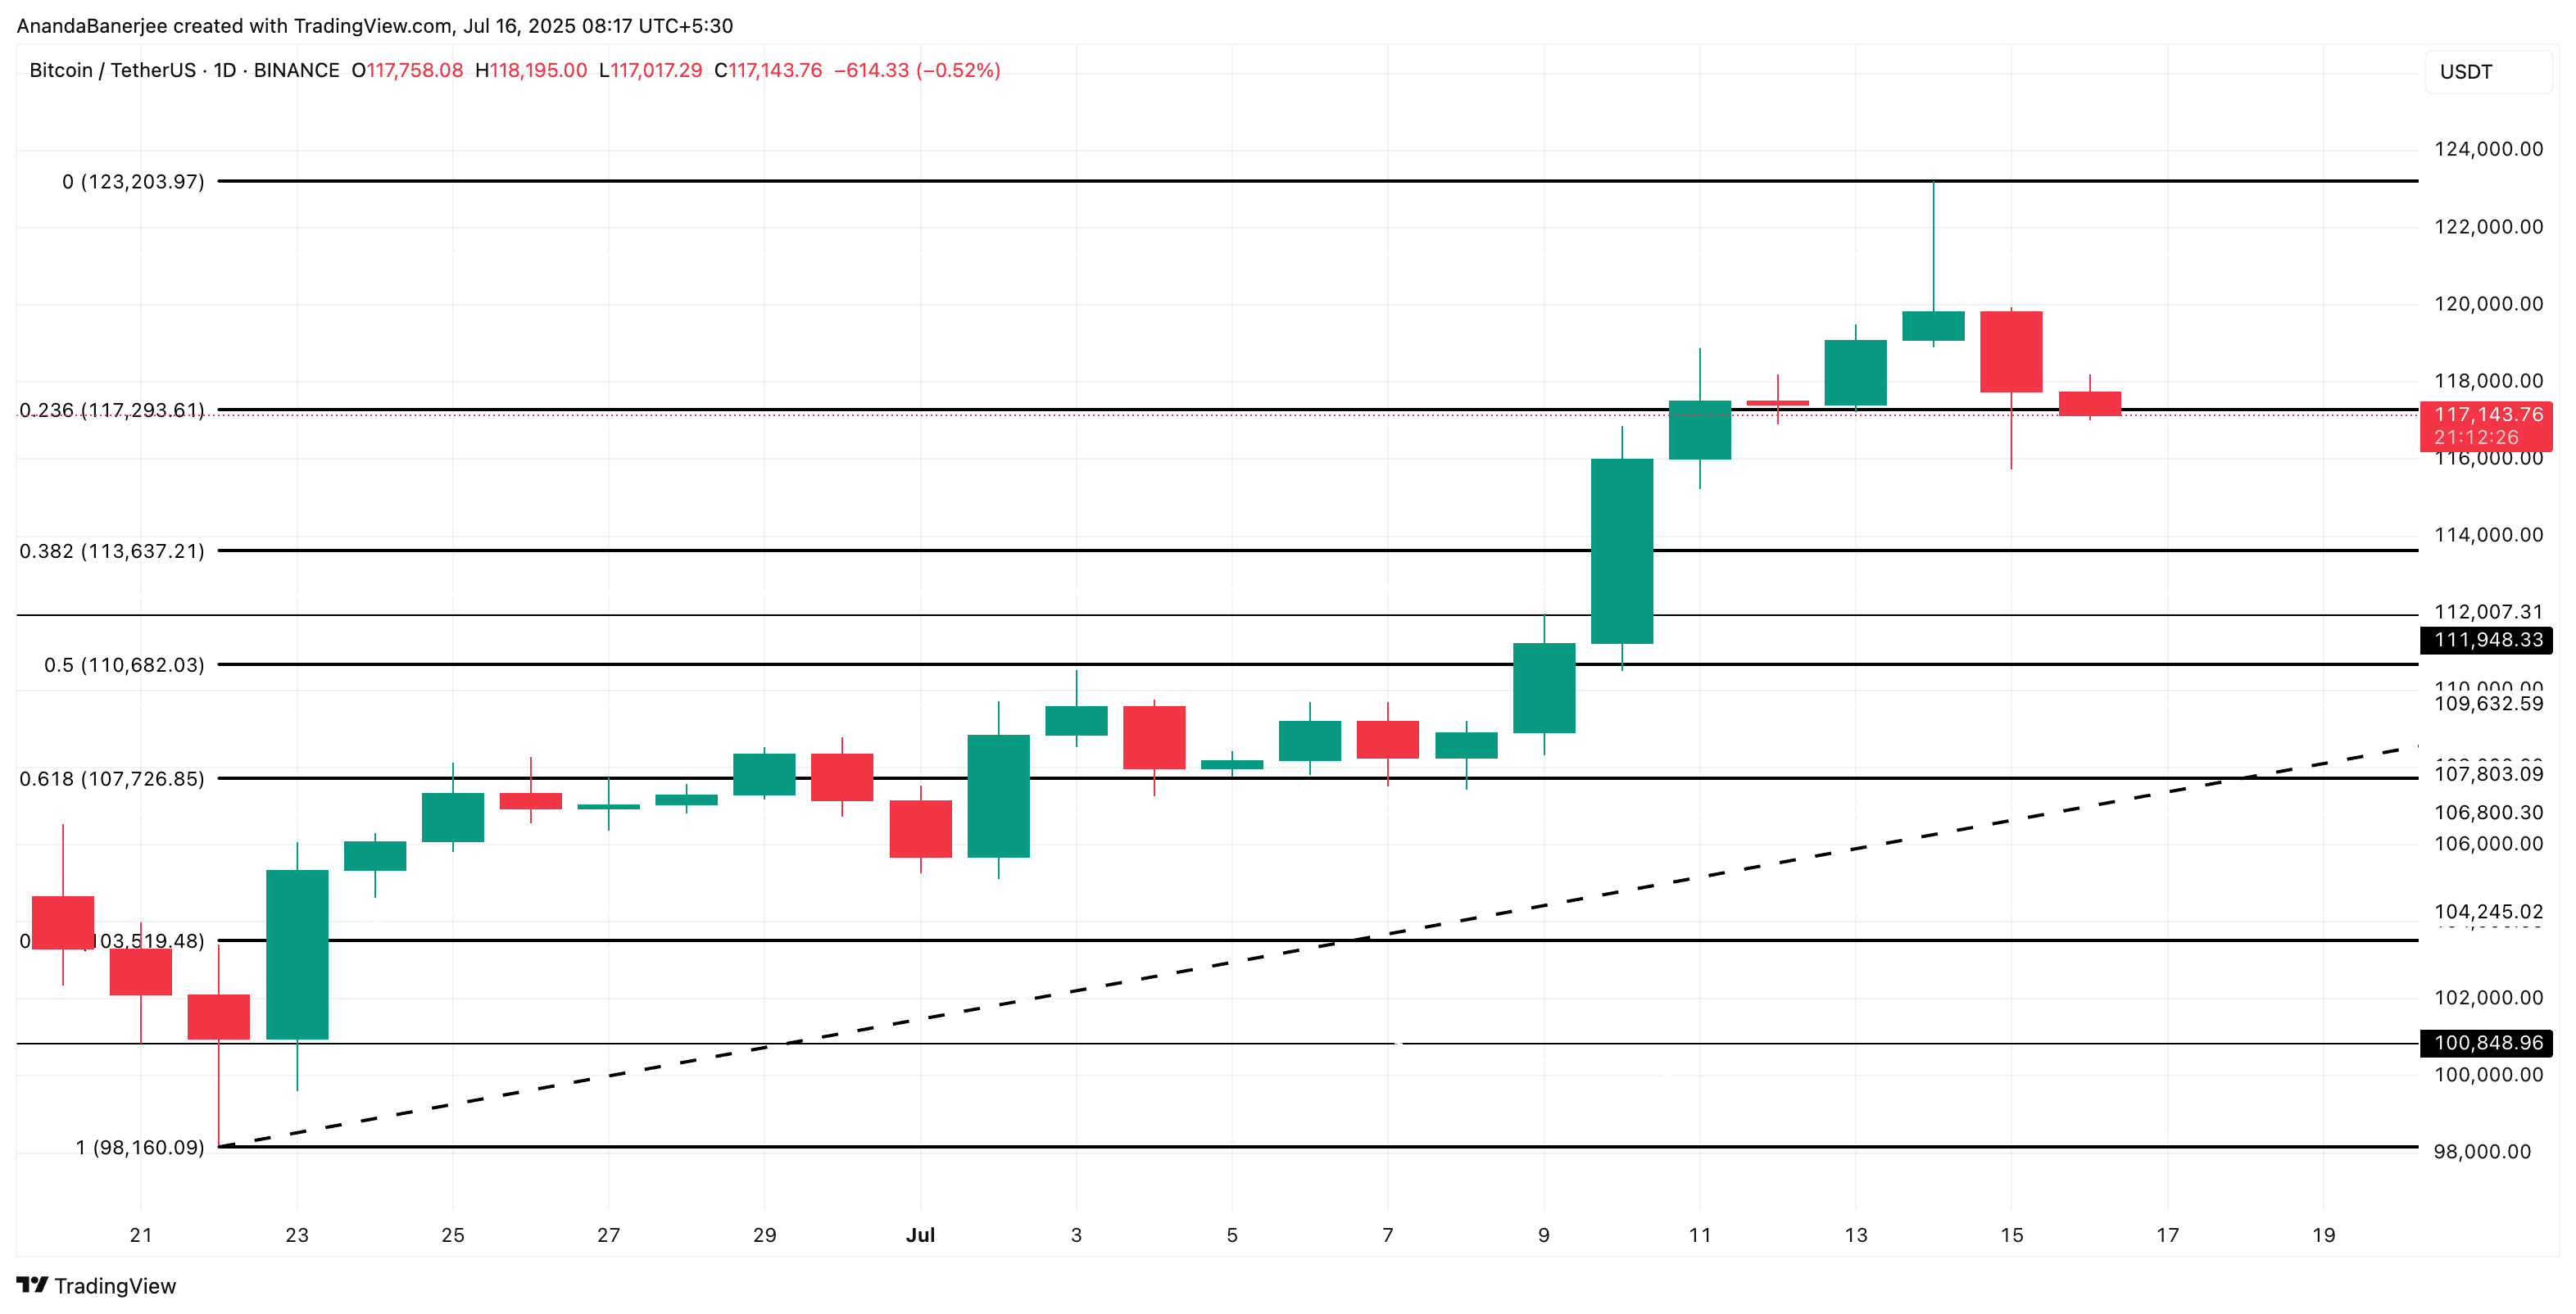
Conversely, the 107,726 USD zone is not only an important Fibonacci level but also almost perfectly overlaps with the strong accumulation zone of 107,000-109,000 USD — where significant buying inflows were previously recorded. The intersection of these technical and market behavioral factors makes this a 'natural defense line' that buyers may try to protect.
If Bitcoin slips from the current price range down to this level, the decline will be around 8%, a scenario that could definitely happen in the context of strong BTC inflows to exchanges, while the market structure continues to signal weakness.
\u003cc-37/\u003e

\u003cc-74/\u003e
