


Earlier this week, after Bitcoin price surged significantly to a local high of $122,000, it entered a consolidation phase. As of the time of writing, the trading price is close to $117,300. Although…
Earlier this week, Bitcoin price surged to a local high of $122,000, then entered a consolidation phase. As of the time of writing, Bitcoin is trading close to $117,300. Although the overall trend remains bullish, short-term technical indicators show signs of price fatigue. Bulls must defend the $115,000-
The $116,000 area to avoid a deeper pullback.
Bitcoin price forecast table: July 17, 2025.
Indicators/Area Level/Signal Bitcoin today's price $117,316 Resistance $118,200 (Bollinger Bands middle band) Resistance 2 $120,500-
$122,000 (supply + wedge) support $115,000 (EMA50 and local benchmark) support 2 $112,500 (trend line + flow)
Momentum) RSI (4 hours) 51.34 (neutral, cooling) MACD (4 hours) bearish crossover Volume Weighted Average Price (30 minutes) $117,297 (resistance) SAR (30 minutes) above price (bearish) Bollinger Bands (4H) tightening policy and volatility setting EMA cluster
(20/50/100/200, 4H) The 20-day moving average is at $117,496 (pivot area) Derivative trading volume -14.35%, market sentiment cooling Options hot area (July 25) $117,000-$118,000 (pin level)
What is the price of Bitcoin?
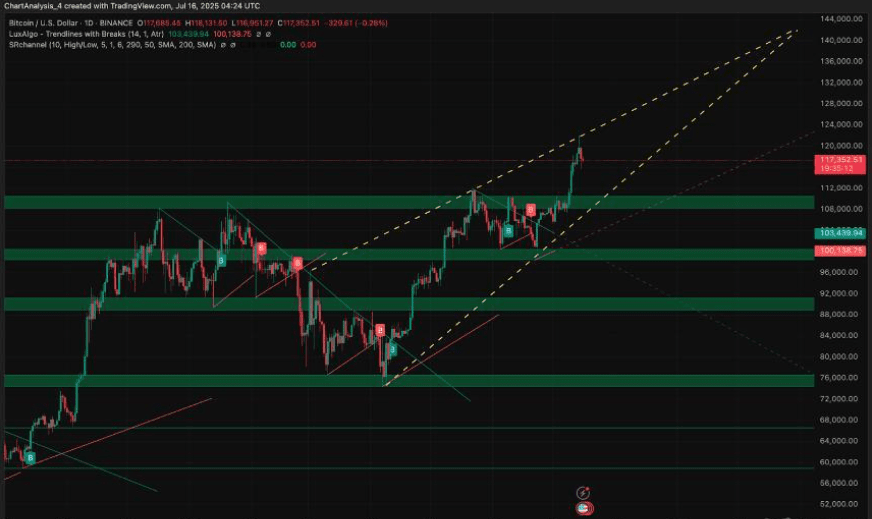
The daily chart shows that Bitcoin price has retraced from the upper boundary of a long-term ascending wedge, with the latest K-line forming a potential top shadow near $122,000. This area coincides with the resistance level formed by the upper trend line of the wedge, marking Bitcoin's third failed attempt to break through the $121,500-$122,500 range.
The 4-hour chart shows that the price is retreating to the EMA cluster support level. The 20-day and 50-day EMA are close to $117,496 and $115,454, respectively. After breaking the upper band of the Bollinger Bands, the K-line pattern shows a downward trend in highs and closing prices, and the upper band of the Bollinger Bands is flattening, indicating that Bitcoin has entered a typical volatility squeeze zone.
Why has Bitcoin price dropped today?
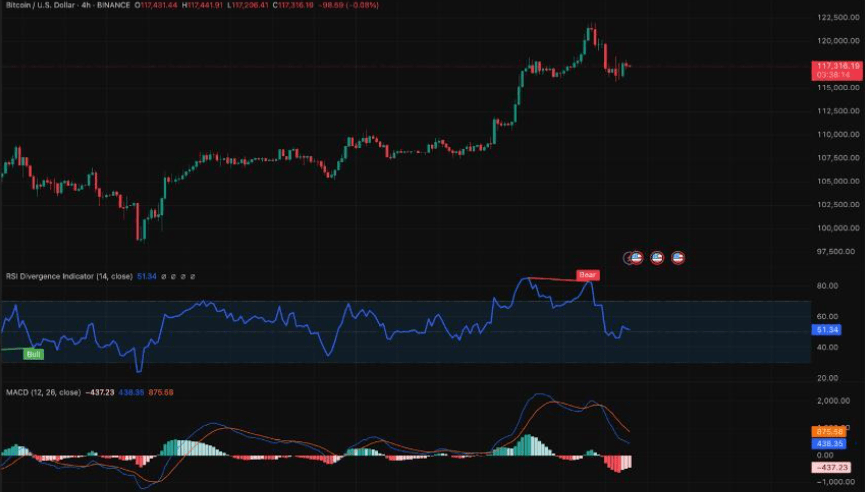
The short-term pullback in Bitcoin price today is driven by divergence and derivative positions. The RSI on the 4-hour chart shows a bearish divergence at the $122,000 peak, indicating weakening buying power. The MACD indicator has also turned bearish, with the histogram bars turning red, and the MACD line crossing below the signal line, further confirming the weakening of short-term bullish momentum.
The parabolic SAR indicator (SAR) and Volume Weighted Average Price (VWAP) on the 30-minute chart show that Bitcoin is trading below the daily VWAP.
($117,297), and the SAR resistance point is above the K-line, indicating downward pressure in the intraday. If the price continues to break below the $117,500 VWAP range.
Domain, which may open up further downside space.
Price indicators show a squeeze setup and EMA retest.
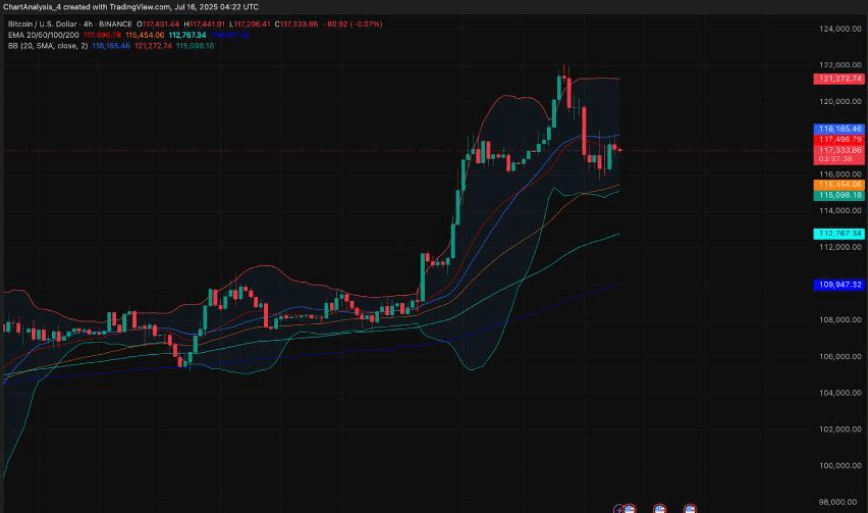
The Bollinger Bands on the 4-hour chart began to tighten after a failed breakout attempt. Bitcoin is currently between the middle band ($118,185) and the lower band (around $115,098), and this narrowing trend increases the likelihood of a recent increase in volatility.
EMA (20/50/100/200) shows a continuing bullish trend, with prices still above the 100 EMA ($112,767) and 200 EMA ($109,947).
Yuan). However, the K-line chart is testing the 20EMA below, indicating that the trend is weakening. If this area is not defended, the next challenge will be the $114,000 to $115,000 range.
BTC Price Prediction: Short-term Outlook (24 hours)
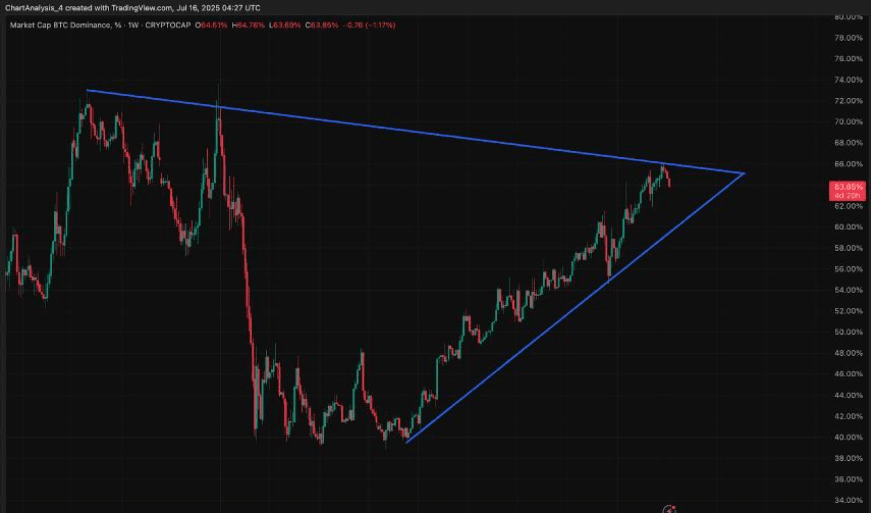
Bitcoin's dominance is pulling back from 64% after reaching the peak of a multi-year triangle. This pullback indicates that short-term funds are shifting to altcoins. As long as dominance remains above 61.5%, Bitcoin's structural trend remains strong. A breakout above 66.5% will solidify Bitcoin's long-term market leadership.
On July 17, unless trading volume confirms a breakout or collapse, Bitcoin price may remain in a range between $115,000 and $118,500.
Movement. If the middle band of the Bollinger Bands at $118,200 is broken and confirmed, the next resistance will be at $120,500, followed by $122,000. However, if the VWAP and 20-day EMA cannot be regained, it may test the range of $114,800 to $115,000 again. If this range is broken, it may drop towards $112,500, or even reach the demand range of $110,000 to $109,000.
Good cars don't wait for people; take advantage of the available parking spaces and hurry to find Kueh Ge.