

Core principle: Strictly allocate positions | Only trade BTC+/ETH+ | Stop loss > take profit | Limit to 3 times
1. Starting phase: 300U→1100U (3 levels sprint)
Strategy: 100U × 3 times, each with 10x leverage, 7% take profit / 5% stop loss (profit-loss ratio 1.4:1)
Execution Steps: Level 1 (100U→200U) Target: Profit 70U (7% take profit) Stop loss: -50U (5%) Success → Enter Level 2, Failure → Remaining 200U adjust strategy
Level 2 (200U→400U) Target: Profit 140U Stop loss: -100U Success → Level 3, Failure → Remaining 100U guaranteed.
Level 3 (400U→800U) Target: Profit 280U Stop loss: -200U Success → Capital reaches 1100U, enter stable strategy
A key discipline: a maximum of 3 times! Regardless of success or failure, switch to a stable approach using only BTC/ETH, refuse altcoins (poor liquidity, high pin risk)
Second, 1100U phase: Three-dimensional matrix strategy (ultra-short + wave + trend)
Capital allocation: ultra-short position (300U) → 15-minute fast in and out swing position (500U) → 4-hour level trading + regular investment in BTC
Trend position (200U) → Weekly big opportunity sniping reserve (100U) → Emergency replenishment / sudden opportunities
Ultra-short position (300U, intraday trading)
Strategy: 10x leverage, EMA12 + MACD + (5, 13, 1) signal entry: 15-minute K-line breaks the previous 3 high points + volume increase.
Profit: 3%~5% (flexible trailing stop loss) Stop loss: 2% mandatory stop loss fuse: consecutive 2 losses → pause for 1 hour
2. Swing position (500U, 4-hour level)
Strategy: 5x leverage, Bollinger Bands narrow breakout entry: 4H Bollinger Band width <20% annual line, break above the upper band to go long / below the lower band to go short. Stop loss: 1.5 times the bandwidth. Profit handling: weekly profit of 40% regular investment in BTC.
3. Trend position (200U, weekly opportunity) Strategy: 3x leverage, waiting for extreme market conditions: Weekly RSI+(14)<30 (oversold) or >70 (overbought) Daily consecutive 3 same direction K lines 4-hour TD sequence +=9 (reversal signal) Take profit: trailing stop loss, profit-loss ratio ≥3:1
Three, ultimate risk control (life and death line)
Daily losses > 15% → Mandatory rest for 24 hours Weekly profits > 30% → Halve leverage the next day Monthly withdrawals of 20% profits → Secure the gains
Summary: The first 3 levels (100U × 3 times) → Quickly accumulate capital in the later stage (1100U) → Ultra-short + wave + trend combination discipline > technology! Refuse to hold positions, refuse frequent trading
With this approach, you can both strive for high returns and control risks, suitable for players starting with 300U!
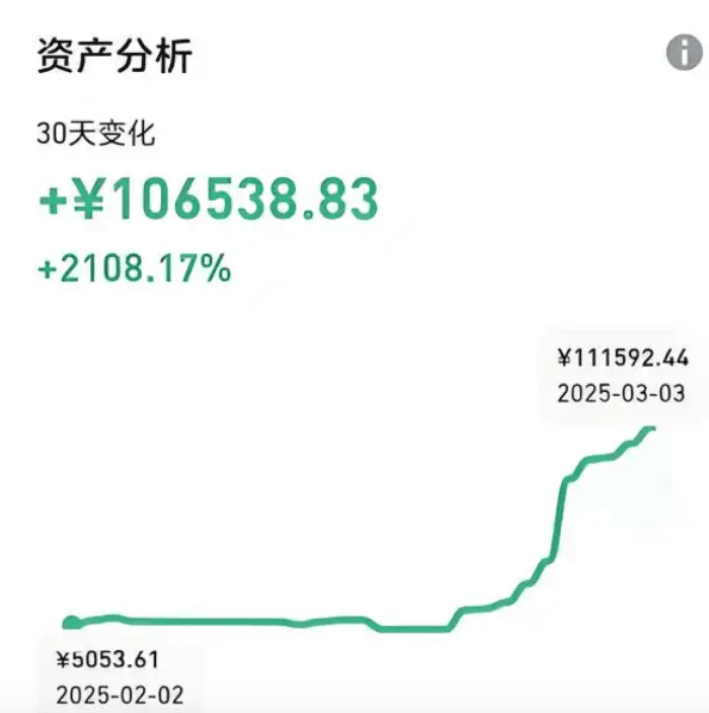
This method is also one I have personally tested: from February to March 2025, in one month, I went from 5000 to 100,000! A profit ratio of 2108.17%!
Author: Zhihu User
Link: https://zhuanlan.zhihu.com/p/1895495429824705856
Source: Zhihu
Copyright belongs to the author. Commercial reproduction requires authorization from the author; non-commercial reproduction must indicate the source.
Next, I will introduce two position management methods!
1. Left-side position management
1) Do not shoot all your bullets at once; buy in batches!!!
2) You can divide the funds into several parts. When you are not sure about the bottom, buying in batches is the most suitable method to average the cost price!!!
(3) The bottom for adding positions should be flexibly handled according to market conditions. Do not add positions too frequently, as that will negatively affect the averaging of the coin price. Initially advancing by 20%, 30%, or 50% is suitable for aggressive investors keen on bottom fishing!!!
(4) Start with a relatively small amount of entry capital. If the coin price does not rise and continues to fall, gradually increase your position, with increasing proportions to dilute the cost. This method has a relatively low initial risk; the higher the funnel, the more considerable the profit!!
2. Right-side position management
(1) Buy 1: When the 5-day moving average crosses above the 10-day moving average, increase the position by 30!!
(2) Buy 2: The coin price effectively breaks the life line. Continue to increase the position by 30% when it pulls back to the life line, ensuring that the total position in the early stage of the upward trend reaches 60%!
(3) Buy 3: Break through the neck line or other important resistance levels, then retest and stabilize, indicating that the reversal pattern has been established; increase the position by 20% again. The total position should reach 80%, holding the coins and waiting for the rise!!
(4) Buy 4: When the coin price appears above the life line again with a golden cross between the 5-day moving average and the 10-day moving average, it is a typical signal for accelerating upward. At this point, the remaining 20% of the position should also be bought in a timely manner to maximize profits!!!
9 Rules of Survival for Short-term Operations in the Crypto Circle!
1. You must learn to wait. Contracts are like passing the drum; after emotional highs, there must be adjustments. After panic, there is a reversal. Use 20% of the opportunities to earn 80% of the profits; this is the irreversible law of the market.
2. Never go heavy, as heavy positions can lead to emotional trading, creating a vicious cycle. Losses are normal; the key lies in mindset and finding new opportunities. To profit, prioritize capital preservation.
3. Be cautious when buying. Do not be impulsive due to a straight surge; there are plenty of opportunities in a big market. Comprehensive indices and sentiment should be used for judgment.
4. Cutting losses must be decisive. If expectations are not met, make a prompt decision and do not waste time on losses. Seek new opportunities.
5. After a big profit, you need to withdraw. A big profit often means the market is very euphoric, and adjustments are imminent. Withdraw in time to clear the euphoria and add color to life.
6. Respect the market; do not judge the market subjectively. If funds have not chosen a direction, do not hold on stubbornly. Engaging in the direction recognized by the market is the right path.
7. Do not take the relay after a peak. The market has reached a peak; the game of passing the flower is about to end. Who will want to take over the next day?
8. Try not to trade in the afternoon; the short-term situation has already become clear in the morning session. When it's time to act, you should have acted. Streamline your trades to avoid unnecessary entanglement.
9. Persist in reflection and summarization. Failure is not terrible; what's terrible is not gaining anything. Let every failure become the foundation of success to go further.
My crypto trading method is very simple and practical. In just one year, I traded up to 8 digits, only entering when I see an opportunity, not trading without a formation, maintaining a win rate of over 90% for five years!
It can be said that I have used 80% of the technical methods in the market, but only the following indicators are the most practical, having caught many tenfold and hundredfold coins! Ignoring this graphic, you could at least miss out on 20% profit!
If you want to treat stock trading as a second job to support your family, you must seriously study this article to avoid at least 10 years of detours!
We have discussed 'breakout trading' many times before, which is an effective way to quickly follow up when a new trend emerges. The best breakouts usually occur when the price breaks through a very obvious resistance level that is being watched by many market participants. At this point, market momentum often sharply increases, attracting more buyers to enter, thus pushing the price further up.
However, capturing these breakouts is not as easy as it seems. In this article, we will discuss four different entry methods for breakout trading, each with its pros and cons.
Remember, choose the method that best suits your trading style to increase the probability of success!
How to enter breakout trading?
Determine the breakout level
Traders first need to determine the key price levels or technical indicators for the breakout. This could be trend lines, moving averages, or resistance levels.
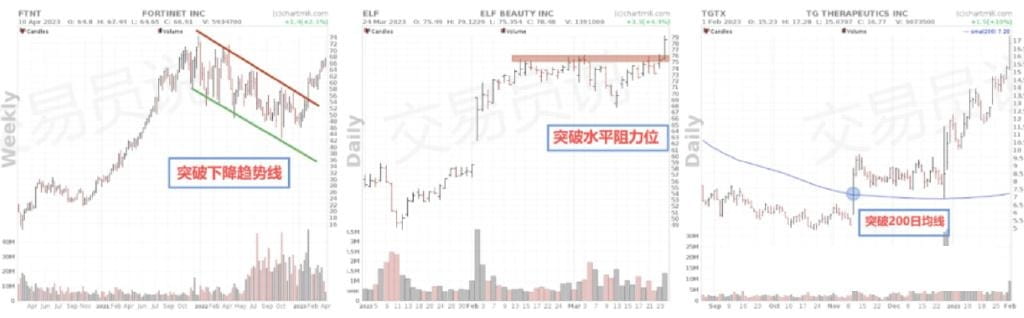
Option 1: Buy before the breakout
It is entirely possible to buy before the actual breakout occurs, which is also known as 'anticipating the breakout'. However, it is undoubtedly riskier than the other options discussed below.
If you decide to adopt this method, make sure to only choose stocks or varieties that show strong momentum and have already increased in trading volume before the breakout.
The main advantage of this method is that if the breakout does indeed occur, you will quickly profit because you anticipated the breakout in advance. However, the breakout may ultimately not occur, or it may fail.
Traders using this strategy typically start with a light position to test, then buy again during or after the breakout to establish multiple positions.
Entry and Stop Loss
Buy when the price is still in the consolidation phase. The initial stop loss is usually set below the consolidation trading channel.
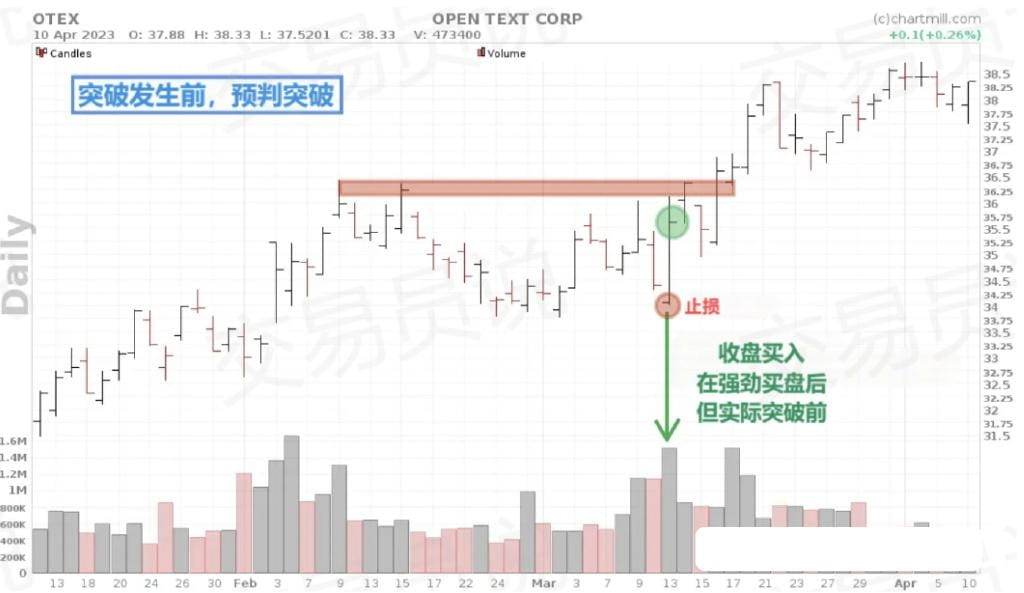
Option 2: Buy during the breakout
Buying during the breakout ensures that a valid breakout has indeed occurred. For this option, it is also necessary to closely monitor momentum and trading volume. Stronger momentum and higher trading volume are early signs of increased buyer interest. This is much more likely to succeed than anticipating the breakout.
Similar to option 1, buying during a strong breakout has the chance for quick profits.
However, there is still the possibility of false breakouts. On daily charts, a false breakout often appears as the price breaks during the trading session but ultimately closes below the breakout level.
In this case, traders need to decide whether to continue holding (assuming the breakout will eventually happen) or to close the position immediately and wait for the price to attempt the breakout again.
Entry and Stop Loss
Once the price breaks through the defined breakout level, buy immediately. The stop loss can be set below the last candlestick (aggressive) or below the consolidation range (conservative).
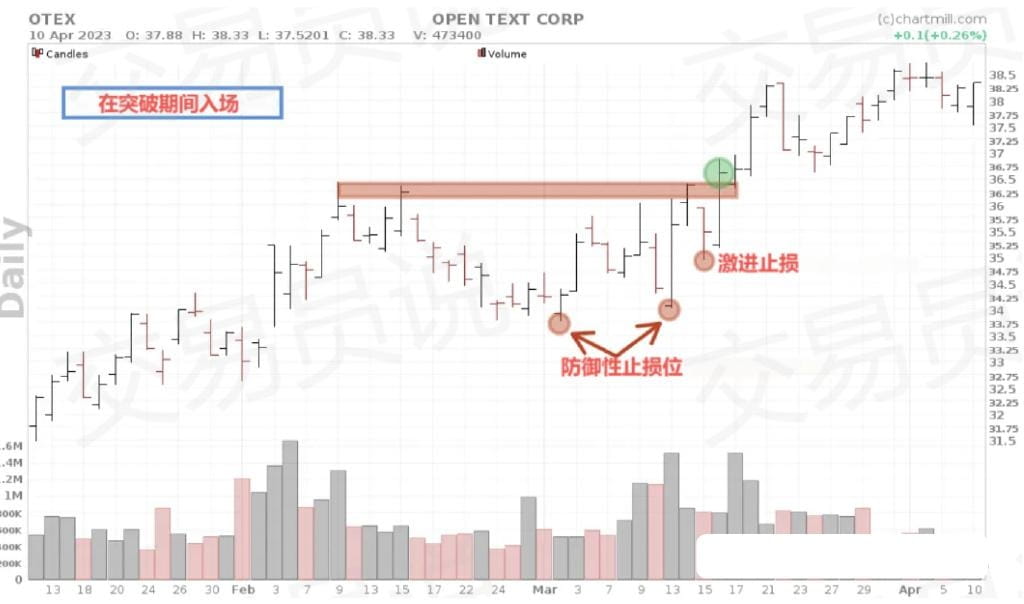
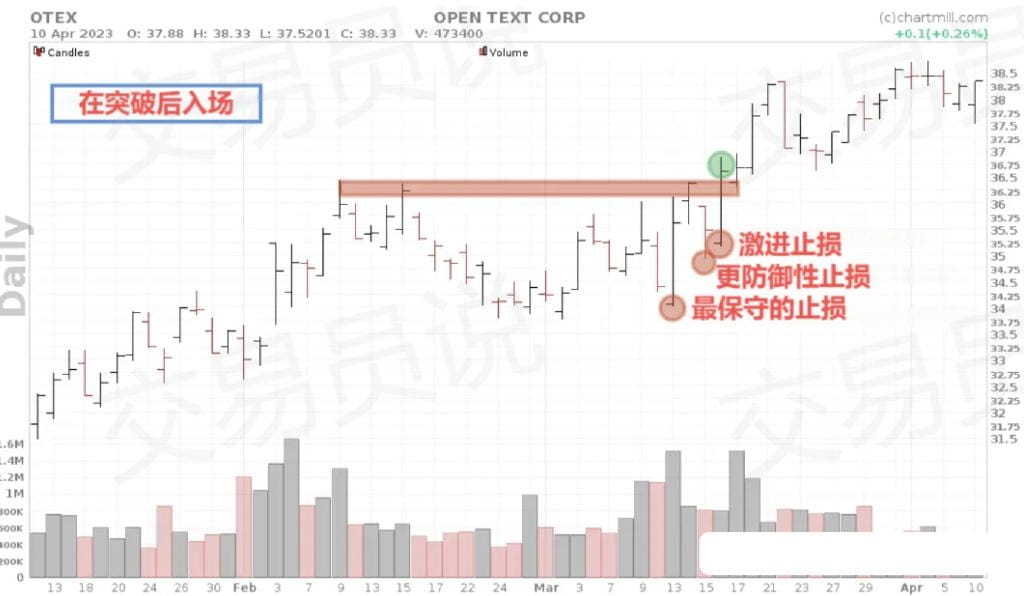
Option 3: Buy after the breakout
Option 3 is a more conservative strategy, but its advantage lies in providing higher certainty. Not only has the breakout occurred, but the breakout is confirmed due to the closing price being above the breakout level at the end of the trading day. This eliminates the possibility of intraday false breakouts.
One major drawback of waiting for a confirmed breakout is that you may miss a portion of the price surge. Breakouts of 10%, 15%, or even higher are common. Not all traders are willing to enter after the price has already surged significantly.
In addition, there is still the possibility that the price will fall back below the breakout level again on the next trading day. Therefore, the possibility of a breakout failure still exists, just not happening on the day of the breakout.
Entry and Stop Loss
Buy once the price closes above the determined resistance level. The closing price depends on the selected time frame. In this case, the stop loss can be set directly below the breakout candlestick (aggressive) or slightly lower to give the price more room to fluctuate, avoiding premature stop-loss (conservative).
Option 4: Buy after the breakout retest
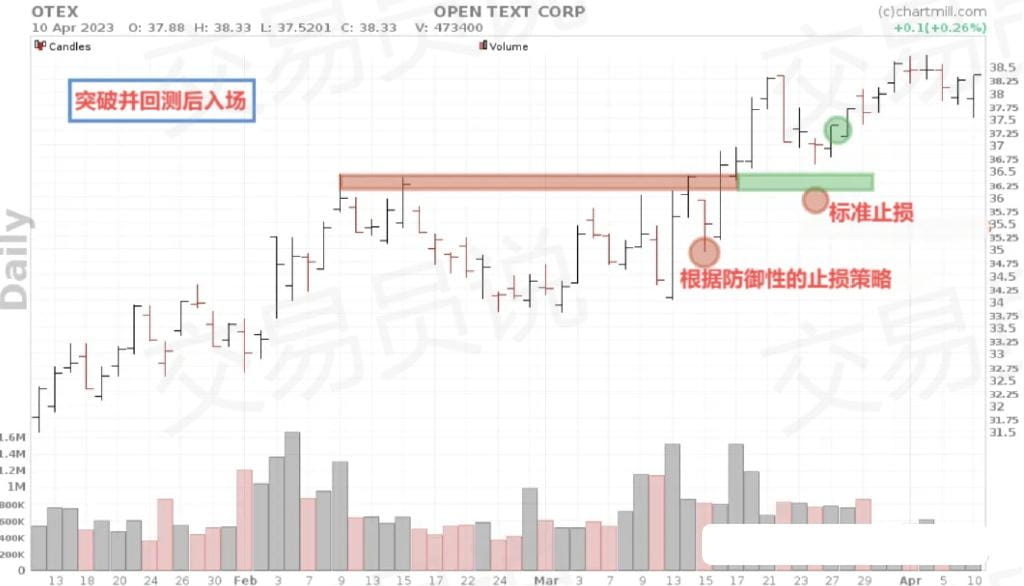
The last method is the most conservative. First, as in option 3, wait for the confirmed breakout to occur. Then, wait for the price to retest the breakout level before entering.
Successful backtesting is an additional confirmation signal after a breakout. This trading method requires traders to have great patience and must be able to resist the temptation to enter early. Those who use this method need to accept that if no backtest occurs after a breakout and the price immediately continues to rise, many breakout opportunities will be missed.
Some traders use the retest method to expand their initial (light position testing) position to a full position. In this case, the method of backtesting is very important. The drop that leads to the price returning to the initial breakout level should be controlled, and the selling volume should be lower than the previous buying volume.
Entry and Stop Loss
Buy after the price retests the initial breakout level. Buy when the price retests the initial breakout level and shows a reversal signal. The stop loss is usually set not far below the breakout level. However, you may also choose a more conservative approach by using the previous fluctuation low point as the stop loss.
How to exit successful breakout trades?
After a successful breakout, properly managing long positions is crucial for achieving structural profits in the long term. Depending on your trading style, there are several methods to achieve this.
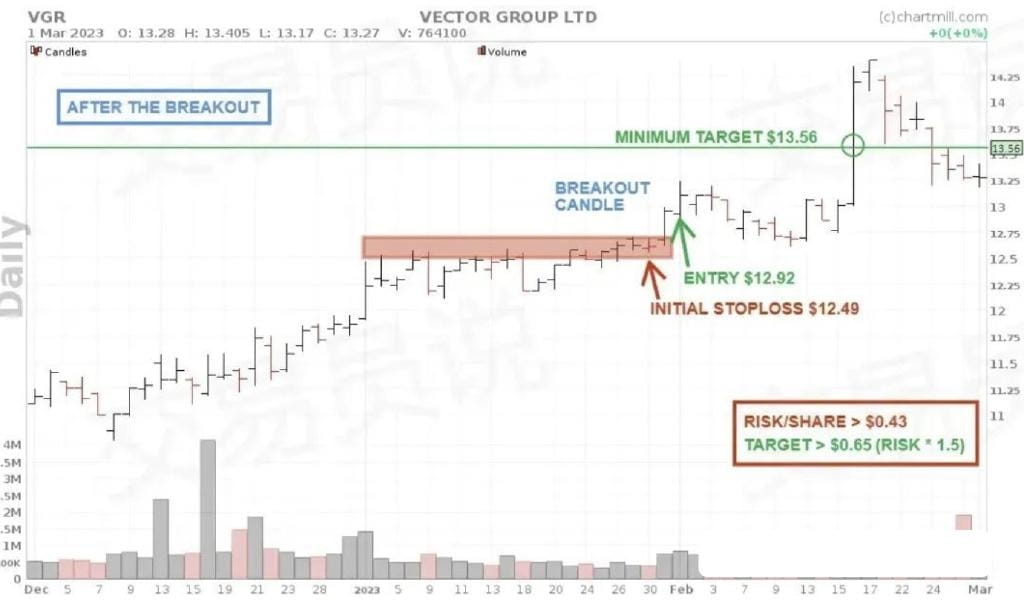
1. Set price targets
Set the price target along with the entry and stop loss. Ensure your target is at least 1.5 times the initial stop loss.
For example, if you buy a stock at 12.92 yuan and set the stop loss at 12.49 yuan, the risk per share is 0.43 yuan. Therefore, if we want the price target to be at least 1.5 times the risk, we need to achieve at least 0.65 yuan in profit (0.43 yuan * 1.5). In this case, the minimum price target should be set at 13.56 yuan.
Assuming half of your trades are stopped out and the other half reach the take profit target, this exit strategy can still yield profits.
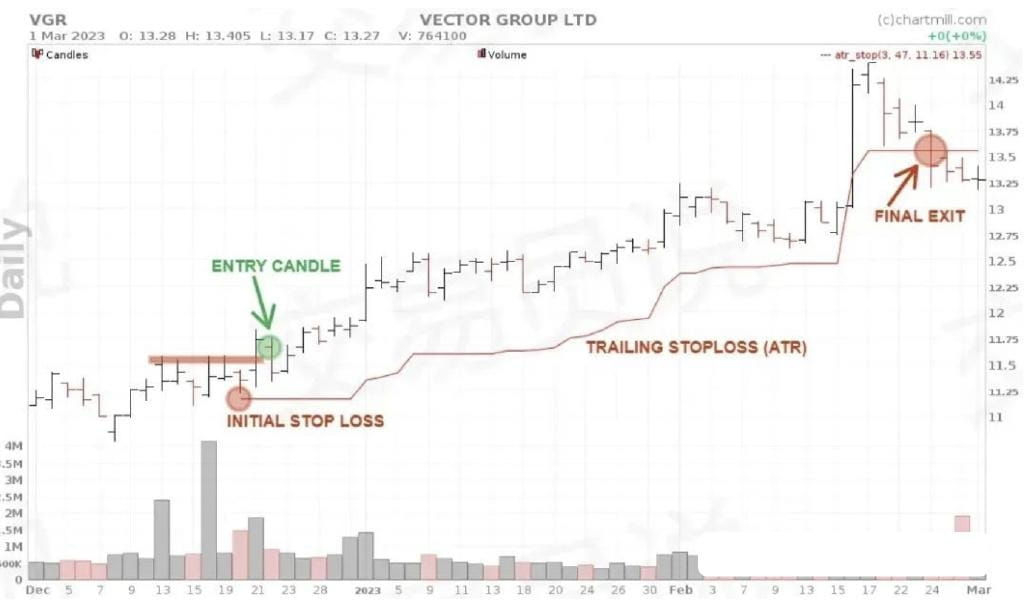
2. Use trailing stop loss
This type of stop loss can ensure that some accumulated profits are protected when the price declines. However, as long as the price rises, the trailing stop loss will also rise, thus protecting a larger proportion of the profit.
3. Use technical indicators
Many technical indicators can provide insights into price trends, helping you determine whether the momentum of the existing trend is strengthening or weakening. Below, we will discuss several commonly used indicators that are helpful in this regard.
◎ RS Indicator
This is a momentum oscillation indicator used to measure the speed and variation of price changes. The default upper limit value of this indicator is 70. Values above this are considered overbought.
Traders should be aware of possible trend changes (short-term or long-term). Especially the divergence between the RSI indicator and the price should be closely monitored to detect price changes in the early stages.
◎ MACD Indicator
This is a trend-following momentum indicator composed of the MACD line and the signal line. The MACD line crossing below the signal line can serve as an exit signal for existing long positions.
◎ Bollinger Bands
Bollinger Bands are used to monitor the volatility or degree of fluctuation of prices. The upper and lower limits of typical price fluctuations are defined by the standard deviation of the moving average. If the price exceeds the upper limit (upper Bollinger Band), it may indicate an overreaction in price and may trigger a price drop. Based on this, existing long positions can be closed.
Be cautious when using technical indicators as exit signals. During strong trend movements, they can generate many false signals, causing prices to rise further and leading to long-term missed profits.
It is best to use indicators as warning signals. Instead of closing positions immediately, it is better to manually adjust the stop loss slightly closer to the current price using exit signals.
If the exit signal is correct, you will eventually be stopped out (while retaining most of the profit). However, if the price continues to rise, you will continue to profit from the upward trend.
How to exit failed breakout trades?
Just like managing profitable positions, properly managing losing positions is also crucial. The only swift and effective method is to use hard stop losses.
When using a breakout strategy, traders expect the trend to continue after the breakout. If the breakout fails to continue and the price declines again, the stop loss will ensure that losses are limited.
Previously, we mentioned the approximate location of the initial stop loss in each option. In this regard, we want to emphasize two points:
1. Pay close attention to important support levels and strategically set the stop loss below these support levels. If previous support levels fail to cause a price rebound, this is a strong signal that the price may fall further. The stop loss will protect you from larger price declines.
2. Do not set the stop loss too close to the current price. In this case, the stop loss may be triggered too early. In many cases, you will notice that shortly afterward, the price will move in the expected direction. This can lead to a lot of frustration!
Summary
Key Points
1. Trading based on price breakouts is an excellent way to take full advantage of new market trends.
2. After confirming the breakout, you should always pay attention to momentum and trading volume before deciding to open a position.
3. The four entry methods for breakout trading include 'buying before the breakout', 'buying at the breakout', 'buying after the breakout', and 'buying when retesting the breakout level'. Each method has its pros and cons.
4. Choose the method that best suits your personal trading style, which can provide you with the greatest chance of success.
5. Risk management also plays a crucial role in long-term success. A reasonable exit strategy that protects profits or limits losses is vital in this aspect.
Frequently Asked Questions
1. Can breakout trading make money?
Generally, breakout trading can be very profitable. Successfully identifying a breakout and entering at the right time can yield considerable profits, but there is always the possibility of false breakouts or prices not moving as expected. Remember, no strategy can only generate profits without encountering losses.
Therefore, achieving sustained profits through breakout strategies is closely related to reasonable risk and position management. To this end, ensuring a profit-maximizing and risk-reducing exit strategy (whether for profitable or losing positions) is crucial.
2. What is the ideal time frame for breakout trading?
Breakout trading can occur across different time frames. Breakout patterns can appear equally on 5-minute charts or monthly charts.
The ideal time frame for breakout trading depends on the following factors:
● Your trading style and strategy
● Current market sentiment and overall market trend
● The volatility of the financial products you trade
Short-term breakouts (entry and subsequent operations completed within a few hours to a few days) are primarily used by day traders and swing traders. They mainly use intraday charts (5 minutes, 15 minutes, 1 hour, etc.) to identify areas of price breakouts.
Long-term breakouts (the main goal is to participate early in ongoing trends lasting several weeks or months) are the preferred area for position traders. They mainly focus on daily and weekly charts to determine when and where to enter.
3. How to avoid false breakouts in trading?
To avoid false breakouts as much as possible, you can take the following measures:
● Wait for the breakout confirmation, with the price closing above the resistance level. Although doing so may miss the actual breakout market, it can also avoid many false breakouts.
● Pay attention to additional confirmation factors supporting the breakout. A significant increase in trading volume before and after the breakout is the most important parameter. Avoid breakouts with only moderate volume.
● Observe long-term trends. Focus on varieties that have shown a significant long-term upward trend for upward breakouts.
● Consider the overall market trend and market sentiment. Breakouts are most effective when the overall market is bullish.
Playing in the crypto circle is essentially a battle between retail investors and big players. If you don't have cutting-edge news or first-hand information, you will only get cut! If you want to layout together and harvest the big players, you can follow me.
#BTC再创新高 #币安八周年 #币安钱包TGE
Keep an eye on:$BTC $ETH $BNB