


Even if you gamble with a win rate of 90%, without capital management + strategies, your final outcome can only be zero; if you add leverage...
Considering fees, accounting for various uncontrollable risks, you will go bankrupt faster.
I did a simulation: conduct a complete trade once a week at different high win rates, with a win-loss ratio of 1:1, what should your best position be?
It can be seen: The higher the win rate, the larger the position can be increased each time, but if you go all in, there will be a risk of going to zero; even with a high win rate...
Reduce every position to a low level when reaching 70%.
Investors with a 90% win rate who do not focus on capital management will go bankrupt.
So for ordinary people, what should you do to profit in this market?
1. Win rate and predictions are not important; position management, stop-loss+, and win-loss ratio are more important.
Why can a trading strategy with a win rate exceeding 90% lead to bankruptcy?
And why have traders like Fatty, V, Tony, and Ouyang, who have win rates around 50% or even lower, made big money?
Because position size, stop-loss, and win-loss ratio are more decisive for your final profit than win rate: a trade with a 30% win rate and a win-loss ratio of 10, and a win rate...
90% of win-loss ratios of 1 trades are obviously easier to make money; the former is easier to profit with a high win rate, but the substantial losses caused by heavy positions without stop-losses are evidently worse.
Low win rates with position management + stop-loss strategies lead to larger losses.
In the cryptocurrency market, those who can consistently make big money can guarantee they are heavily invested when the trend arises and can promptly recognize mistakes to avoid losses.
Injuries.
I have paid over a million in tuition to understand: Making money in cryptocurrencies does not require complex operations.
This method can be learned even by elementary school students; following it can outperform 90% of the average traders.
1. Coin selection tips: Look for strong coins recently, screening for coins that ranked in the top 50 in the past 11 days, but avoid those that have dropped for three consecutive days.
Directly drawn away! This could be a trap set by whales to raise prices for selling.
Open the monthly chart at the monthly level, only look for coins that show 'golden finger' signals—MACD two lines cross upwards at the bottom; these coins are significantly...
Probability triggers major market movements.
Focus precisely on the daily chart, watching the 60-day moving average. When the coin price retraces close to this line and a large bullish candlestick appears, it is the best buying point.
2. Buying and selling mantra.
Buying confirmation, for example: BNB current price is $280, the 60-day moving average is at $260. When the price drops to $265 and suddenly surges with volume, enter immediately!
Laddering profit-taking method: Sell 1/3 when rising 30%, sell another 1/3 when rising 50%, and hold the remaining 1/3 until the end of time (unless it falls below the life line).
Life-saving trick: After buying, if the closing price drops below the 60-day line, immediately liquidate! Remember it’s the closing price, not a spike; confirm at midnight.
3. Pitfall prevention guide.
Do not buy altcoins ranked outside the top 100 by market capitalization, do not buy those with a 24-hour trading volume of less than $10 million, and do not buy projects that have had no movement from the project team for three months.
Pause operations in the following situations: when the major currency suddenly surges or plummets over 10%, when the US announces interest rate hikes, or when exchanges experience outages.
Heard.
Position control secret: Divide your funds into 10 portions, buying only 1 portion each time. Always keep 30% reserved; during a crash, you will be in control!
4. Mental state training.
Set up automatic reminders in T...w to set price alerts (60-day line ±3%), and only act when you hear the 'ding' sound to avoid impulsive trading.
Spend 5 minutes every night at 10 PM checking: whether the positions are above the 60-day moving average, whether the major currency is in sideways consolidation, and if there are any sudden major news events.
Remember: This method is like cruise control in driving, allowing you to reach your destination safely. But when encountering heavy rain, you must take control of the steering wheel! Go practice now, and next month you will come back to thank me.
In trading, we must understand a principle: do not take left-side trades to take risks; the right way is to steadily follow the right-side trend. When making trades, try to choose larger candlestick charts, as larger cycles naturally have less volatility, which aligns more with our logic of following the trend.
Before taking action, first check the 4-hour and daily lines, as they can help us judge the larger trend, whether it's bullish or bearish. For example, if both the 4-hour and daily lines show bullishness, then today we should focus on long positions, with short positions as a supplement, keeping the win-loss ratio under control. Next, we use the hourly line to find breakout points, setting alerts in advance; once a breakout occurs, take action, and allocate positions according to the previously judged long-short ratio. If it’s a bullish breakout, then go in boldly with heavy positions, at least four times the short position.
Let’s clarify the matter of stop-loss. If encountering a false breakout, meaning that the breakout signal is invalid, we should use the 30-minute K and hourly K to set stop-losses. If the 30-minute K deviates, and the bullish trend is lost, then we lose 30%; if the hourly K deviates, we lose everything. What we play is the win-loss ratio, not the win rate. Set stop-losses small, and the loss is controllable. Remember, stop-loss discipline must be strict; since it has deviated, we must be decisive.
Counter-trend trades, such as short positions, can also be opened, but be cautious. As long as they align with breakout logic, enter accordingly. If a counter-trend trade profits, close half at 6 points and close all at 8 points. After all, it's counter-trend; take a bite and run, safety first. Stop-loss should still follow the methods above; light positions mean stop-losses won't hurt.
As for taking profits, let’s talk about that too. For large positions in a big cycle, take profit at 10% by closing half. For the remaining positions, close part when 30-minute and hourly K lines show turning points, meaning the bullish trend has broken. Close 15% at the 30-minute turning point and 30% at the hourly turning point; if no turning points appear, don’t close, hold the positions steady, and wait for signals to shift before taking action. Don’t close randomly based on gut feeling; instinct is not for the big players; it’s just guessing. Closing based on instinct can easily miss big profits, and once the mentality is unbalanced, trading is finished. Trading is all about mentality and judgment; small losses for big gains; control the win-loss ratio well.
Like the expert Wang Bai, he also follows this logic, but he looks more closely, focusing on both 15K and 5K for shorter-term trading. Wang Bai's win rate isn't high, but he plays his win-loss ratio smoothly and still makes a lot of money. Adding positions against the trend is a big taboo; don’t do foolish things like cutting firewood for a day and burning it all in one day.
The path of trading must be explored slowly; don’t rush, keep your mentality calm, control your win-loss ratio well, and you can become an expert.
I have summarized my over ten years of trading experience to provide four suggestions for price action trading, hoping they are useful to everyone.
Price action trading technique 1: Don’t only trade candlestick patterns on the chart.
The meaning is simple: A common problem for price action traders is only trading candlestick patterns (K-line patterns) without considering other types of analysis comprehensively. Candlestick patterns are great, but if they become your only reason for entering the market, you will fall into a very frustrating situation.
This is how I see many price action traders react to certain candlestick pattern signals: This is the rhythm of picking up Ferraris; the PinBar pattern is like a 'money printer'...
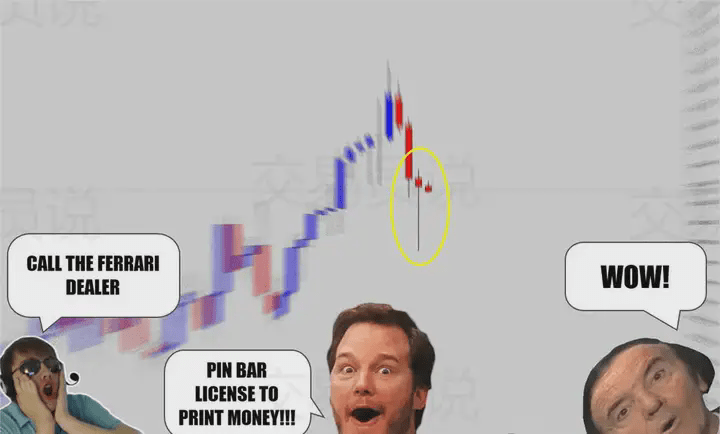
Everyone knows candlestick patterns, and every price action trader can find them on the chart, but you may find they don’t significantly help your trading results. One-sided analysis of chart information and data makes it hard for traders to maintain balance in account trading; when losing, they can only think negatively.
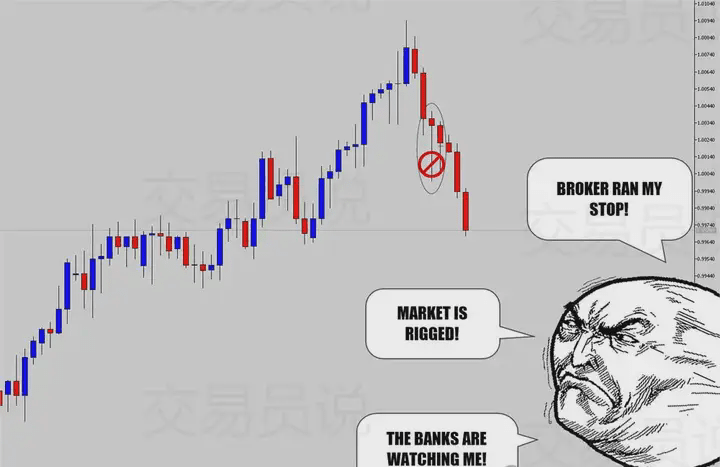
The same price action trading signal may appear twice simultaneously, such as a Rejection Candle (pin bar is a very important entry signal). One instance may have high value, indicating a great trading opportunity, while the other may only be an illusion. When analyzing price action candlesticks, we should not only look at their forms but also consider whether they carry other value meanings.
The following chart is a price action trading example with certain value:
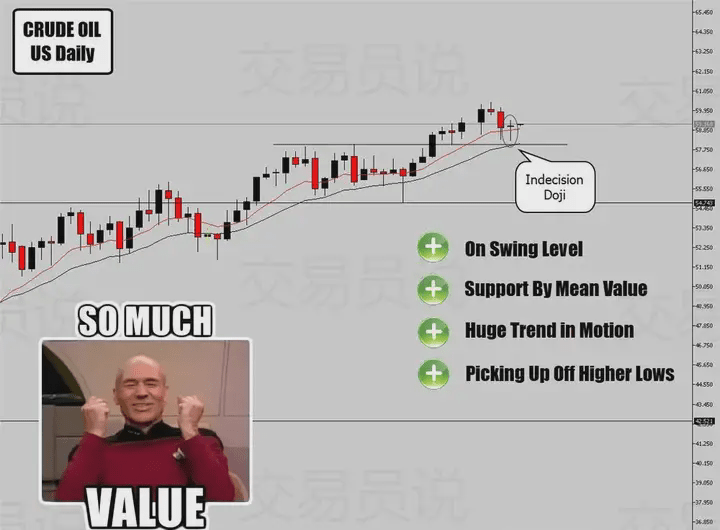
We need to focus not only on the candlestick patterns of price movements but also on trading ideas that include other value points.
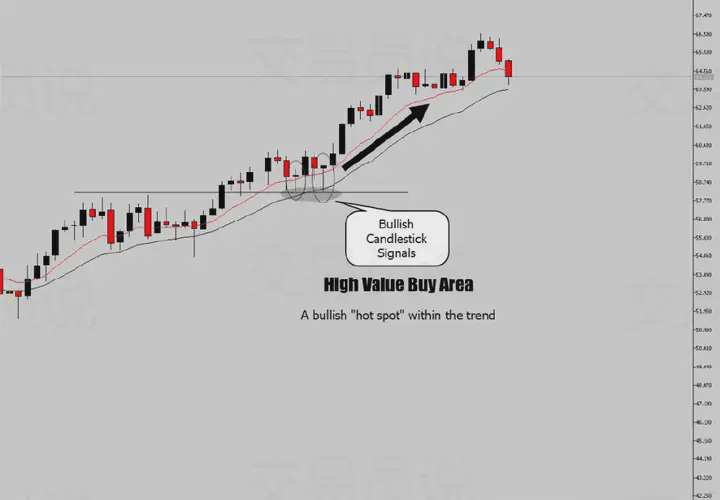
When searching for trading signals, quality is the most important; increasing the number of signals can be achieved by considering more factors of price movements, such as turning points, price structural levels, support and resistance levels, etc. This is no secret... I have mentioned this point many times in my discussions with other traders, but it seems no one pays attention.
Price action trading technique 2: Learn to utilize market structure.
One point that everyone may often hear but few practice is to use technical analysis to identify market structures. To define the current market behavior model, I think the simplest example is a ranging market, where prices fluctuate within a range, and the upper and lower limits are good structural points where great trading opportunities arise.
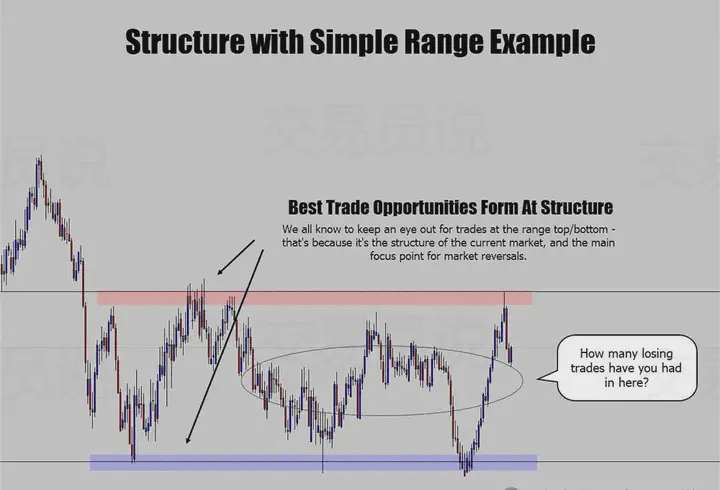
In the chart above, the red upper limit and purple lower limit can easily form good trading opportunities. However, many losses accumulate due to 'off-position' trades in price action trading structures.
Sometimes I find that prices appear chaotic in larger time frames, such as on the daily chart.
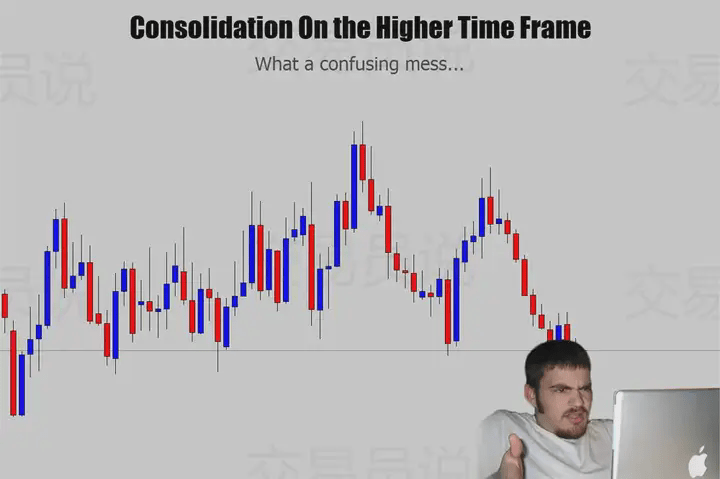
The daily chart above does not look friendly, but sometimes if you narrow down the time frame, you can discover some market structures that can be traded, such as the channel patterns visible in the following 8-hour chart, where trading opportunities also exist.
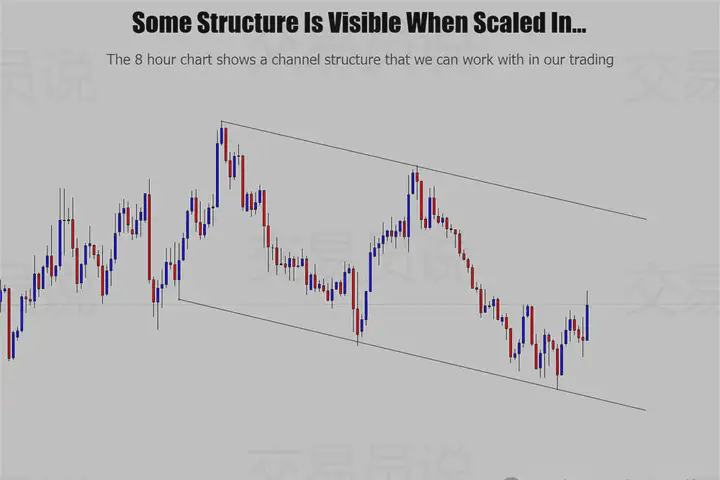
I didn’t notice this channel on the daily chart initially, but it became very clear on the 8-hour chart. Now we know where to look for high-value price action trading signals.
The squeeze pattern is often seen as another form of consolidation structure... but sometimes, if their space is large enough, we can trade rebounds within the structure.
As a price action trader, you must pay attention to market structure. Structural analysis is also a simple and clear principle; using it can help you avoid some high-risk trades.
Generally speaking, I believe that traders who ignore structure seem to engage in higher risk trades, which are likely to cause losses and are prone to cascading stop-losses.
Structural analysis is a principle to keep simple, but if you adopt it, it will be very helpful; if you ignore it, the results can be quite bad.
Price action trading technique 3: Make good use of top-down analysis.
Some price action traders like to trade small time frames, thinking that 'more volatility means more opportunities.' However, I personally think this concept is incorrect.
Some novice traders are eager to become day traders, while those seeking high returns delve into scalping strategies. I believe both methods are futile and can harm trading psychology; I have seen too many scalpers blow up their accounts.
When I mention lower time frames, I refer to volatility trading environments. Generally, 4 to 12 hours is the time frame for intraday volatility trading... 1 hour can be used, but only in very clear scenarios.
I tend to use lower time frames to look for signals consistent with larger time frames. The 'low' time frame mentioned here is also based on swing trading as a reference standard, usually 4 hours.
For example, technical analysis on the daily chart shows a good buying opportunity, but we can’t wait until the end of the day to see if it’s truly a good opportunity; this is the right time to look for similar signals in smaller time frames.
For example, in the following chart of the NZD/USD trade, I first look for potential price reversal points on the weekly chart.
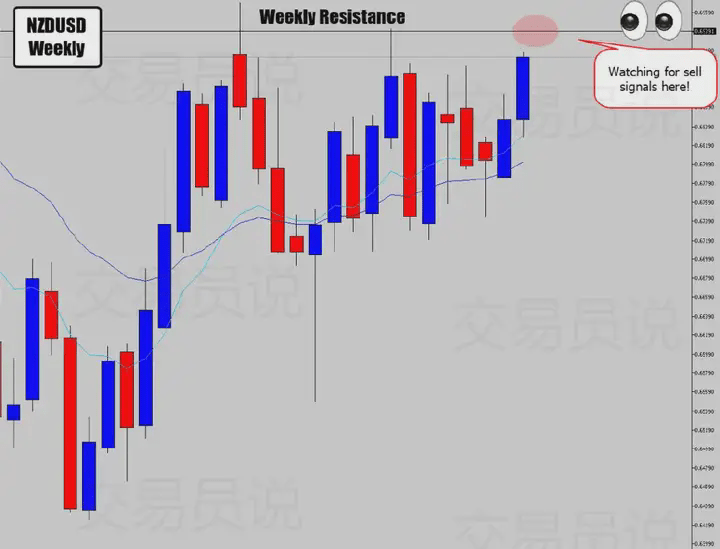
There is an obvious weekly resistance here. If we see bearish price movement evidence, it may present a good shorting opportunity.
One of my price action trading techniques is to focus on early (but clear) signals formed by intraday fluctuations on the chart, rather than waiting for certain events to happen weekly or daily.
Then I check the 4-hour chart:
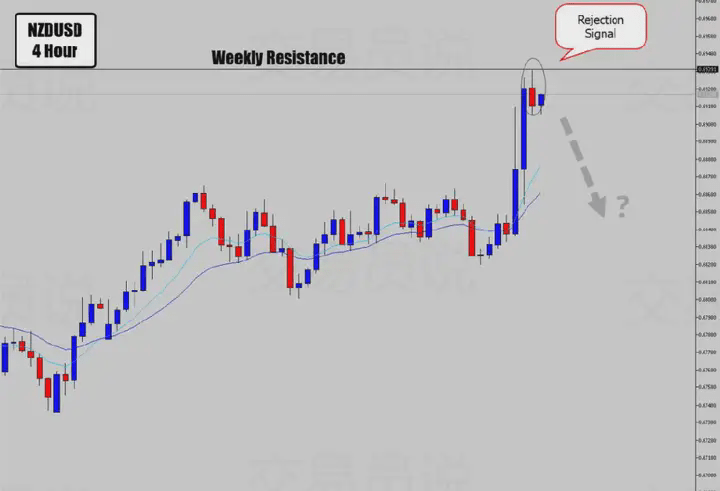
At this point, top-down analysis shows its value. From the 'top' (large time frame), we know to look for sell signals because there is obvious resistance on the weekly chart. It’s easy to miss this point. With top-down analysis, we know where to look for bearish signals within the trading time frame.
The macro forces of price action signals on this 4-hour chart and the micro forces applied to them...
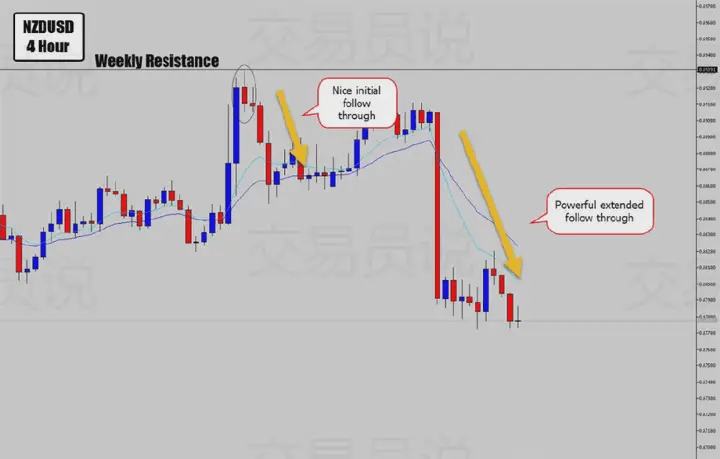
The 'high value area' warning signals from the 4-hour chart can be followed up well.
For most traders, seizing the first wave of selling opportunities is satisfactory, while a few traders who can see further and persist can reap the second wave of stronger profits.
The top-down analysis method is definitely not as simple as this example; its usefulness requires you to explore further.
Price action trading technique 4: Choose trades based on the direction of market funds.
In price action trading, it is easily overlooked but very important that there is always a 'theme' that everyone pays attention to in the market. This means that there is always a force that drives money to move in a certain direction, creating very good trading trends.
For example, in recent years, the hot cryptocurrency market, I don’t know how everyone is doing, but that was my easiest and most profitable trading experience. After the cryptocurrency boom faded, the US dollar became the focus again; whether it was due to Trump or other factors, as price action traders, we only trade what we see, not what we think, right?
Now, the market's hotspots or the hotspots of funds have focused on themes like 'AI artificial intelligence,' 'Federal Reserve interest rate cuts,' and 'geopolitical situations.' This year, traders can concentrate their efforts on trading varieties related to these themes.
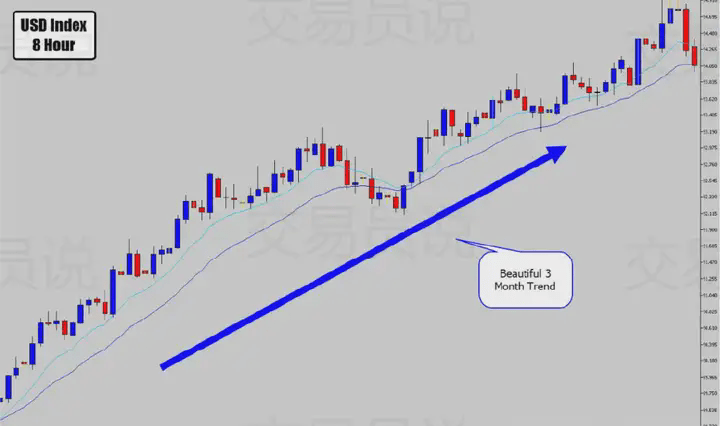
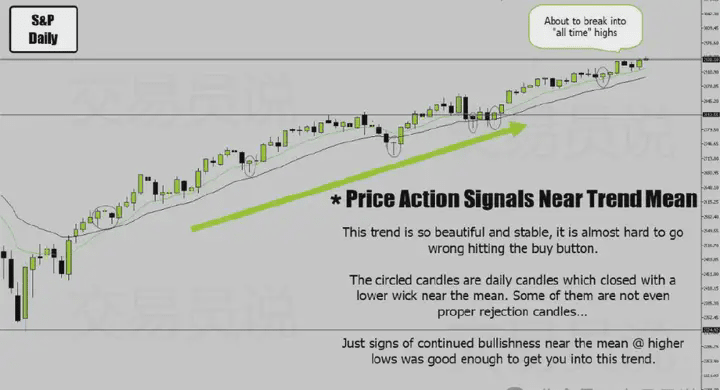
The following chart shows the trend of the US dollar index rising after the dollar became the focus. It can be said that buying at any time would easily make money.
The stock market is more favored by funds:
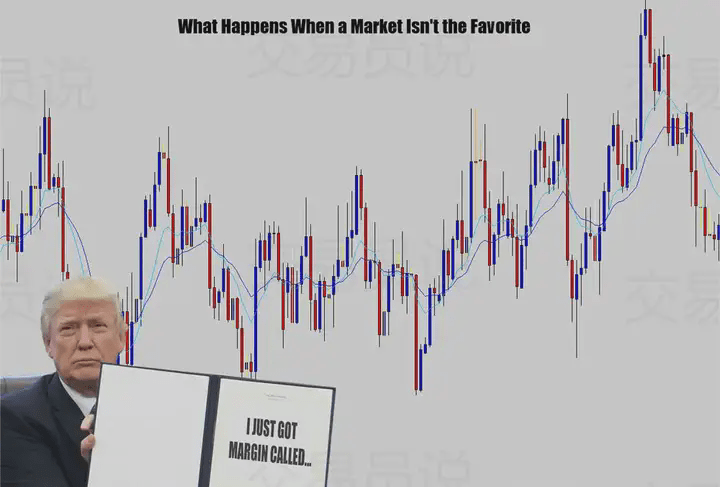
"The trend is your friend." However, in the past two years, the forex market has clearly not been favored by market funds. You can see that one of the most popular forex currency pairs, EUR/USD, is not optimistic.
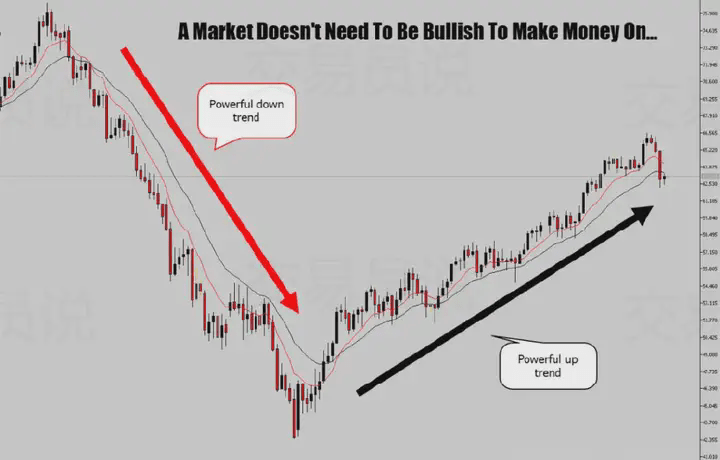
From various factors such as market trends and the focus of brokers' services, it can be seen that funds are currently most concentrated in stock indices (stock indexes) and bulk commodities (gold and crude oil). At this time, it is recommended that you expand the range of your trading and try these hot trading varieties.
The purpose of trading is to gain profit. The flow of funds in the market naturally becomes what we need to focus on. Don’t be confined by narrow trading concepts; it’s best to adjust your trading goals and methods based on the market promptly.
That’s all for today’s sharing of trading insights; I hope it helps traders.

Ten tips for trading cryptocurrencies to earn a million a year!
1. Stay calm and rational: In the cryptocurrency market, rationality and patience are the cornerstones of success. Avoid impulsive behavior driven by greed to prevent missing good opportunities.
2. Understand the overall market: Don't just focus on the 'whales' movements; the market is affected by multiple factors such as the global economic environment, policy dynamics, and technological innovations, and should be considered comprehensively.
3. Understand the dilemmas of major players: Grasp the logic and difficulties of major players' operations, but maintain independent thinking and not be swayed by their actions. The market is complex and variable, making it hard to grasp the intentions of major players.
4. Pay attention to unusual movements at the bottom: Increased volume at the bottom may indicate an influx of funds, but it should be analyzed in conjunction with other indicators to guard against false breakout traps.
5. Respond calmly to market fluctuations: Fluctuations are the norm in the market, aiming to eliminate impatient investors. Maintain composure and make decisions after the trend becomes clear.
6. Medium-term positioning and position management: Select cryptocurrencies to hold long-term, while keeping some funds flexible for operations, optimizing investment efficiency through rolling strategies.
7. The essence of short-term trading: Short-term trading requires keen market insight and decisiveness. Pay attention to candlestick patterns, market sentiment, changes in popularity, and rising rates.
8. Bottom-buying strategy: Buying during the bottom phase is relatively stable, but wait patiently for confirmation signals to avoid blindly catching the bottom.
9. Be cautious when chasing prices: Chasing prices may yield quick profits, but risks also increase. Accurately assess the sustainability of the upward trend to avoid standing at high positions.
10. Comprehensive use of technical indicators: Divergence phenomena are important signals in technical analysis, but should be combined with other analytical tools and market realities to avoid one-sided judgments.
Still the same saying, if you don’t know how to operate in a bull market, click on Kway's avatar, follow him, and plan for cash in the bull market, contract passwords, and share without charge.
Keep an eye on: $ETH $SOL #现货以太坊ETF获美SEC批准