

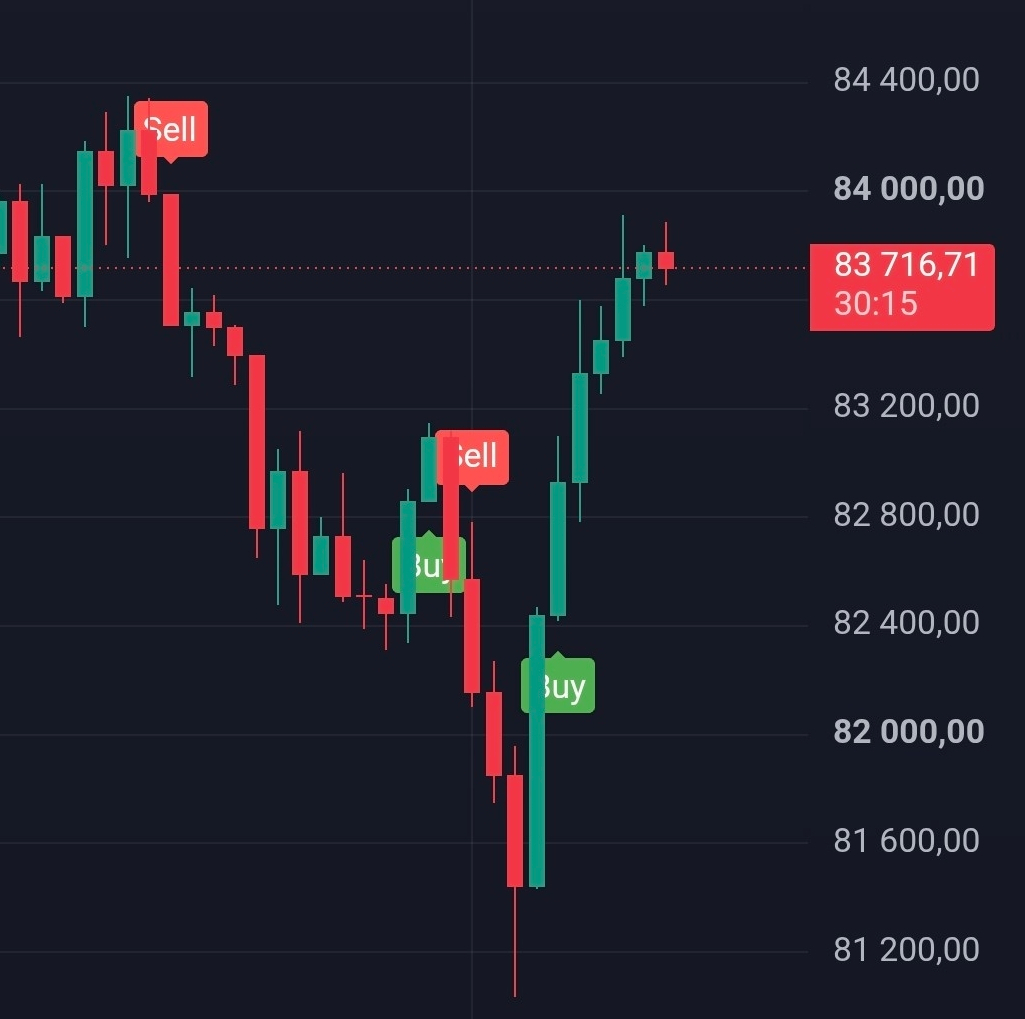
$XRP $ETH $BNB
Support and Resistance: Recent technical analysis shows that XRP is trading within a narrow range, with key support at $2.45–$2.50 and resistance at $2.65–$2.70.
Technical Indicators: The Relative Strength Index (RSI) is at 49.83, indicating a neutral market condition, while the MACD shows a slight bearish crossover, which may indicate potential selling pressure.
Future Forecasts
Long-Term Technical Analysis: Analysis using Fibonacci levels and Elliott Wave Theory suggests that XRP could reach $15 by May 2025, provided the upward momentum continues.
Diverse Forecasts: Predictions for 2025 range between $1.8 and $8.4, with some optimistic scenarios suggesting the possibility of exceeding $10, depending on XRP adoption and resolution of regulatory challenges.
Conclusion
XRP appears to be in an accumulation phase, with strong support at current levels. If it can break through resistance at $2.65–$2.70, it may see a rise towards $2.90–$3.00. However, support levels at $2.45–$2.50 should be closely monitored, as breaking them could lead to further declines.
Please note that these analyses are based on available data up to now and may change as the market evolves.
#TradingTypes101 #MarketPullback #Bitcoin2025