


☘️ What is a Japanese candlestick chart?
Japanese candlestick charts are one of the most popular tools in technical analysis, especially in the crypto market. Each candle represents the opening price, highest price, lowest price, and closing price within a specific timeframe – for example: 1 hour, 1 day, etc. Mastering candlestick patterns helps you identify trends, find reversal points, and make better trading decisions.
Candle color helps you see quickly:
• Green candle (or white): price increases.
• Red candle (or black): price decreases.

How to use Japanese candlestick patterns in market analysis:
Each candlestick pattern tells a unique story about supply and demand, buying – selling psychology. Some patterns indicate hesitation, while others signal reversals or continuation of trends. But importantly: candlestick patterns are not absolute buy/sell signals. Treat them as early warnings – and combine with other tools like RSI, MA, Bollinger Bands, MACD, or Ichimoku for further confirmation.
☘️ 4 Candlestick Patterns Indicating PRICE INCREASE
1. Hammer
Appears at the end of a downtrend, with a long lower shadow (double the body). Indicates that sellers tried to push prices down but buyers countered strongly, pulling the closing price up near the opening level.
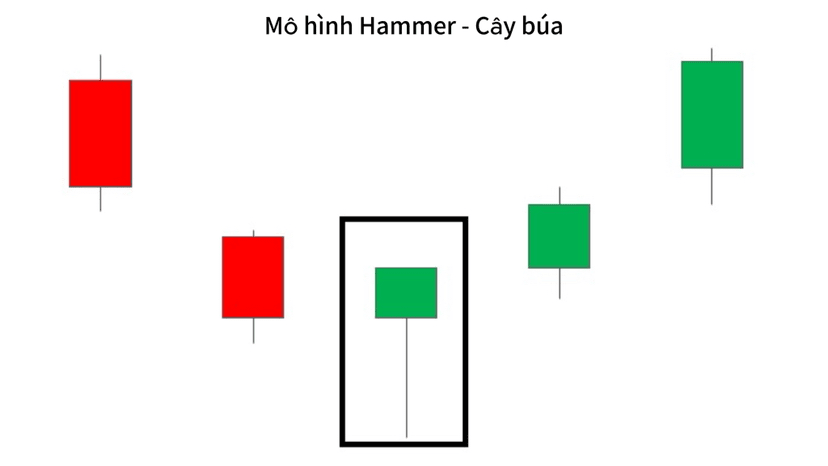
2. Inverted Hammer
Similar to Hammer but with a long upper shadow. Although it couldn't maintain the increase during the session, the appearance of this candle indicates that buyers are starting to come back.

3. Three White Soldiers
Consists of 3 consecutive bullish candles, long body, short shadows. Each candle opens near the closing price of the previous one. A clear signal of strong bullish momentum.

4. Bullish Harami (Mother and Child in an Uptrend)
Long red candle followed by a small green candle completely within the body of the previous candle. Indicates that selling momentum is weakening, a bullish reversal signal may be imminent.

☘️ 5 Candlestick Patterns Warning of PRICE DECREASE
1. Hanging Man
Similar to Hammer but appears at the end of an uptrend. Long lower shadow indicates that selling pressure is beginning to rise, warning that the market may reverse.

2. Shooting Star
Inverse hammer but appears after a price increase. Long upper shadow, small body. Indicates that the price has risen but is strongly suppressed by sellers.

3. Three Black Crows
Consists of 3 consecutive bearish candles, each closing lower than the previous one. Indicates that selling pressure is clearly dominant.

4. Dark Cloud Cover
Red candle opens higher than the previous green candle but closes below the midpoint of the green candle. Warns of a reversal from bullish to bearish.

5. Bearish Harami (Mother and Child in a Downtrend)
Opposite of Bullish Harami: long green candle first, followed by a small red candle contained within the green candle's body. Signals that buying pressure is weakening.

☘️ 2 Patterns Indicating CONTINUATION OF TREND
1. Rising Three Methods
1 long green candle → 3 small red candles → 1 strong green candle → uptrend continues.

2. Falling Three Methods
1 long red candle → 3 small green candles → 1 strong red candle → continues to decrease.

☘️ Doji candle pattern – Hesitation signal
Open price ≈ close price → market hesitation, unclear trend.

Common forms:
Long-Legged Doji: Long upper and lower shadows → strong volatility but unclear direction.
Dragonfly Doji: Long lower shadow → may indicate a bullish reversal.
Gravestone Doji: Long upper shadow → warns of a bearish reversal.
In practice, due to the high volatility of crypto prices, the spinning top candle pattern is often used instead of Doji because they are similar in meaning.

🍀 Conclusion
Japanese candlestick patterns are one of the most basic yet effective tools in technical analysis. Whether you are a day trader or holding long positions, understanding and recognizing candlestick patterns will help you read the market better.
However, do not view Japanese candlesticks as a 'magic wand' – use them in conjunction with the overall trend, technical indicators, and careful risk management. Because the market always reflects emotions – and you need to keep a cool head and act with a plan.
#binancetrading #cryptosignals #TAO


